all right a quick summary of the reports the reports in CTE are the power that drives everything it gives you that visual data inside of your business so real quick I just want to cover some of them and they're all right here on the top of your homepage so the whiteboard is right here this is going to show you all of your newest listings your oldest listings your closest to expiring all of your upcoming closings and then your latest closings that you've had as well down at the bottom so that will be there there's a
show all button where you can actually view all contracts as the white board is going to give you a snapshot in case you have more pendings at what is on here you can click that show all the next one is going to be your CEO summary this is going to show you your completion to all of your goals for the year so you can see the listings taken where are you at and it actually maps out the entire year for you so you can see January I need to be here February March April May so
that way you can always see where you need to be at based off of the time of the year it also factors in your pendings as well so you can see I've got five pendings here I've got a 135 pending in GCI buyers I've got 13 pending and that also should attract my buyer reps taken as well all of my fuel what do I have in my pipeline my pre-signed my active my active buyers my pending am i close for the year my total income my cost of sales expenses gross profit your net profit average
sale price and average commission on list by side and then something that's very crucial is your cash flow so you are able to see 15 30 60 90 days out of cash flow inside of your business and then there's some more detailed numbers down here breaks out all of your conversion rates quarterly what did you do weekly what have we done and then also gives you an income chart and then detailed breakdown of every category inside of your business that's the CEO summary you've also got the score board which is by far my favorite report
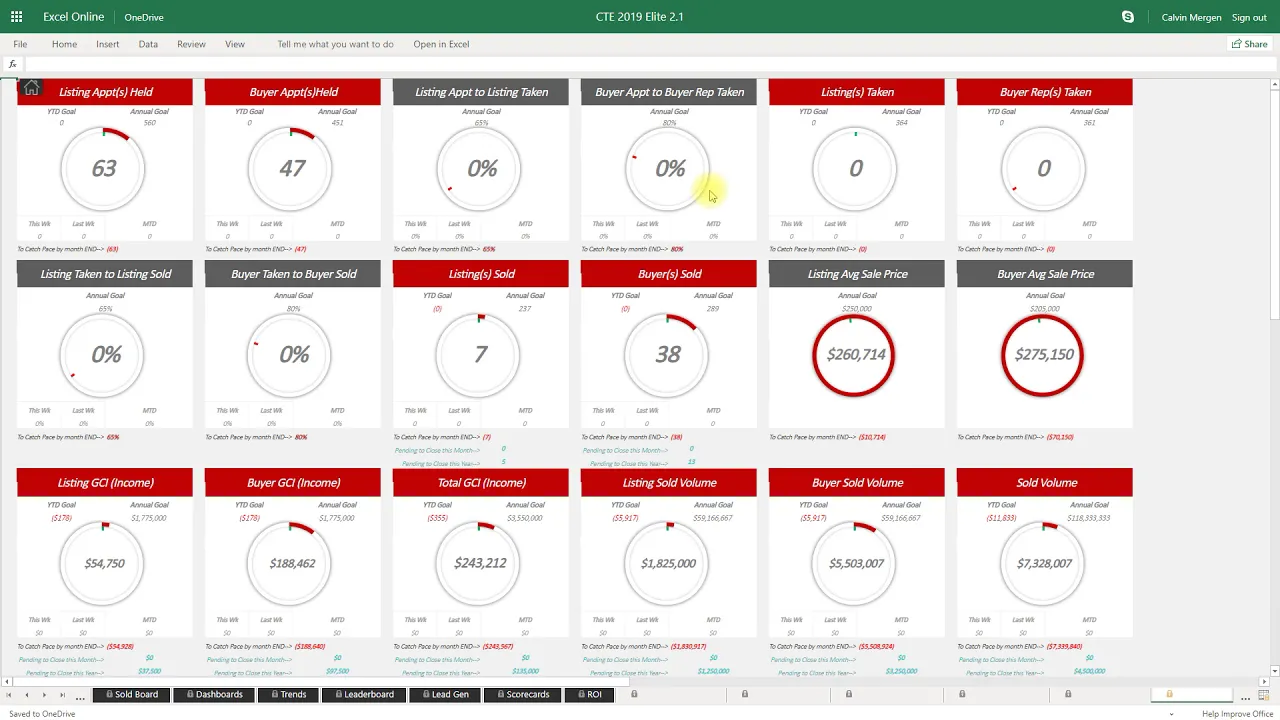
in here it just tells the facts where are we where should we be at and obviously in this scenario we haven't started 2019 yet so my goals are at zero but as soon as we start it's gonna start ticking and it'll always tell me where I need to be at based off of the current month we're in so in January starts it will go in there grab where I need to be at by the end of January and then I can see where I'm at and then all areas of my business I can quickly see
where am I year to date and where should I be at you if it's green perfect Green is good red is bad rabbit mean you're behind pace and then it gives you a summary of what your goals are this month to make sure that you stay on pace or catch up to pace it will always adjust your goals if you ever fall behind pace in a particular month your next month it will tack that on to make sure that you catch up and get your goals hit for the year you've also got your sold home
board which is going to show you all of your sales for the year and also shows your pendings engrave so you can see all of your future closings are on here buyers are blue listings are red so that's your sold home board you've got a financial statement that's going to automatically generate for you as well all of this stuff will feed right from my business when you enter in your contracts nothing you need to do it will go in there digest it and put it out into your financial statement and then you can also enter
in operating expenses on a monthly basis as well your dashboards these are awesome reports to put up on to TVs so again you guys can put these cassadee's up on TVs and they're fully customizable you can choose what you want to look at you can look at a time frame as well I can look at your to date I can look at this month it doesn't matter what I want to look at I can pull it up and it's gonna pull in that data so for the first quarter of the year what did we do
so my main categories and then I can customize these minimal categories down here as well so I can see exactly what's going on and then there's also an additional dashboard down at the bottom that you can customize as well so you can choose exactly what you want to display up on your TV monitors to make sure that you have that data right in front of you in all areas of your business you've got customizable leaderboards here as well so you guys can have that in front of your agents the fitbit is in here as well
just gives you a complete tracking of your annual goals so obviously the more full it gets the closer you are to hitting those goals you've also got a weekly meeting which shows you exactly what you need to do this month what have you done in all areas all main areas of your business and then it breaks it down this week what did you do from today all the way six days ago and then last week two weeks ago all the way six weeks back and that each agent has their own scorecard on here as well
so a perfect report for your weekly meetings and then a snapshot just a nice clean snapshot you can look at all right what's going this month what's going on today what have we done have we held any with 70 listing appointments just like a nice clean easy report and you can toggle any timeframe you want on that the lead gen summary is gonna be a summary of your lead gen so time frame this month we're looking at who is doing what in all areas of the weekend I can quickly identify that and see who's doing
the work who's not doing the work horse race this gives you the capability to add in competitions and you guys can customize this choose any category that you want from the drop-down set any timeframe and then set the goal and you guys can then enter in your horses into the race so once you enter them in and choose the time frame it will go in there grab that data and move the horse along so a great little competition report lead source and ROI extremely powerful where is your business coming from past clients are my number
one so I only have two right now in this example but shows new my units my closed I ROI how many pending units do I have how much pending ROI do I have at that lead source because that's very crucial to know if I have zero with a lead source and we know that that lead source is not generating anything right now but if I have something I can that I know right at my fingertips that we are generating business off of that lead source it'll also show me my average commission by average sale price
and month by month how much money I made off of those lead sources as well and you can customize your lead sources as well your four conversations are built in here and you guys can customize it you can use basic you're listening buyer reps listings taken I'm listening and by our appointments listings taken in by our reps your closings in your GCI all of that will be in here you can toggle and look at last month if you want to you can go to an advanced report which is gonna be a little bit more detailed
but it'll show you this week you can toggle that to last week if you want to look at but shows this week this month this year in all areas of the for conversations leader board as well so it breaks out your entire team who has what for active business who has what pending and who's closed what this year on your leader board team member scorecards extremely extremely powerful you can pull up any team member and it'll pull up all of their data we can see their fuel what do they have going on what have they
done in the last 30 days all of their income is right up on top there for conversations we've got month by month all of their numbers from lead-gen down to contracts down to closings down to future income as well and again I can't stress enough being able to see future income because now we can have real conversations if I look and I see 30 day cash flow for Johnny because I want to have a real conversation with him about his business I can see what does he have coming up for cash flow I can also
see future months as well so it shows his pending young income and also his pending units it also gives a whiteboard for all of Johnny when you choose him you can see can see all of his current listings all of his upcoming closings he has when are they closing and all of his recent closings are built in there as well goals versus actual is gonna be a very detailed report of all of your goals so month by month for the team what did we do what did we say we would do did we hit it
or did we not and in black every month it's gonna go in there and reanalyze your business and say okay either you did hit your goal now we're just gonna stick to the original goal if you didn't hear a goal in a previous month it's going to increase your goal for the month it is gonna make you get your goals for the for the year so that is an extremely powerful thing that CTE does trends report I again I said favorite report the score report but this is ultimately a very powerful report it shows the
entire team what have we done on an lead gen basis down to closings down to some sabermetrics and really really detailed numbers about your business but everything is in there it's not an efficient flashy gauged report but it is the heart and soul of your business their cash flow allows you to see all of your future months of cash flow so if you want to look at okay what does February look like I can pull it up it'll show me my actual clothes my pending my total my costs of sales and what's my best-case profit
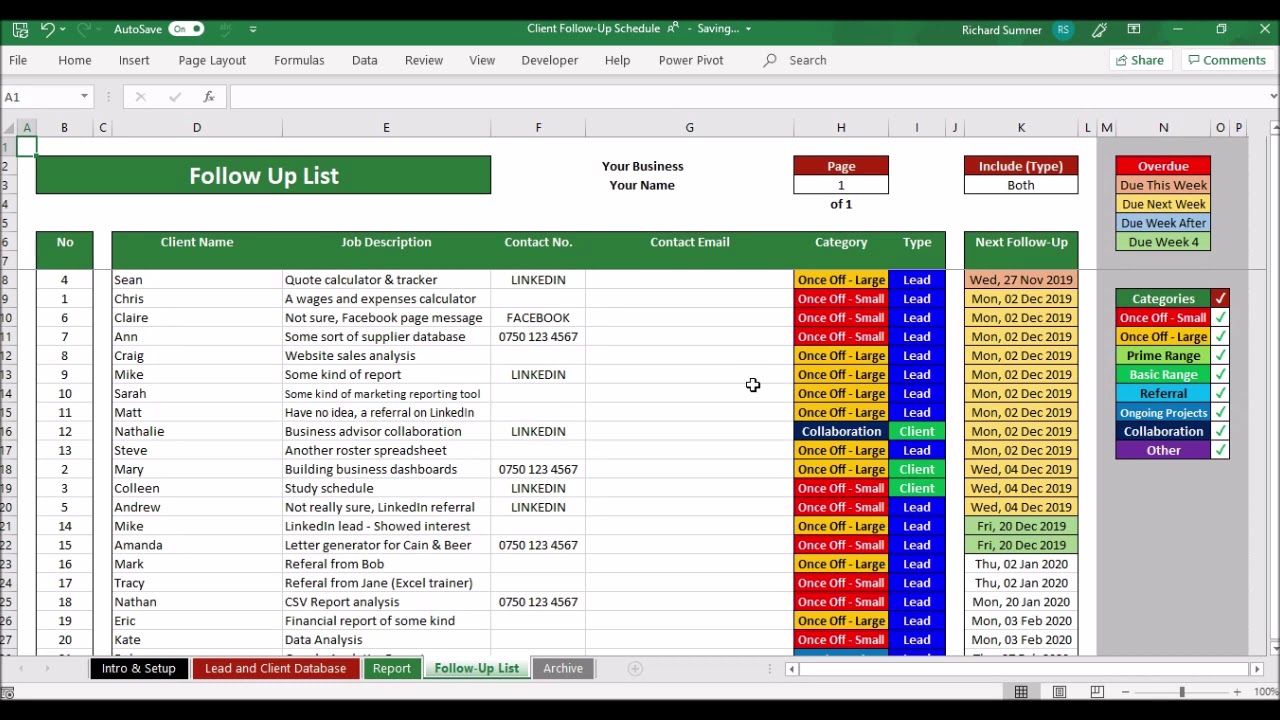
and what is my follow-up profit and then we've got a leads pipeline which you guys can track leads in here if you want to it's a very simple sheet here just to put leads in here and manage them that is nothing more than just a place to how was your leads and once they become contracts they go into my business year-over-year reports are going to show you exactly what you've done this year what did you do last year if you view CT in the past you have the year-over-year numbers it gives you a 12-month running
total as well and then quarter by quarter breakdown so what did we do in the first quarter this year what did beat you last year in the first quarter are we up or down in all areas of my business there's also a 4-1 one built in here so it's just gonna give you the numbers on a yearly monthly and weekly basis shows me from listing appointments all the way down to the percentage of money that I keep so the appointments I go on my conversion rates to taking the listings in the buyer reps to getting
them sold one of those conversion rates all of that is in here and it compares it versus my year to date goal am i up or down and then here's my annual goal am i up or down of that as well so all of that's built in and then a little team summary report here at the end which gives you all of your team members in one spot all their clothes their pipeline their legion their conversion rates and then their income all on here as well so you can see exactly how much money came in
and January to the team and where did it go and how much did the team actually make so there's a quick summary of all of the reports that are in CTE if you have any questions click on CT support and we'll be able to help you out


![[FREE DOWNLOAD] Sample Lead Tracker Spreadsheet](https://img.youtube.com/vi/2gPu-fi9Qdw/maxresdefault.jpg)