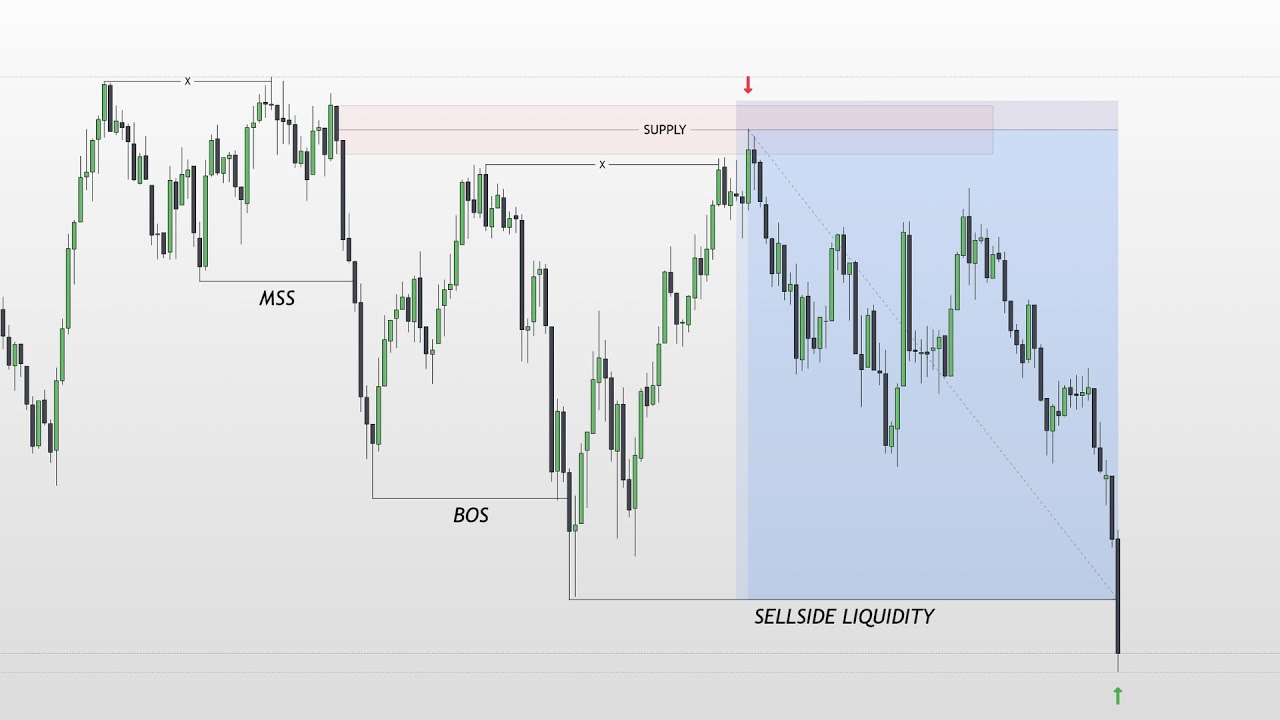
this is the only strategy I'm going to be using after 5 years of trading I have an 85% win rate using the simple entry model end strategy without having to have a really low R award as well and it happens at the same time every single day so it's really easy to know when to take a trade and this entry model only lasts for like 15 minutes per day so this strategy is all about candle Behavior but what is candle Behavior candle behavior is all about how a candle moves in relation to the previous candle
close so for an example if we have a bearish candle close here and we've been moving bearish what we would expect based off candle Behavior um with each candle open we expect it to First create a top Wick to then push bearish but why do we kind of expect it to pull back create a top Weck first then push bearish well this is simply because each higher time frame candle is actually just simplified lower time frame Market structure so what this would look like on Lower time frames is a lower high and lower low you
have these lower highs and you have these lower lows the whole point of counter behavior is that it makes it really easy to give timing to Market structure so when do we expect it to pull back when do we expect it to push this is all about understanding when you are in that new candle formation so if this is a hourly candle here a new hourly candle opens we expect to create a top Wick first for us to pull back in the first half of that candle in the first 30 minutes in the first 0
to 15 minutes of that candle to create that pullback and then we expect that candle to flip push bearish and for that one minute structure to continue moving bearish so counter Behavior makes it really easy to connect a lower time frame Market structure and higher time frame candles it tells you exactly when to expect certain moves on Lower time frame Market structure because the most important factor in trading is always going to be timing and this is also backed up by data I've taken thousands of Trades over my past 5 years and I've extracted all
that data put it into Excel and analyze that this is a heat map of that data broken down into 15minute intervals so this would be the first half of an hourly candle this is the second half of an hourly candle what this means based of my data is continuations have a high win rate a high return in the first half of the hour but in the second half it drops it's almost negative why is this it's because of candle behavior and candle timing you should always be looking for a continuation of a low time frame
middle time frame Trend or of the previous hourly candle in the first 0 to 15 minutes of that hour what this looks like as an example the blue is the first 30 minutes of an hourly candle and if we see here lower time frame middle time frame structure is clearly making higher highs and higher lows we're clearly moving bullish in that first 30 minutes we push bullish another example here we make we have a bit of a shift we push bullish before that new alley candle so this previous alley candle closed bullish in here first
30 minutes you push bullish again another example first 30 minutes you push bullish again another example first 30 minutes you push bullets again in the second 30 minutes you reverse and another example here overall structure is moving bullish it's pulling back first 30 minutes you push bullish second 30 minutes you pull back so understanding candle Behavior we'll tell you exactly when to expect a move in Market structure this is why it's really important and it completely changed the way I trade I'm going to show you a live trade example that includes my thought process that
was all called live so you know that it actually works I trade this every single day okay so quick breakdown obviously gold is looking should be high time frame bullish has been for the last month and a bit for quite a while actually but I'm just going to be looking for a 0 to 15 minute continuation at the second hour of Asia this happens quite often um looks like the hourly candle will close bullish um as well so and we kind of want to see a reaction dxy maybe break a low um but looking pretty
good I'm just going to be looking for a buy now opened it's now the second a of Asia um we do kind of have the previous High to to the right here um but yeah going to be waiting for a little bit of a pullback uh to take that by so if you see here on kind of like high time from candal I'm kind of just looking for uh these cands to create more of a bottom work maybe re to this previous sort of area um and then we can look for a buy continuation of
that so bit more of a bottom Wick wanting a bit more of a pullback as we are kind of overextended at the [Music] moment okay so it's a nice air of interest to buy uh we've kind of covered 50% of the previous move but now we're waiting for lower time frame reaction or to wait for the low time frame Market structure cuz we're kind of making lower highs and lower lows on trick chart waiting for this to Now flip bullish and align so you don't just want to buy randomly on a pullback you want to
wait for the reaction to this General sort of era that you're looking to buy from um and that will avoid a lot of your losses uh common losses it is a lot of bearish volume coming in and we have kind of been overextended so I might adapt um based on how we react but we are kind of testing these lows a little bit pretty decent reaction there high volume and okay I guess that's kind of the reaction you want to see so and take a buy off that nice nice little Scout $1,300 in a minute
this is why I love scarping and yeah Co this exactly what was looking for go looking extremely bullish we'll look for a continuation in the 0 to 15minute candles um of an hour it's not just about what type of trade you're looking for it's about when especially at the second hour of Asia you're going to look for a continuation in the first 15 minutes of that and then a reversal in the around that 30-minute candle um this is just based off that counter Behavior session characteristic so nice easy trade um posted that on the Discord
it always feels better when you're catching W's with other people um trading in the community I trade better when I'm like poting my analysis because I actually have to stick to my analysis you know I can't take trades against it so it's a lot easier to um have better discipline when you're accountable for your actions so I'm kind of grateful that uh I purch my trades um and my entries and stuff and it's it's really nice seeing other people win um so yeah today was a really easy day I'm really directional clear volume you just
want to adapt to conditions mostly most of the time I'm putting lots of value on how dxy is moving um but today because of how Gold's been moving recently it's just been so extremely high time frame bullish um even if dixi moves bullish gold just still continues moving bullish it doesn't really matter um so kind of just disregarding that um as much and just focusing on how Gold's moving you want to trade in a way that you can consistently get wins every single day how often do you see gold pushing 100 Pips in a couple
minutes in Ed session not that often so why would I trade in a way that won't happen common like I'm trading probabilities I'm not trying to have Perfection there if you trade in a way that's probabilistic with probabilities you're never going to get the the the whole move the perfect outcome it's about consistently good things and if you want to join the community and follow my trades see my entries my analysis every single day um just join the link in the description below I hope this helps with like my thought process on exactly the executing
pre- during and post trade so