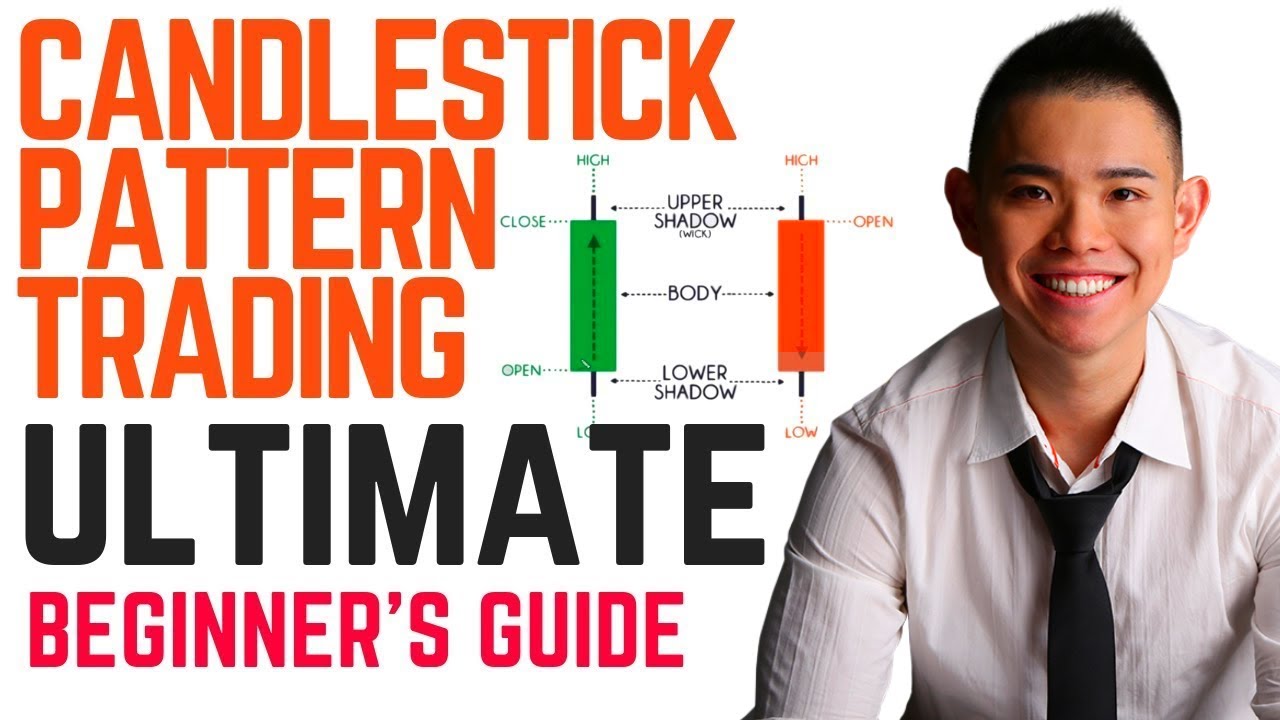
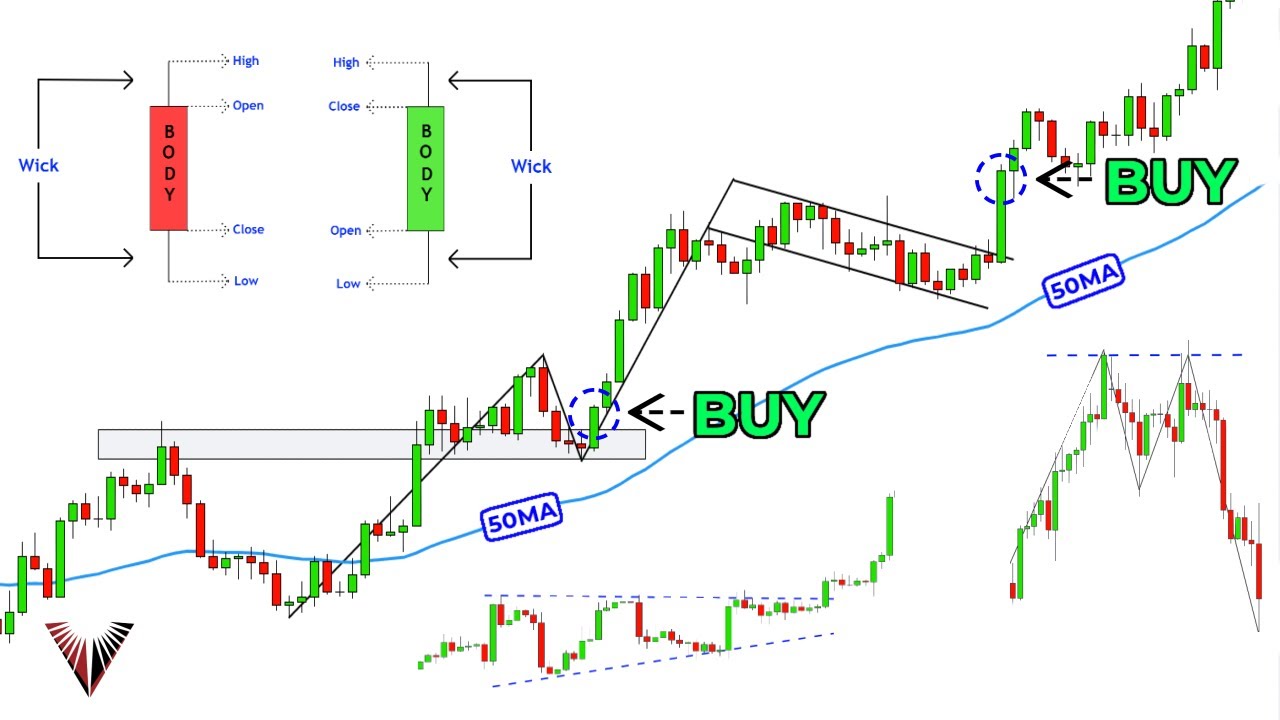
what's going on youtube craig here with the nevatrade and today i'm going to be exploring with you the world of day trading so even if you have no prior experience whatsoever i'm going to be discussing the most important day trading concepts so by the time you end this video and you get through the entire thing you're going to be able to know exactly what to do moving forward with your day trading career so grab a notebook get comfortable and let's get into the training okay so the first thing that i want to cover with you is what day trading actually is when you're buying and selling a stock you do so in order to turn a profit so there's investing which is long-term buying and selling and then there's day trading which is when you're doing that buying and selling within the same day period when you're day trading essentially you're buying a stock hoping that it appreciates and then selling it within the same day to turn a profit for that day okay so the objective of day trading is obviously to make money we know that but you're using a strategy in order to predict when and how these stocks are going to appreciate so that you can kind of quantify that into a system that's repeatable and manageable so you can turn a profit day after day okay so i'm going to kind of explain to you what individual stocks are and when you buy them and they appreciate how you make money okay so when you have a share of a company that means that the company is allowing individual people to basically buy a small portion of the investable part of the company so you can actually own small parts of the company right so if a company performs well those shares will increase in price so the amount you hold will increase in price and that will turn into your wealth as well so if we have one share of stock let's say that it costs ten dollars so now let's say you buy 100 shares of that stock right so now you have a thousand dollars worth of your money invested into that company so let's say that one share now appreciates and goes to 15 right so now you have per share 15 stock right so now that's 1500 worth of that stock so when you sell it back to the broker you basically are saying okay i bought this for a thousand dollars now it's worth fifteen hundred dollars so i'm going to give the shares back to you but i get to keep the profit that has been made on that trade because you've you've exposed yourself to the market into a certain amount of risk investing in that company when you buy a stock and it appreciates you make profit when you sell it same thing in the opposite direction right so now you're going to be losing 200 if the share price drops to 8. so appreciating each share appreciates you make money and then each share decreases in value you lose money okay so obviously the point of day trading is to figure out based on news and based on patterns if companies are going to appreciate or depreciate for that day so that you can usually place a larger position or a larger bet on that trade so that for that day you can turn a significant profit okay so that's the goal of day trading is to basically predict those appreciation and depreciations and put money behind it so that you can turn a profit for the day okay so now that we know what the objective is when we're day trading we need to go over how to read a stock chart okay and the first element of understanding that is going to be understanding what are called candlesticks okay so candlesticks are a visual representation of the open close and high and low of the stock movement for that set period of time so basically if you have a five minute st candle on a stock chart that's five minutes worth of up and down movement being quantified and represented in a candle that you can look at to identify that information okay so if we look right here here are two candles one is green and one is red green is signifying that over that period of time the price has made a positive gain or a gain and the red candles indicate that over that set period of time the price has gone down okay so if the candle is red that means that the price closed lower than what it opened at like we just said the wick what's called a wick right here is going to be the highest the price has gone for that set period of time okay this period right here is going to be where the price opened because since it's red this means that it must have opened here and closed here because it's a red candle okay so this bottom part right here is going to be the closing price that's signifying that basically the price has dropped over time in that set period of time like we stated and then the lowest price right here the the lowest point on this candle right here is showing us the lowest that the stock has gone for this duration of time okay so with the green candle same thing this top part is going to be the highest the stock has gone this is going to be the close price because it has made a gain over time because it's green this is going to be the closing price right here this is going to be where the price opened at and this is going to be the lowest point on the candlestick okay so now that we understand how to read candlesticks i'm going to show you candlesticks on an actual stock chart okay so if we look right here this is a visual representation of the price movement that sdgr has made okay so clearly this stock has gone up during the day in between these two gray columns right here is signifying a trading day right so it opens at 9 30 a. m and closes at 4 00 p.
m this is a five minute chart which is indicating that each candle right here is showing us five minutes worth of price data okay so we can look at each candle and know that that's what the stock has done for that five minute increment and when you start to see them pairing together you can start identifying trends and and you can look at how they move and use that as ways to project what the future movement is going to do so that you can try to make money on that all right so let's take a look at an example of a trade where i logged a stock or bought a stock and made a profit on this trade so i identified that this stock was moving up and i looked into my system and i figured out that this stock is going to turn around at this level in theory right so i bought 300 shares at 54. 65 right here so this candle i purchased 300 individual shares at a price of 54. 65 then i set what's called a stop loss this is going to prevent me from losing more money than i want to right so i put a stop loss right at 54 dollars per share so theoretically if this stock was to come down and push through this price and continue moving against the direction that i think the stock is going to go in my losses would be completely contained to a certain dollar amount which is 200 per trade for me so when taking this trade i accepted that i was going to risk 200 on this trade in turn for it to turn around and the probability to be in my favor so that i make more money than i'm risking on the trade okay so i bought 300 shares at 54.
65 and then actually the stock came down continued to push down and then turned up a little bit came up through here and then chugged up and i ended up getting out right before the market closed okay this was for a 417 dollar profit okay so i was risking 200 in this trade and i ended up making 417 dollars in the matter about five to six hours okay and that's the power of day trading basically if you can get good enough at this and you can figure out an exact system as to where to buy and sell stocks you can actually turn a pretty significant profit by understanding those concepts the next concept that i want to cover is a question that we get a lot and sometimes people have an issue understanding whether or not you can make money before you sell the stock and the answer is is that you're not actually making that money meaning that it's not locked into your account until you sell those shares okay so this floating profit which is profit that has been the stock is appreciated and the position is worth more than what you bought it for money is not in your account because you have not closed that position so if the stock moves down past where you bought it it will actually be negative value okay so if you're up in a trade and you're up let's say 300 on a trade but you're still in the trade nothing stopping that stock from coming down and basically making you lose money until you lock that in and sell the shares okay so in order to actually profit off of a stock you need to do both ends of the transaction you need to buy it and then you need to also sell it and as soon as you sell it those profits are going to be locked into your account okay so i know i talked about losing a stock trading position i kind of want to go into depth a little bit more regarding losing because it's very possible that you're going to lose a lot of your day trades a lot of people think that you need to be right all the time to make money and when you're wrong and you lose money that it's bad but actually you need to be able to retrain your brain and i talk about this a ton in my program but you need to be able to rewire your brain so that you can look at losses and understand that losses are a part of the game the only way you're going to be able to open yourself up for the opportunity to make money is to also open yourself up to do contained small losses okay so small contained losses that are a part of your trading plan are actually beneficial to your trades because it's allowing you more opportunity cost to basically be able to make profits on trades okay so let's say we'll take the same exact example right here where we bought the stock at 54. 65 and we put a stop loss at 54.
![How to Start Day Trading As A Beginner [2024 Full Guide]](https://img.youtube.com/vi/EYwLa1ZWD2o/maxresdefault.jpg)

![How I Make $1,000/Day with ONE Simple Strategy [100x Trading Tutorial]](https://img.youtube.com/vi/ACFa4m85D0I/maxresdefault.jpg)