Now before I move on uh toing this slide um I'd like to welcome you to the practical uh part of the course. This is all going to be based on uh the strategies over the next 10 units. Um so every single one of the next 10 units is going to follow um a very simple um uh process.
Each one of the strategy unit sessions will begin like this one began uh outlining a very key principle within the trading. Um, and ultimately we'll do that in a mentor type fashion. Um, once you've done that, a very very key relevant quote.
Um, you will see me uh utilize this quote uh throughout the unit and why it's so applicable and then we're going to move on to the real practical application. Uh, we'll really construct the trade strategy utilizing the blackboard. We'll break it down into the various uh variations you can expect to see uh the execution methodology um and a whole bunch of tips etc etc.
and obviously the live examples uh with a cross-pollination of not just the footprint but also the um the candlesticks as well as the price ladder. That is to ensure obviously a lot of the strategies you might already recognize. Um so just to ensure a real ease of overlap between the different tools.
Uh I have included all three tools in the same live examples. Each um unit session will then end with an additional reading. Um over the next 10 units I'm going to provide you with what I think are probably uh 10 of the most important trading books out there.
You will note that none of them are actually trading based. U most of them are psychology or thoughtprovoking based and then we'll finish off each one of the units uh with your drillbased session. Okay, so let's get into it now.
Um as you can see uh that this strategy we're going to focus on the absorption and auctioning uh first and foremost it is a momentum strategy. Okay, so I've broken up the two columns into momentum and countertrend. Obviously, some of you prefer momentum strategies, some of you prefer counter trend.
Now, what you are going to find is that some of the strategies might not suit your style, and that's fine. But, as you'll see as we go through every one of the strategies, you're going to recognize that knowing these strategies doesn't mean you necessarily have a strategy at hand, but it could assist you uh in many other ways, i. e.
targets, i. e. , you know, taking profits, uh i.
e. , you know where to place stops etc etc. So knowing these strategies, knowing these principles will aid you uh you know in making obviously uh trading decisions.
Now this is a momentum based strategy. It is standalone. Uh so you don't require any other trading tool to recognize uh this uh trade strategy and obviously in terms of execution it's a passive execution.
Uh you're going to wait for the market to come back and allow you a relatively straightforward entry point. All right let's now move on in the next couple of slides. We're obviously going to start off uh and we're going to focus on the principles underlying the strategy of absorption and auctioning.
Now, as we focused on in unit 3, we went through all the various principles um that you can expect to see in all the strategies. Now, on this slide, what you can see is two sections, part A and part B. And those effectively come from the unit three.
But what I've done is I've annotated stars next to the principles you're going to encounter in this strategy. So you're almost expected to understand these principles uh in order to effectively apply the strategy. Now not to worry because when we go onto the next slide uh I'm going to introduce you to the blackboard as well as the practical examples and you're then going to see me apply every one of these principles uh with an example.
So you'll see me illustrated, you'll see me utilize the the principles and hopefully you'll begin to understand what each one of these principles means and ultimately how it adds value to the trade strategy. Okay. Now before we move on to the next slide, uh do do bear in mind the next couple of slides.
I'm going to begin uh on the blackboard. I'm going to show you the strategy. I'm going to annotate it, show you the variations, um show you the principles that underline uh the strategy, and then I'm going to move on to practical examples with a static example of the footprint before then finishing with live practical examples of the footprint.
Now, do bear in mind um this will be an entire video session uh where I'm going to point it out for you. If however there was something you wanted to go back and view or you maybe wanted to watch the full length of the video um do note in the next couple of slides you will be able to view all of those charts uh at your uh at your own time as well as the full length video of the practical example. All right, let's get into it then.
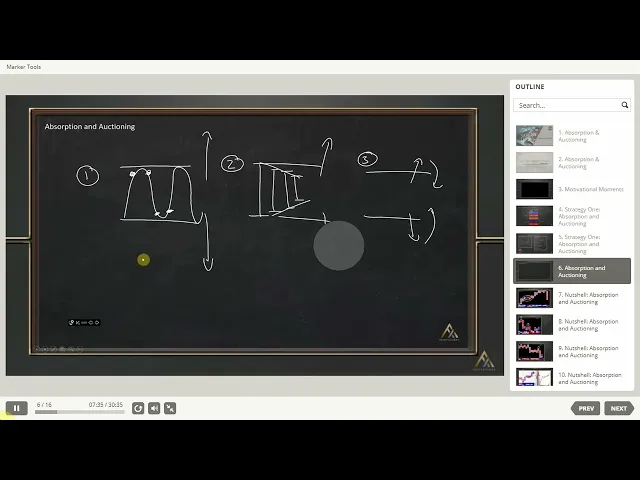
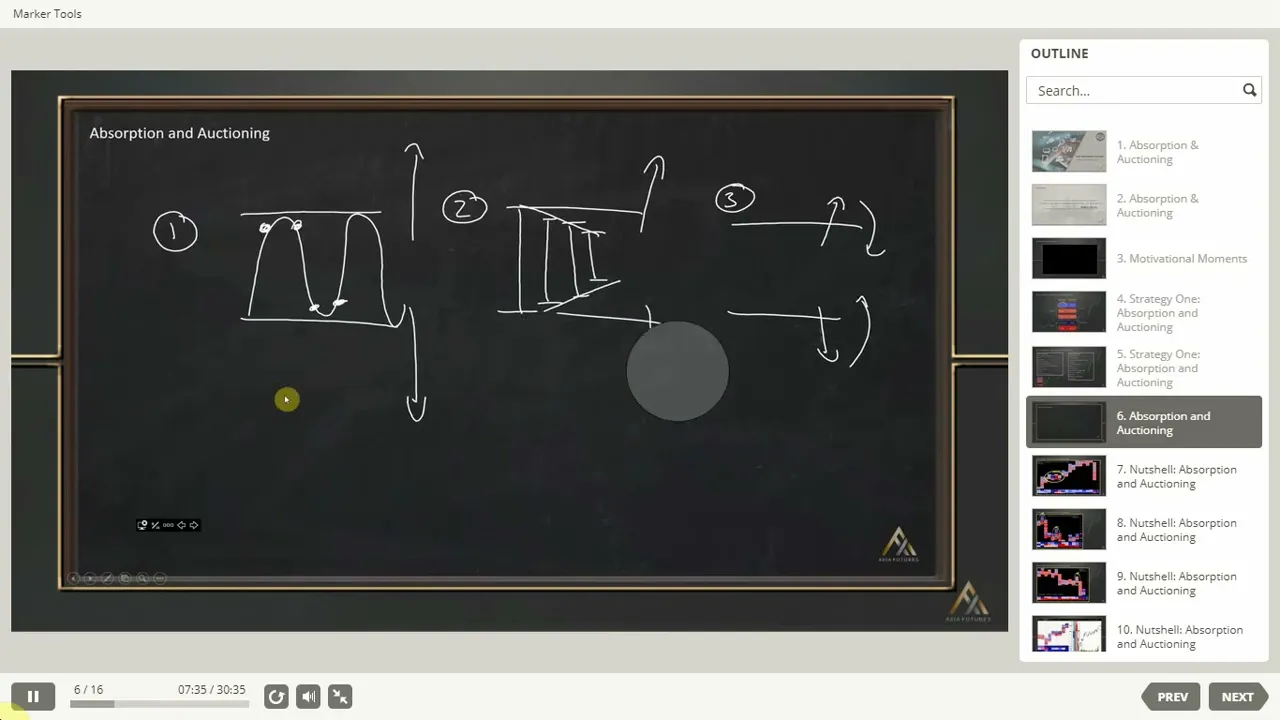
Okay. So, what we're going to do over the next couple of slides now uh is we're going to actually introduce the uh the trade strategy of uh absorption and auctioning. Um and uh we're going to take a look at uh you know real practical application of the strategy uh through means of firstly uh drawing the strategy uh and showing you where the various principles fit into the strategy um before then turning our attention to the practical examples uh which will include both static examples uh as well as live examples.
Now to illustrate this uh strategy, it's very simple. Um you know it's like we mentioned uh you know in in the principal section in effect what we're seeing is the process uh of accumulation and distribution within a confined number of prices. Okay.
So we can think of it and I don't want to I don't want to get stuck in the the principal idea of support and resistance. So I'm rather going to call this just a pivot and a pivot. Okay.
So in essence the market begins the process of trading between two pivots. Now one of the key principles we focused on uh was the principle of consolidation. Now most important uh note this is not consolidation.
Why? Because consolidation as we mentioned in the principal section tends to be relatively low volume. Okay.
So what we are actually going to be talking about is the process of accumulation uh and distribution. Okay. Now we noted the key difference between uh accumulation and distribution and consolidation was very simply uh the volume and the delta exchange.
In other words, in accumulation and distribution we do tend to see a much higher relative uh amount of volume being traded uh versus the consolidation. Now, the key identifier uh of this trade strategy uh comes at the extreme pivots. Okay?
And what you're going to tend to see is you're going to tend to see some real dark uh high volume areas, high volume areas uh and then effectively some real dark high volume areas and high volume areas. So, you're going to see this process of high volume areas uh at the extreme points uh of the pivot. Now note obviously in to terms of the auction process what we're seeing here is uh no real strength in the auction process rather just uh responsive uh price action at the high and then responsive uh price action at the low.
Okay. Once it finally breaks in either direction uh we then get the process of initiative. Now note obviously when we do get this initiative response uh and this stronger auctioning process uh it's usually going to be accompanied uh by some um some auction imbalances.
Okay. So very typically once the break comes uh obviously you're going to get these auction uh imbalances uh accompanying it and the reason being is very simple. If we look at uh what's effectively happened uh with the delta and the volume uh whilst we are sitting inside this uh accumulation and distribution zone in essence what we're doing is we're building up uh position uh within this tight range.
So within this range uh we're either going to have a positive or negative position. Now what I will say um I've never found there to be a good rule of thumb that if the delta is more negative or more positive uh that has a high probability uh you know sort of in terms of giving an indication as to which way we're going to break. Um but what I would say is that high volume and that high delta in essence implies that when we break there are positions caught on the other side.
So for example, if it breaks to the downside, obviously we do have some longs that are caught. Okay? So those longs need to pay down very quickly and it's that reason that we get the high volume, the high delta as well as the auction imbalances.
Now in terms of um in terms of the relative change uh obviously you will note a distinct difference between the volume, the delta and the cumulative delta in this zone relative to once it breaks. Okay, once it breaks uh you are going to see a real shift in the uh volume price uh and uh delta dynamics. Now note obviously um you will see uh much lower relative volume within the zone compared to the break and that's obviously uh simply because of the initiative being taken.
Um as well as obviously again I don't want to really use the word support and resistance. Uh but you can think of these pivots in terms of some form of a you know maybe the the lower pivot is some sort of a uh initial support whereas the higher pivot is some sort of initial uh resistance. Now do note obviously um one of the key uh things to consider as well is liquidity.
Uh whilst we are inside of this this uh range between the two pivots, there is actually quite a high amount of liquidity being provided. Why? Because we can see that there's some real uh aggressive uh you know accumulation taking place on both extremes.
Okay. So there is high liquidity which um sometimes means that the break uh isn't always as clean and directional as you want it to be. Why?
because if someone's providing liquidity over here, okay, they could be providing liquidity even higher up and that's why we sometimes uh actually do get failure of the absorption and auctioning strategy uh which I'll talk about uh in a minute. So that's the basic principles uh applied to the absorption and auctioning strategy. Now let's go and have a look at um some of the uh the practical examples uh that you can expect to see.
In fact, before we move on to the practical examples, uh let me just show you the three uh variations that you can expect to see uh within the uh the absorption and auctioning. Um now, the first is obviously as I showed you and I'm I'm going to draw these very briefly. So, do make a note in your uh in your notebook.
So, the first is obviously where we have uh a very clear pivots. Uh again, um you know, these lows are not going to be exact uh every time. that could extend by a tick uh or or not but in essence you want to see high volumes at the extremes.
Then the second type of variation uh which a lot more of you will be familiar with is more of a an inside candle approach where effect what happens is the market con it finds some sort of accumulation and distribution in a tighter and tighter range. Okay. So failing to take out either the previous high or the previous low as the next uh candlesticks come in.
Now note obviously you'll see this a lot easier on again on a timebased uh rotation but that's the second type of variation of absorption and auctioning. The third type is in essence uh where we've got a failed uh you know sort of break of the absorption and auctioning. So in essence what happens is the market breaks to the one way or to the other way and comes back in.
Okay. So in essence in these two examples we break and initiate in one direction. In the third example, we break, try to initiate in one direction and very swiftly reverse.
Okay, those are the three variations we're going to discuss uh as we go through the rest of this unit. Now, note where does this uh strategy best uh come into play. Now, this is important.
You know what we're going to talk about uh when we get to observing a strategy uh is that in essence uh you can see this in both balanced and imbalanced markets. But what I would say is this this concept or this trade strategy of absorption and auctioning is going to occur best uh in imbalanced conditions. And the reason is very simple.
Okay, like I said, remember what we're looking for is we're looking for initiative once we break out uh of the key pivot area. Now, if the market is in the imbalanced zone, okay, note that imbalance just simply means uh we're trading maybe quite close to the extreme of the previous day or even sometimes outside of the previous day's range. Okay, so if we're seeing the concept of absorption and auctioning uh occurring uh in an imbalanced um you know uh area of the market or market context, uh this means that this initiative has the potential to be far more aggressive.
Why? Because if we're trading quite close to a previous day's extreme, we know that the potential for a breakout is quite high. So we want to utilize this absorption and auctioning to play for the potential breakout of the previous days extreme.
Okay. Um so that's uh obviously in terms of uh market context. Do note however you can see this in balance conditions as well.
Uh it's not to say it doesn't work equally well. uh but for me I've noticed that in imbalance conditions the absorption and auctioning uh trade strategy works far more effectively. Okay, let's have a look at some examples now.
Um so obviously this is taken from uh the 16th of December. It's the Euro dollar. Uh do note this is a rotational um based uh you know candle uh uh or footprint chart.
Now as we go through every example I'm going to show you uh you know both time based and rotational based so that you get used to you know seeing them with different views. Now obviously what we can see uh is the absorption auctioning it can work particularly well on a rotation assuming that your rotations are set to the right rotation. Okay.
Um so what we can see is that the market entered in from sort of 6:05 a. m. in the morning uh to oh not 6:05 sorry uh that'll be in the evening.
Um in fact I don't even know what these times mean but this is definitely not the morning session. Okay obviously as we go through these strategies guys none of these will be taken outside of cash hours uh for good reason. Like I mentioned most of the strategies are applicable uh when there is interaction between buyers and sellers.
We noted that that interaction is best seen when the cash market is in. Okay, so these time formats won't be quite correct. Um, but in essence, what we've seen is the market has gone into a sideways holding.
Uh, we can obviously see nice pivot on the downside and a nice pivot to the upside. Now note, we can see some real extreme absorption at the high uh and then again equally some absorption at the low, some absorption uh at the low. Once that resolves itself again note as well whilst we're in this uh zone of accumulation and distribution um note the high volume okay relatively high compared to what we've seen um also note the uh delta.
So note how the delta goes positive on the upward rotation and then high volume and the delta goes negative on the downward rotation. Okay and this is this is a function of absorption and auctioning. You are going to see this within these rotations.
But the important thing to note is once we break, we want to see initiative. Now note initiative in terms of the delta and the colors you can expect to see is that you're going to get the initiative. The initial part will be light colors.
Okay. So, as you can see here, we can see relatively lighter colors here and relatively light colors before then running into darker colors once we start to see liquidity being found. Okay, just that's what you can think of the darker colors as.
Uh, it's simply just liquidity being provided. So, once we get the initiative, it will look like a lighter color until it runs into some responsive sellers in this example, which will start to make the delta colors a little bit darker. Okay.
Do note obviously well like we said we want to also see uh with any kind of initiative we always want to see the volume pick up but we also want to see the delta go in the direction that's so crucial with initiative price action uh you always want to see both the volume and the delta go in the direction of the initiative. Now note in terms of color lines like we always say once we get that initiative being taken we will obviously post a nice turquoise color. Okay.
So in terms of entry point now what I am going to say is do note um you know I think one of the mistakes uh that uh that a lot of traders will make with any strategy is they want an exact execution. They want an exact entry an exact exit. Okay?
It doesn't work like that. All right. The important thing to understand is that every one of these uh is a strategy.
But in essence, what we're looking for is we're looking to be long once the market uh you know retests uh or shows us some form uh of absorption. Now um if I can remove this here, you'll see quite a lot of absorption taking place in this zone around these 75 to 77 area. Um some real good absorption.
Uh that's your entry point on the break. Uh why? Because what happens is we initially see some responsive buying here and responsive selling.
And what happens is that responsive selling or that pivot resistance then becomes pivot support. Okay. Now note the two variations with regards to the break up or down.
Like I said, you can see some very aggressive initiative where we do tend to have imbalances or as in this example, you can see that we have a relatively slow uh gradual move to the upside. Okay, now that's important to know because you know it's not always going to be as straightforward and clean uh as uh you know some of the examples you might see in some of the later slides. Now the next example uh again uh is one of the failed reversals.
Now um and I'm going to show you this this failed reversal and show you what it looks like. So again this is taken um from the the E- Mini S&P 500 uh quite recent as well. Um again what I want to show you is this market enters uh a phase of consolidation.
Uh we can see real sort of extreme kind of volume negative delta taking place. We then see a flip of that. The market then absorbs on the higher up prices and then it initiates and this is quite interesting because we then get the initiative taken to the upside and we notice that because of the volume as well.
So the market initiates to the upside. We see obviously before that we did see quite an aggressive amount of responsive selling in the market. It got overwhelmed.
The market extends to the upside but very quickly reverses and finds itself back inside the initial range. What then occurs? The market retests.
Note, and this is the key to the reversal strategy. The market then retests that original absorption area before we broke. Okay?
So that's what we call a high pocket volume or a a high volume area. Uh that was where the passive selling was occurring. So the market re-enters that zone.
It retests and again absorbs another 1,600 contracts before then beginning the aggressive reversal. Okay. So like I said the uh the reversal trade strategy uh what tends to occur is once we fail to break we then re-enter range but we very quickly very quickly move from one side of the range to the other side of the range and what you can see is that market within the same rotation uh takes you know almost within a couple of minutes uh reverses straight to the other side.
So that's a key factor of uh the reversal strategy. So again, if you're going to learn the strategy, remember first and foremost, uh we're looking for the break. Um obviously you need to manage your stop quite effectively.
Uh as I said in the previous example, um you know, if we go back to that quickly, very simply, you know, we um ideally uh we don't really want to see I mean, we can see how the market gave us a nice imbalance uh but ideally we don't want to see the market re-enter uh this range. So again, in terms of a stop, uh if you're someone that keeps it very very tight, you might have had uh only a couple of tick stop, uh for me, I didn't want to see this imbalance be taken out. Why?
Because the imbalance uh shows the the start of of initiative. Um so for me, a stop would have gone right over there. Um notice it did come and try and test it before then reversing in the other direction.
Okay. In terms of target, uh this is always a tricky one for the strategy. What I always say is you get out when the market tells you to get out in the strategy.
Um so simply put uh we can see obviously the market uh began a process of absorption here in a little inside candle uh and then extended again. Um so again the market didn't really give us any reason to get out. Why?
Cuz it didn't really take out any previous swing lows uh I would have said once we saw this double bottom I would have become far more cautious. Okay. In terms of obviously the uh rejection strategy, uh well again, you know, target is a little bit of a of a nuance fine art.
Uh but again, what we're looking for is a flush in the opposite direction. Um and let the market tell us when it's time to get out. Okay, our last example.
Um again, another one of the rejection ones. Um and again, I wanted to illustrate this twice just to show you how common they are. Um so obviously as we can see uh the market again settled into to a a sideways range.
But one thing you should note here and this is where I caution you on the strategy. Remember what we said the difference between consolidation and accumulation and distribution is the volume being traded. Okay.
Now note the volume being traded here. Do we have extreme uh delta on on the extremes? Okay.
And the simple answer is no. Okay. This happens to be the um the Euro dollar again, but no real extreme.
A little bit of extreme uh printing coming in there and there. Uh but not the best example. I wouldn't be looking at this going, okay, this is a potential opportunity.
Uh and we can see that also simply by the delta. Okay, this is always the dead giveaway clue. There's no shift in that delta on either side.
And that tells me this isn't a process of accumulation distribution, but rather a process of consolidation. Now the reason I wanted to include this was very simple. Okay, a lot of you will look at that and say well it's a perfect example.
Uh it broke extended left all sorts of imbalances um had a high volume and a shift in the delta. So in essence it still did the same thing. However remember this job's about reducing uh you know the or or increasing the probability of success and that's why the conditioning is crucial.
Okay. So note it's only absorption and auctioning if we have got high deltas at the extremes which we can see with the delta um in the example provided. Okay.
So that's our three examples. Let's now have a look at one of the trade strategies. And uh what you'll note obviously is that um with regards to the uh trade strategies uh I'm going to play you through it and I'm going to identify a few things for you.
Don't worry if I rush through this guys. Uh you will get plenty of opportunity uh you know to go and run this on your own uh and uh watch it back in your own time. Okay.
All right. Let's just give me one moment. Just try to get this playing.
[Music] Okay, apologies for that. Um, now the first thing uh before we actually move into the example uh that you can see in front of you is just a little tip with regards to the the trade strategy. Now I'm going to give you these tips um alongside all the rules of thumb, but the tip for this trade strategy is there always tends to be uh calm uh before the storm.
Okay. So, you tend to see this this real just slowm moving market almost like a breath uh something triggers maybe it's absorption on the one extreme but there's always this little bit of relative calm and then suddenly uh the initiative is taken. So that's what you're looking for in this trade strategy.
You're looking for anything that hints at the potential for initiative to be taken. Now the example in front of you is uh the Euro dollar from the 18th and um I'm just going to run this through. Obviously bear in mind um these uh these examples uh the full example will be there for you to watch the entire video.
Uh obviously uh I'm going to be running through it relatively quickly showing you the key points uh showing you the tips uh and hopefully you get an idea. So I'm just going to fast forward this fractionally uh show you when we get to that um that phase of um sideways. Now to bring things into context uh and this is why we have the candlestick on the right.
Uh note we are in a little bit of a of a drive up this morning. Uh we are imbalanced at the moment. So this is what I said.
This is ideally where the trade strategy works very well is when we get this accumulation distribution uh at an extreme point. Now the first thing to note obviously uh note the delta uh at the low. Uh then equally uh note the delta at the high.
So we're seeing both absorption at the low as well as absorption response uh at the high. And this process continues to occur for some time now. I'm going to show it to you.
I'm going to keep fast forwarding it. Uh and then I'm going to show you a little bit of a tip. So again, notice again uh the response of buying coming in.
Uh notice the delta. This is what I said. You're always going to get positive delta, positive delta, negative delta.
So wherever that response comes in at whichever extreme, you're going to see it in the delta. Now note obviously we're looking for any signal uh of the potential for some form uh of initiative to be taken. So again note what we see at the high okay some real positive uh you know buying and intent but someone is still happy to take that liquidity.
Okay. And this process goes on uh for some time. Now note what we suddenly see if you were to compare uh every one of these last auctions.
Notice what we've just seen uh in this latest auction. You know, if you were to just visually eyeball this, something looks uniquely different about this auction. Okay.
One, uh, notice obviously where that last 173 lot got reloaded. Notice how we only traded 13 lots before we sold off. And look at the volume traded in this rotation compared to all five of the previous rotations.
Okay, you'll very distinctly see nothing really got traded here. And that was the clue. That was the calm before the storm.
Now, let's see what this storm looks like. I'm just going to get to the point of it so I can show it to you um again. Okay, what we can see a little bit of buying coming in and uh now let's see what this uh this initiative looks like.
So, note here 39 contracts traded where we last absorbed 21 contracts traded. So you can see there's really nothing going on you know from going uh you know from a point where every time in extreme there was great deal of absorption to suddenly very very calm sitting on the highest price of the day. That's the calm I'm talking about.
Okay? And that's the calm that you ultimately uh want to take advantage of. Now there's one more little clue uh that did come in here.
Uh ultimately I'm going to just illustrate this if I go a little bit further forward. Um so again we can see obviously the market did back off there. Okay.
Uh we came all the way back again responsive price action at the low and let's see again we're going to get another little clue again. Notice the responsive at the low delta negative delta negative. Okay.
And let's see what happens. So again similarly to what we saw when I pointed out this very very interesting rotation. Notice what we saw here again.
So the market came down. We traded 400 contracts in total. some real responsive uh buyers sitting there and then the market left a really really low volume area.
Okay. And this is often what happens just before we get a breakout uh of this accumulation distribution. We either get uh what we call an auction imbalance which you know about or we get this low volume area and straight away note the zeros.
That's obviously the beginning process of the initiative taken. Okay. Okay.
So in terms of execution um you know if I just go back uh fractionally once we saw that little bit of um you know we saw obviously the little bit of uh imbalance taking place you'll notice that 115 contracts got traded. Let's see what that looks like cuz that was ultimately our opportunity uh for some aggressive execution. Okay.
Obviously what I would say when we go through the slides we talk about the uh the execution side. Um you don't have to preempt uh any of these trade strategies. Okay.
as you get better at them, you'll learn to preempt them because you'll learn the nuances of it. But what you can see is you could have actually preempted this just simply because of the reloading taking at the high. Now notice every time that we've um ultimately been at the extreme, we've had sellers or we've had a buyer buying into some really aggressive sellside response.
This time, however, we have a seller selling into a really aggressive buyer. In other words, we've got a really aggressive buyer reloading at very extreme prices. And that was our clue.
That was our subtle clue. Uh a lot like the clue we saw in the previous rotation. Okay.
As a result, once the sellers recognize that buyer, we begin the process of auctioning aggressively higher. Okay. And this process continues.
You can see obviously we make an extended high. A little bit of imbalance as we mentioned. Market finds a little bit of sellside, comes back.
Notice what it retests. Okay. Okay, it retests that break point before then extending on higher.
And I'm just going to fast forward this uh so we can see uh the process of one time framing. So note obviously we got the break. Note the market did come back a second time, give you an entry point before then continuing higher.
Okay. Uh obviously you've got this video to go over yourself in your own time. Um but I just wanted to highlight that really key, you know, nuance shift in the price action.
uh that's what you're after. If you want to get good at the strategy, you're going to need to learn to identify that little nuance because that's going to give you the perfect timing on the trade strategy. Okay, now let's look at another example.
Uh this time in the gold market and uh this time uh we're going to have a look at what an aggressive reversal looks like. So this was taken from the 6th of December. Uh it is the gold market and uh again I just want to move this a little bit forward.
Let's get to uh some of the key areas now. Obviously, what you're going to see here is a process of accumulation and distribution. How do we know?
Well, look at the extremes. We have a high delta. Look at extremes.
We have a negative delta. Okay, we have some really dark colors at the extreme sides of both pivots. Now, what I want to point out is once this market uh you know retraces back in to the distribution zone, what then uh finally occurs?
Now, again, you can see we've come down. Now the market's beginning the process of uh accumulation and distribution. So we can see accumulation at the low and then we distribute at the high and then accumulation from the sellers and then we distribute lower and this process continues uh for uh some time.
Now what you'll recognize is that obviously we can see quite a negative cumulative delta on the day. Um but we can see again every time the price has come down we see the delta uh becoming more negative as the response of uh buyers are happy to be filled there and provide liquidity. Equally once we go bid we can see obviously the response of sellers happy to provide liquidity and get filled.
Now let's move on to the break point because remember as I said in terms of variations you always assume that the break will continue with initiative. Okay? You never assume it will reverse.
Uh so I'm going to show you exactly how you execute the reversal now. Okay. So we can see again more negative uh delta and uh let's see if we can find that little bit of a um a telltale sign as I said the calm before the storm.
Now note okay we can see obviously the market thinning out a little bit. Notice now in terms of look at the accumulation that we were receiving uh at this price 66. 1.
So we're receiving dark colors here once and twice and all of a sudden the market's beginning to happily facilitate trade uh again in this area. Okay. So what we can see again and this is such a telltale sign.
Notice how previously we would see buyers absorbing the market and buyers reloading and providing liquidity. Now however look what the sellers are doing. Okay?
Look where the sellers are providing liquidity and where they're absorbing. So this was very very similar to the previous example. You tend to get this just before the breakout.
And there's your clue. There's your tip. When you get the absorption coming in from the sellers at lower down prices, that's your clue we're about to break.
Now, let's see what this break looks like and let's follow it on the reversal. Now, remember what I said in terms of breakout. Uh we obviously um you know, we want to see some initiative and we want to see some uh some imbalances.
So, what we can see here is we broke below. Okay, we've seen the sellers position for the break. We've broken below and what have we seen straight below that?
Okay, some really really aggressive buying. Okay, that was effectively our real big clue uh of the reversal obviously. Okay, we won't this is a little bit more of a tricky example because it didn't quite uh extend as we can see on the candlestick.
It didn't quite extend by that far, but we can see once obviously it did go bid and that initiative came in. Notice the imbalances, notice the zeros, more imbalances. um runs into a bit of liquidity and what we're looking for now if we're not already long uh we're looking for potentially a long just in front of that imbalance.
Okay. And you'll see obviously market does post a nice little uh engulfing candle and ultimately comes back. Notice the fill there if we just show it to you in terms of the strategy execution.
Comes back all the way down to that previous high pivot as we mentioned. gives us the opportunity to enter on a reload before ultimately continuing higher. Okay, so those are two strategies guys.
The one obviously initiates and continues. The other is failure, reverses very aggressively and initiates in the opposite direction. Okay, let's go back to the slides now and together we're going to complete the template.