This is a very large options expiration right now it's the second largest expiration ever but there's a ton of positions then every tweet he has has a higher amount of volatility because of these giant positions we think about this move a 8 to 10% draw down in the S&P 500 for example and Vick spiking up to 30 to me that's a big function of the fact that nobody was positioned for Downside right and then there's this giant negative strike there is a dealer or dealers that are short that strike it's 405 000 puts and that
generates a massive amount of hedging flow when you have this extreme of a of a sentiment in terms of humongous puts expiring that often times can be a local or shortterm short-term bottom in the market vix at 20 to 25 with this unknown situation of the tariffs it's not a home run to shortfall right now but when vix goes to 30 then you suddenly were able to bring some people out saying okay this is getting like a little bit crazy the market makers are chasing to the upside and they're chasing back to the downside and
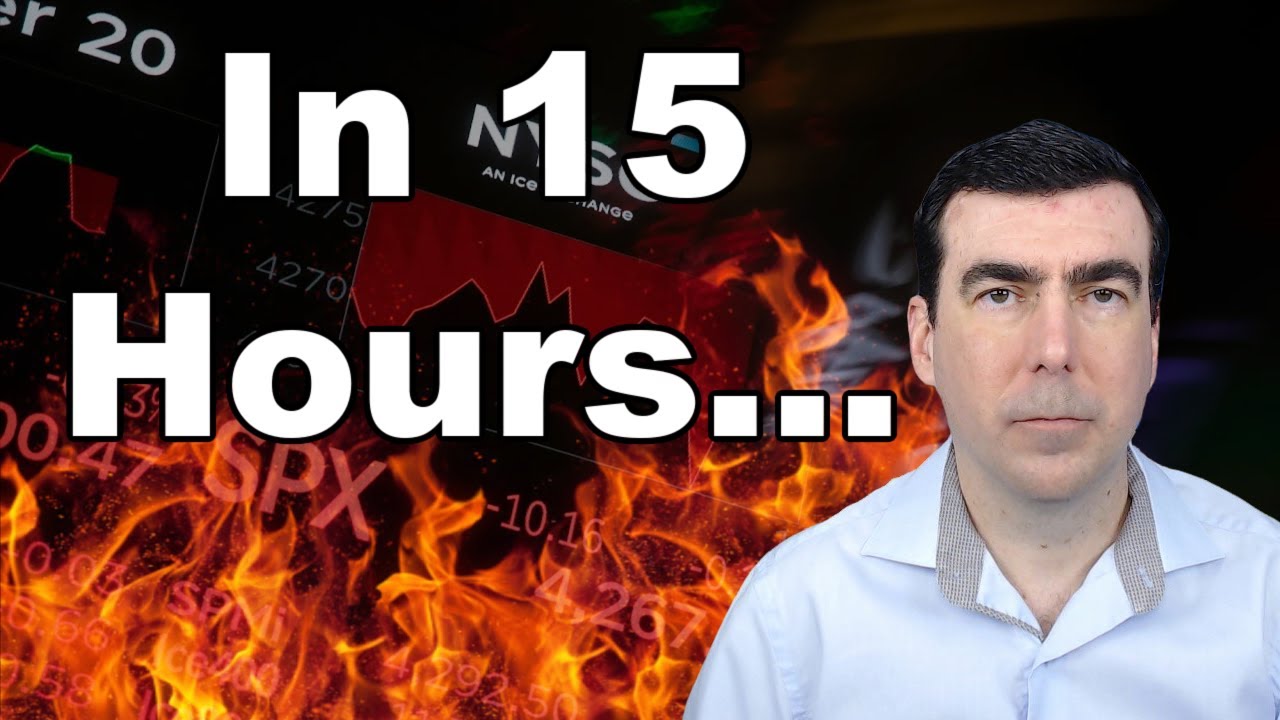
so you know you get these overshoot rallies that just crash rate bound the next day so Bren I don't know if we can call this our first maybe it's our first markets in torm roll episode of the Opex effect I think it warrant Flames that's For sure uh I'm gon I'm gonna throw it in there because uh as you you probably know this the CNBC market and turmoil thing is like the greatest cont contrarian indicator of all time yeah like so I'm going to go ahead just to give my value stock some hope here I'm
going to go ahead and throw the slide in here the uh the markets in turmoil just to see if it helps us yeah and I think you need a something from me with flames there you go so you got I think you did One for for your channel right where you did that one time I think I saw it I might have probably probably trying to make fun of somebody in that back fat on me but any here we are so but anyway get into the content we're we're doing this early this time because there's
so much going on obviously we we've talked about the lack of volatility for a long time that that certainly changed we got a lot of events coming up this week so we're actually putting this out on Saturday to Get ahead of all of it um plus it prevents whatever changes in the market from changing while we're trying to get this thing out so uh yeah there's a lot to talk about this week there is yeah and part of the reason Reon that I uh requested that we bump this up too is the vix expirations on
Tuesday uh which is a little unusual usually it's on Wednesday and that's because there's Good Friday in April so we need 30 days between vix expiration and the next uh The following month's SPX uh expiration so so there's a there's a change in our in the expiration schedule so we got to deliver this a little early yeah so before we uh get into it because there's so much going on and obviously I've been really interested like watching these moves from the outside and seeing what's happening I've been really interested to see what you're seeing behind
the scenes in terms of what's going on so we're going to get into all of that but first We just like to talk about and we'll abbreviate it this time because we've got a lot to cover but we like to talk about why this is important why options flows are so important in the market yeah and and we've done a couple of deep Dives in recent uh well not all that recent now we've been doing this for a while so it's probably about six or eight months old now we cover why this options flows and
uh kind of have an impact on the underlying market and and I'm going to go through this quickly again if you're interested in the mechanics of this please check out some of our uh previous episodes but essentially the deal here is options volumes continue to expand in fact in January uh or February of this year we had the record uh single day S&P options volume and so those volumes keep growing up uh going up uh if you have any doubt about the veracity or truth in the options Market just check out sibo stock Which uh
it seems unaffected by uh Market weakness uh and the way that this essentially works is we have all of these individual Traders uh they're buying in this case AMC or GameStop or S&P Zer DT options or whatever it may be um and those orders all go to one of 17 or 18 different us options exchanges and 90% of the transactions that uni trade in term in the option space those are facilitated or traded against a market maker you've heard the names Citadel Wolverine Susana Etc uh and so they're required uh in order to be a
market maker they have a deal at the exchanges they have to constantly provide bids and offers and all these options so when we go trade we're trading against them now they can't say hey Jack you're not allowed to buy AMC calls from me they have to make a price they don't have to make a good price but they have to make a price and so basically what happens is when we all decide to start buying and Selling options they acrew this exposure so in this example A bunch of us got together and we bought small
lots of AMC calls and you can see that added up to be 100,000 AMC calls and just to give you an idea of the potential uh amount of shares that you have to buy in this situation 100,000 calls at 50 Delta so 50 Delta is kind of an at the money option uh that equates to about 5 million shares of stock for the dealer or Market Maker to potentially have to buy and they really don't know that exposure is coming until it hit their books right it's not like someone called them on the phone and
said hey you know want to buy these calls what do you think and they have a chance to get in front of that from a hedging perspective in this case the market makers have to sort of react and that is a transmission mechanis mechanism right it's this hedging flow uh the shares that are being bought and Sold that we believe transmits options trades to movement in the underlying price and we really see that during times like this right when we're seeing significant volatility that's where we're really seeing these flows have their impact that's right and
and we try to pres present or I should say I try to present uh the evidence for that on a on a monthly basis here at expiration and we think expiration has a particularly large impact on the market and so you Know we try to make that case here we review what it looked like in the previous month to to check our work and then sort of make some projections going forward but there's some pretty standard Dynamics here right based on total exposures you could see in this chart here there's some basic ways that market
makers will have to uh hedge their positions right either initial hedge which we call a Delta hedge uh or a an adjustment to that hedge which is called A gamma hedge and so the idea here being that just because of market makers hedged in this case with their 5 million shares right here on this day on this moment at this price as soon as either time changes or the underlying stock moves they have to adjust that hedge right and that's the gamma hedge that's the idea of gamma uh and why it's so important um and
we're going to talk a lot about this Delta and Gamma Dynamic over the course of the rest of this Presentation um sorry go ahead Jack I'm just curious how in an environment dominated by macro like this you know tariffs on tariffs off you know big news every day how does that change I mean does it make it harder to do what you do in terms of thinking about how flows will influence the market because some crazy thing could just come up at any point you really got to zoom out so that's a really interesting question
here um and I wanted to Bounce a little bit we can we can we can touch on this again but it's kind of funny when there's not much going on you see short dated options volumes really flood into the market so zero DTE kind of rule the day as soon as there's uncertainty call it August of 200 24 or the Silicon Valley Bank crisis or even right now suddenly it becomes much more about longer dated positioning and those shorter dated zero DT flows uh cause less issue right so essentially when Things are dull got to
talk a lot more about what's supposed to happen today and when things get kind of crazy like this we got to zoom out a little bit and it becomes much more effective and that makes sense because there's a lot more standard deviations in the move right so you got to kind of zoom out a little bit uh you know from that perspective but the options Market to me is helping make these moves it's making a lot of sense and we'll present that here today um and And the deal is is that you know people have
we've talked about this before you know kind of trump derangement syndrome as an investment strategy and whether you like the guy or not Trump dang syndrome is not a great investment strategy and I see that bleeding into how people think the Market's going to react um and what's funny about that is that the options Market doesn't have Trump Ranger syndrome like a lot of some of the people that we know and so you Get a lot of Truth in the price right if people aren't buying puts then they really don't care they're not putting their
money where their mouth is in terms of you know Trump bringing the end of the United States as we know it um and again I'm not trying to say he's doing well or doing not I'm just simply stating that usually you know things get a little too carried away and too emotional and you can find truth in prices right um and so I think that is Often the sentiment value but there's a lot of positioning aspects in that and flow aspects in that uh and we're going to present some of that today is why 5500
is such key support it's because people are selling puts below that level for example and they're making the statement that they don't think the S&P is going to go below that level and that creates dealers uh hedging flows that are supportive of that of that price area as an example so the idea in the Expanding duration is if I want to hedge something like this like major economic problems or something like that buying zero DTE is doing nothing for me yeah I need to I need to go out further and so that's why you're seeing
it that way 100% uh this is called the the you know Known Unknown market so right now we all know Trump is allegedly negotiating tariffs uh you know I don't know that it's the greatest way to negotiate uh via tweet but you Know look we all know what's going on right we're trying to figure out if we're going to get tariff deals or not and he set up this deadline of April 2nd you know uh so we all know that there's this unknown it's a Known Unknown of is there a deal that's going to get
done or will this fall apart and become a full-blown trade War who knows right you can't hedge that with a zero DTE right you got to buy one two three six month options to hedge that that position out It's the same thing with the bank crisis right when Silicon Valley Bank went down we knew other Banks were in trouble we didn't know how the FED would respond if they would respond we didn't know if other Banks go would go down you can't HED out the zero DT you got to buy you know six-month option or
three-month option to to head yourself in that in that kind of situation so on this next slide we're looking at the Opex cycle which we talk About every time but it's probably good for you just to briefly explain it yeah and the deal is the biggest expirations are the third Friday of every month and the and the idea is that positions build up into that third Friday and with that the associated Hedges build up with those positions and then once those POs options positions expire the related Hedges go away and so we often see that
this can lead to a dynamic or a change in the Dynamic so if we maybe have a Strong Market rally we may uh uh Peak out or top out in that's in in at Opex excuse me and then if we're kind of crashing into expiration we may start to bounce as options puts are removed and the hedging flows can turn from selling the market to buying the market back so there's a often times a change in price and volatility around these options uh Cycles there's a bigger cycle around that which is the quarterly expiration so
um this is the March expiration which Is a quar expiration which means that it's bigger than a normal expiration and there's a lot more positions a lot more sizable positions that are set to expire because bigger institutions tend to position on these quarterly expirations so it's one thing to talk about in theory what can happen here but it's another thing to see it in practice and you know we' we've always talked about 2020 as an example of these expirations and the impact they have we Don't even need to talk about 2020 right now because we
can just talk about the last one if you look at this chart here the last oper was the turning point right at the expiration it pretty much expiration yeah vix expiration occurred two days before Opex and uh I you know we we were looking back saying well I think Nvidia is going to be you know the big turning point because that was a couple days after Opex but the the high was right on uh Vick's expiration day And and we came down right after that now what's interesting is we're going to talk about this Condor
trade that that uh has been coming in the market and that timed up with this with this selloff here in in February but as you can see almost like in the covid crash if you remember the February Opex really like released Vault and and then suddenly it's like okay tariffs and all this other bad news is actually going to come into fruition and that seems to Almost be what happened you know here uh sorry obviously in Co it was like people were dying in the streets in China were like why is the market crashing Opex
hits and down we go same thing here like tariffs and high pees and and all these other things right suddenly you're like okay all that got priced in the matter of like two weeks so uh and on this point this is a very large options expiration right now it's the second largest expiration ever but we still Have a week to go so these position sizes could change a little bit but what's interesting the takeaway here is this is uh S&P 500 so spiders and SPX it is as you can see it's larger in terms of
the the Delta value or the stock equivalent value set to expire it's larger than all other options combined so it's a massive complex if you talk about uh NASDAQ Russell that's this little bucket up here at the top so that's a much smaller options market Then we have the ETF so this is uh you know uh XLF Etc and then single stock so the takeaway when you look at this is okay this is all very put weighted meaning more put value in calls that totally makes sense because the stock market's been crashing so much uh
and generally again when you have this extreme of a of a sentiment in terms of humongous puts expiring that often times can be a local or shortterm shortterm bottom in the market that that put heav As a function of a people are buying puts but B also the puts are going up right so they're they're gaining value put values are going right because if you if you have a put that struck at say 58 or 5900 in the S&P and the S&P drops to 5600 then that put is almost worth you know full shares of
stock right so that put is gaining in massive value when that happens the the Delta value goes up right um and and that increases the size of what you're seeing on our Screen so you're exactly right that when the market drops a lot and continues to go lower put values expand and then we have these put heavy expirations and the idea is that the way that this has to get hedged out is with short futures or short stock positions from the market making Community right and so when we approach expiration they can start to buy
those shares back so if they're short you know several thousand shares in Tesla or a million shares in Tesla And they got to start to buy those back at expiration or right after expiration then that should generate a bounce in Tesla for example and is there any like reason is there any schedule in terms of how that happens like is it when we get like within a couple days of expiration if they're going to be buying they buy is it like once expiration clears is like how do you think about that there there's a lot
of path dependency into expiration right um when when you have a Situation like this where you know there's a lot of Traders like year long puts and the dealer short they have to very actively hedge that position we call that negative gamma which essentially means if the stock market's going down they got to keep selling Futures if the stock market bounces and come up they buy those Futures back and that exacerbates volatility right um and there's a lot of uh premium in these put options and because there's so much Volatility right so there's a Decay
function in here as well a lot of theta decay in this situation so that adds the dynamic uh but ultimately the dealers have this exposure on until expiration Friday right so at expiration Friday um they'll find out what their exposures are and then stock is actually assigned right so there's this big assignment thing so everything's not really cleared up until Saturday when positions are uh assigned and then on Kind of like Monday you know we think there's a lot of ShakeOut to the final exposures and final adjustments um so you know it's It's Tricky trying
to figure out the path at which this is hedged in theory if the Market rallied 5% to 10% today all these put values would go away and they wouldn't have anything else left to hedge right because the put values would go to zero so you know there's a there there's this uh again this path dependency and the Same idea if people stop buying puts and all the puts go deep in the money right at some point if I'm short one put for example and I'm short 100 shares I have no more exposure so there's nothing
left for me to do so that can often times kind of alleviate downside volatility as well it's like downside gets exhausted in that situation so in this next slide we're seeing what you talked about right which is this is put heavy this expiration Yeah and and it just shows you this is the the size or Delta value of every expiration currently and so you can see this is a much much larger expiration than April you know April is really quite small as is all the other expirations out in time so this is just meant to
help you help show that hey this is really significant this next week for uh for the options complex is March usually one of the bigger quarterly ones or is that just happened To be this year yeah definitely uh March is always one of the bigger ones obviously sep is huge December is going to be the biggest always the biggest at end of year position but uh March June SE those quarterly are always quite large um and that Segways us to this idea of the JP Morgan collar trade which expires at the end of this month
um this number 5565 is going to come up in our presentation JB Morgan uh runs a hedge fund that is long equities and every Quarter they put a collar position on we call this the JP Morgan collar trade and it's relevant here because JP Morgan owns a put this hedge fund owns a put at 5565 it is a massive position so on your screen here is gamma by strike and you can see this is all other strikes here right and then there's this giant negative strike there is a dealer or dealers that are short that
strike it's 40,000 puts and that generates a massive amount of hedging flow that's what kind Of gamma is showing you um and so this is a very significant level for the market into 331 that's the end of the uh end of March that's when this one buyers now before I mentioned that 5500 is kind of a support area These Bars if they're positive that means dealers own those puts we call that positive gamma areas which means that dealers actually will be buying the dip in this Zone oop sorry about that so the fact that there's
more net positive gamma puts in this area Suggests that dealers are buying dips uh into and Below 5,500 um and then the resistance area the big resistance area we see into Opex next week is 5700 dealers have again the dealers are long those calls which means they'll be selling into that rally so positive gam of hedging means they buy the dip and they sell the rip and so that is setting up this really kind of like a field goal we make that joke all the time I think we were picking on Justin Tucker not long
ago um in this case you know the the field goal is right there right 5500 to 5700 is this range that I think we're going to be stuck in through next week now I understand that's a large range but we've been swinging 100 points a day right over the course of this last week so uh in the cont text of of the volatility we've had that that's actually fairly tight window I think and we're going to talk about the JP Morgan Thing I know a little bit later but we typically don't go below that strike
right that bottom strike yeah that's right there's only one time since 2020 that we've closed below that and that was March of 2020 that we closed below the the JP Morgan long put strike we visited this area only really twice since then that was in March and June of 20122 and both times we closed just above it 15 bips on one uh time and 40 bips above it on the other other time so You know there is this pinning aspect to this trade and you know I just said pth dependency I think twice already so
we'll just say it again uh that you know how we head into this strike and how it gets hedged matters but ultimately I think what what it resolves or revolves around is the idea that there's a large entity a market maker dealer entity that is incentivized to have this thing close out of the money right they want the market to close above that and the Hedging flows will just naturally sort of support the market closing you know at or slightly above that strike is is what the what the takeaway is here so if you are
a long-term investor and looking trying to listen at what I'm saying here there's a whole bunch of options positions that support the market between 5565 and 5500 and that's lining up for a a short-term bounce as we get out of uh as we get out of March so on this next one in terms of predicted Volatility uh we're about as far to the left as we've been I think uh when we've done these right and we were just talking about gam so if you just add up the sum of all Gam the S&P 500 we
use that to create our gamma index and the farther we are to the left of this gam on this index the more negative gamma we have and that Associates with more volatility than the S&P 500 so in this case the y- AIS is Ford one day S&P volatility so obviously we have negative Gamma when we uh register large negative gamma before the Market opens the following session is very volatile uh and we're at kind of peak volatility now that's where this yellow arrow uh arrow is and you know so we have the largest amount of
of negative Gam that we've seen uh in some time um and all this gam is going to start to expire over the course of the next week which should relieve this volatility that we're seeing uh in the market um so again this This just highlights the statistical correlation between gamma positioning and S&P movement so is this the opposite of what we usually see so usually we we've seen low volatility and when the positions release it's opened up a window for more volatility now it's going to go the other way right so we're going to see
probably less volatility after the EXP you're exactly right y so normally we have a lot of call positions that kind of pins the market down and Then we remove those call positions those positive gamma call positions then volatility kind of expands right it's the it's the cycle The Circle of Life uh the cycle of of flows or my kids big into Lion King so it's natural um if you knew how to use your mixer board there we could put the music in right now I could still I could still do it then we'll get docked
on YouTube I think so we don't want that yeah I think that's true I think you can only do like Seven seconds or something um yeah uh and and that point that you brought up is a great segue to this chart which shows that there's some uh statistical evidence that says look we tend to flip after options expiration so if the market rallies 2third of the time we tend to sell off after if we so if we rally into Opex we'll sell off we'll mean revert right if we sell off into Opex we rally after
so that 68% of the time we have that kind of uh performance Flip uh around options expirations and you know this one seems like given how stretched these put values are and how much the Market's been pulled down it seems like it's a good bet that that the market is going to have a nice rally based on everything that we're seeing so what are we seeing in this next slide uh February Opex pin released to JP Morgan yeah this chart was on our Founders note on Tuesday and uh essentially you know what we're saying Is
look and we're going to talk about this momentarily again but there's nothing to clear the volatility from the system because of the of the Known Unknown of the Trump tariffs and he set this date which I don't know what happens on that date maybe we get a deal maybe we don't who knows uh another date might get another date second thing is um there's no we have these giant positions there's nothing to clear out those positions and so that can't Relieve the volatility either right so you know you if there's no positions in the market
then Trump can say whatever he wants and there's no reaction right uh there's a ton of positions then every tweet he has has a higher amount of volatility because of these giant positions and so when you look at this you know what I basically said is this is about time and price time being options expirations we start with vix expiration then we have fomc then we Have Opex that's all uh you know Tuesday Thursday uh Friday or Tuesday Wednesday Thursday Friday and then we have the March quarterly expiration where that JP Morgan position goes away
on 3:31 and then we have the uh the Tariff deadline on April 2nd so all that happens in this yellow zone and there's these giant options positions at that level that are very supportive of the market in this yellow box which is 5500 to 5565 and again this was in our founder Zone on Tuesday we tested and bounced that area uh on yesterday and today and so you know this is showing itself to be this kind of very supportive interm level right and the reason I say it's interm is because we're going to clear out
these positions if Trump says Hey Canada like we're sending our tanks up there or whatever people think is going to happen then obviously the market go lower if he cuts a deal then we're going to rip like you know that this floor you know could Go away is kind of a binary outcome of whatever we see out of this uh Tera Frederick so as as we look back to what we talked about last time I think and not try to predict what you're going to say but I think you're going to tell us that we're
pretty much seeing the opposite of all of it right now um we said no not much hedging going on not much volatility like it seems like we've probably reversed a lot of these things but yeah here you can talk about what we Talked about last time that's exactly right Jack I mean the presentation title from uh February was where is the VA uh and we were talking about these crazy Market moves like in Nvidia Nvidia had the largest market cap decline ever and it was like the implied VA went down over that period same same
thing with Tesla Tesla's down 30 to 50% and implied V went down over that period that's that's not what you'd expect uh to see well V finally caught up right now we're At the other extremes like okay now we're you know the V is kind of too rich so I just want to buzz through these slides I think last presentation I feel like we probably spent a little too much time on what what happened in the past but you'll Qui you'll pick up the theme quickly right this is volatility premium in February options expiration the
rub here is there's no volatility premium the market was quite volatile was moving around a lot but there was no extra Value inut positions people were not scared is what that is telling you or people you know people were not scared into Feb option expiration correlation uh we did some really great work uh if I can toot my own horn um about correlation into July of last year during you know the August crash we talked about how correlation fed that August UH 60 vix crash correlation was touching alltime lows are kind of Plumbing that area
into February options Expiration this was telling you that people didn't care about risk into February they were not positioned for any downside whatsoever again despite the fact that Nvidia and Tesla were actually getting pretty wonky into February options expiration so again people weren't positioned for downside um there was this interesting uh term structure bump for NVIDIA earnings that turned out to be not quite as big as a deal as Vic's options Expiration um this is another chart at the money S&P VA into uh February options expiration it was a dud right there was just nothing
going on in that volatility space and again this is surprising given how much uh volatility there was before you know we got into March right the markets were weak back then um you know put buyers again largely absent in the S&P positioning as you can see here there's an update of this slide we'll show you in a few Minutes but the rub was there wasn't very much put positions skew If people really wanted to buy out of the money puts because they thought the market was going to crash you can make the case there was
a little bit of put skew here that's what this index is measuring uh but it was far from you know a panic situation uh and again just covering some of the huge losses you know there was like for example this giant largest ever Market draw on Nvidia that was at The end of January um and so there's a ton of volatility in February huge Tesla volatility but again you know I mentioned before that the at the money implied VA was not responsive so just to recap on this you know Nvidia had massive volatility Tesla had
massive volatility and these red lines which is that at the money implied Vault just wasn't responsive it was really what this all was all about uh into February was people had bet big on calls and Getting long these stocks and these call values imploded VA came down as the stocks came down it was just very unusual and just highlighted this idea that nobody was positioned for downside talked about China you know topping out uh and again we highlighted Nvidia earnings as a as a key driver and what ended up happening here if we check uh
the way to look forward is the options Market the vix expiration right marked the high of the market we were that was The high of the day then we we just absolutely never turned back to the downside from uh from that moment from Vick's expiration um you know really really marked that that critical high and and to your credit like you were really talking about if I take a theme from last time it was there were a lot of red flags out there and you know the potential for increase volatility was there when you added
all this together Into the equation yeah you know so much of of the options market and volatility is like supply and demand right if everybody is on you know short V or betting that V is not going anywhere and VA seems cheap you know it's just like cheap houses people come in and they start buying that right and then then V goes too high it's like housing prices will get too high and you know then you know that the housing market is about to crash right it's the same thing we've Gone from scratching our head
saying this doesn't make sense it doesn't make sense people are under positioned to now okay VA is almost too expensive it's too high given given the moves that we're seeing um and so you we think about this move a 8 to 10% draw down in the S&P 500 for example and Vick spiking up to 30 to me that's a big function of the fact that nobody was positioned for downside right so what happens is Market starts to go down everyone are rushes to the Hedge themselves and and prepare for volatility they weren't ready for it
so you get just these exacerbated moves because everyone's kind of asleep at the wheel for example so before we get into this one which is what everybody wants to see here in terms of what you're seeing behind the scenes I will take a little bit of a guess in terms of where we're going here because I want to see if I've actually learned anything uh as as I've Listened to you this whole time but uh I I would think based on our our sort of our expiration 101 we've talked about you know we've said whenever
we get a big move in One Direction into an expiration and that expiration is very large you've got the potential for a reversal so I would think you have the potential for maybe a reversal of some of this downside now I don't know if that's lasting or not but that would be my guess based on what you've taught me So far yeah you're exactly right and so it's kind of it's a weird spot right because when the vix gets to 25 to 30 which is roughly where we are right now 25 area right um what
that's essentially telling you is that options are expensive and nobody wants to buy expensive stuff now expensive is relative if if a nuke goes off and the vix goes to 100 you been like oh crap I should have bought you know options when the vix is at 25 or put options uh but Most of the time it's like that famous thing shorting in the hole it's like I don't want to buy puts at vix 25 right I don't want to buy S&P 500 and the vix is at 25 which is telling me that implied Val
options are expensive that's why vix 25 is relevant so from an options perspective you're like I don't want to BU puts into this so I'm not going to add pressure to this downside you know vix at 20 to 25 with this unknown situation of the tariffs it's Not a home run to shortfall right now but when vix goes to 30 then you suddenly were able to bring some people out saying okay this is getting like a little bit crazy I can sell all from that perspective um you know the macro people arguably don't want to
do anything right now because either you know uh rate uncertainty or they just want to go to bonds because bonds seem like a better deal because Trump's gonna you know walk rates down I don't know um And then you know I would pass a baton to you and say from a valuation perspective maybe in the last couple of days some of the stocks have just got so pummeled that maybe there's some good value there uh but it's like what what buyer have we triggered you know what I mean and until the vix kind of got
to 30 there wasn't like this obviously obvious you know volatility sellers that wanted to step up um so you know really what it is is we had to get these extremes to Make somebody want to say hey this is an attractive dip to buy right either the option sellers come out they sell puts uh either they sold puts they long or short sale puts or you get valuation people to come up or we clear out the unknowns and people can start to make investment uh Express investment ideas because they have some idea what's going on
with tariffs so yeah to your point valuations although they don't matter that much in The short term a lot of these Tech names have been like killed right I mean for people who thought they were attractive values before I mean they they're getting way way better prices now some of these names I was just seeing it come across the other day like some of the percent declines in these names they're big yeah yeah um you know uh 20 30% uh Plus in a lot of these things and uh you know I was even just looking
at like Target um which you know stocks down at 100 it was up at 150 not long ago so you know um even Costco Costco's even down um so you know things are getting beat up everything except for the sibo the cwe which makes money both ways right you either buy your zero DTS on good days or you buy your vix calls when the Market's falling apart and you know they as as as you pointed out Costco's got no eggs and a lot of chickens right don't have any egg I we I don't live near
Costco my wife And and I also feel like when I go no one cares about the story want to tell anyway and so we never go because I was just feel like we end up buying a whole bunch of crap we don't need anyways which is probably the same thing that that so it's like I'm going to save so much money by buying bulk but then you buy a whole bunch of other crap I'm like what's the net savings anyways uh you couldn't find a parking spot at Costco and then um literally there was zero
Eggs there and then you walk over to the chicken aisle and you're like there's unlimited roasted chickens at $450 sense um which just like kind of blew my mind but apparently the deal is that the bird flu affects henl uh eggl hens uh not the uh birds that are used to eat roasting chickens I didn't know that was a different thing but it is a different thing there's actually an economic reason for this the one way to find out is to tweet it right and then people Will tell you those the nonsense tweets continue to
be my best performing tweets um I could I could provide you literally the key to the stock trading Kingdom I don't know that I have but if I did would still get like no attention but if you make a joke about uh particularly inappropriate joke then those do great a so on that point we're gonna put flames on this thumbnail and see how it does yeah yeah we'll get that done so uh as as we head into this this next slide Here you're talking about that that known unknowns you referenced before yeah and and this
was just the sort of thing and it was a theme that was in our in our notes recently because you get some really major rallies during this bare Market slide right like today S&P is up 2% and everyone okay this is it right like this is the moment to to buy this dip um but but my argument is like look there's nothing to clear the Vall actually out of the system there's Nothing to remove this negative gamma from the system because we don't have options expiration so if we got a deal and then everyone would
buy the dip then okay then we have some extension in the rally like Traders could sell all down uh you know the vix could go back to 15ish uh but we don't have a deal we don't know if a deal is coming and and so at at uh options expiration we're going to remove this negative gamma right puts our negative gamma we'll Remove those Vick's calls are going to start to expire on Tuesday morning so that's going to relieve some pressure there and you know what I the the graph I showed you here is if
you take the S&P 500 positions so spiders and SPX if you wait the call positions against the put positions uh what you see is that all strikes within anywhere near where we're trading the fact that this chart is negative is telling us that it's all put gamma put gamma is dominating the Trading landscape here um it is a tremendous amount of positioning and that just means that people the market makers are chasing to the upside and they're chasing back to the downside and so you know you get these overshoot rallies that just crash rate bound
the next day um and then not only that anytime a tweet or a headline comes out there's a huge Market reaction we talked about this last time where people you know deep seek news was out before the Nvidia crash right but the Nvidia crash was so big on the Deep seek news that everyone thought deep seek was like the biggest thing that had ever happened in the history of the stock market right and the argument was like Nvidia is so levered now that it overreacts the stock overreacts to anything so people look at the stock
being down you know 15 to 20% and going oh my God deep seek is so important whereas if the stock went down 1% people have been like oh deep seek Doesn't mean anything so I think that's true of some of these tweets now it's like you know the market reacts 1% down on some tweet and people goes this tweet is so important how can Trump you know be doing this and I'm not again not saying that he's right to handle things like this I'm just saying that people too much important to those tweets because the
market goes down a percent and the market is going down a percent because there's all this flow pushing The market down uh you know as soon as it it's like the the market budges lower and then all this flow comes in to slam it you know down 1% it's interesting because just going back to that 2% upd thing like it's ironic a little bit because if we if we actually wanted a lasting bottom from an option flows perspective like we don't want the 2% rally right now right we probably want the market cascading downward into
the expiration and we get A more lasting bottom rather than this is that right yeah it's like a slingshot that's exactly right like the more you can jack V up and like pull that down not not you jack like Jack is an increase uh then you know then then it is like that that slingshot so you know um we we're up 2% today easily fade that tomorrow back down to the 5,500 5565 and you know that would make total sense to me and and it really wouldn't Induce this much anxiety because I know there's these
big positions that are swinging and again a lot of the stuff that's induced ucing these swings is going to go away next week um and so that should start to relieve some of this like two-way volatility we have meaning that I think we'll get more of a directional rally and then things will like cool off a little bit uh once we kind of get into early April so uh so my favorite data Indicator doesn't matter here on this next slide yes uh I'm here to talk poorly about all of your most important CPI PPI NFP
what other acronyms we got there ism I'm here to say it doesn't matter um and the evidence for that is interesting this is the vix one day a vix 1D it's called it measures the one the one day vix and into CPI this week it had last week it had the highest reading that we've had in a long time as you could See there was showing about 32 I put that in red and this was on CPI day and so people thought that the CPI was you know obviously very important based on the fact that
the vix for this date was very high right the vix the one day vix is very high it says something important is going on today our Traders are expecting a lot of volatility and so you know the the macro pundits will tell you that okay this means the CPI is really important and and at first I was like Okay you know this is unusual so what I what I what happened in is our morning note I quoted this that the zero DT straddle was $83 um that's extremely expensive for a zero DT straddle you got
to go back several years to kind of see a zero DT straddle that has that price and to be clear what a zero DT stradle is if you take the option that is expiring today take the at the money call and you take the at the money put and you add those Prices together you get a rough approximation for how much volatility the options Market's uh pricing in does that make sense yes so when I'm buying a straddle I want volatility to go up right in either direction so if you buy an $83 stradle for
the SPX index um if the market moves more than 83 handles on that day you jack make money yatsi if it if it comes in less than then you lose whatever the difference is so normally in that situation you know on any given Day the S&P straddles something like 30 bucks right um so this is really significant and you know this CPI doesn't seem to be all that important you know um given the Trump tariff rhetoric like rates are actually coming down you know it didn't line up as like in late 2023 it was you
kind of understood why the CPI was so important right it was like you know uh when can we stop raising rates um and this one is like it's a different situation and so The reason I bring this up is because we've been tracking this trade called we we named this guy Captain Condor and what he does is he trades a very large zero DT iron Condor now an iron Condor is something like a straddle in that it is a bet on Market volatility and essentially what it is when you sell a condor you're betting that
the market is going to stay within the strikes that you sell so in this case you have a situation where The Condor Trader was positioned with a giant position 30,000 contracts on each side uh which is very large for the S&B on a zero DD contract um and that position was $83 away from where the S&P 500 was trading um and the reason that that's interesting to me is because that's a huge position when you get to 30,000 Zer DT contracts uh you know per spread um that's going to the market making dealer Community you
would think would register that CU it is so so big Think about this way we we talk about the JP Morgan collar trade all the time right that's 40,000 contracts it's expiring at the end of the month so you know that that puts it into into signal and and the reason I bring this up is because it was fascinating that this Trader puts on this trade the day before at 4m. so it's technically a 1 DTE bet so at 4:15 the day before expiration right uh so this would have been on Tuesday night he puts
on this bet that The market won't move more than you know x% on Wednesday does that make sense or on CPI day and so the the the thing is is you go okay there's this giant position and the prices from where the market was trading to the to the strikes of the Condor which you can see right here was exactly $83 it was the same price as the straddle so to me it was this evidence that what the volatility was actually pricing in was this giant Condor position and market makers were Arguably pricing in such
an expensive option of straddle because of that positioning they had nothing to do with the actual CPI itself it had nothing to do with that data point and if you weren't aware of that options positioning then you may have misconstrued the importance of the CPI does that make sense it makes a lot of sense and so the the interesting thing about this condro trade is we see this they have a a really fascinating trading Style um where they run this Martingale strategy they put on a condor trade zero DTE if it's wrong they double their
size the next day and every time they're wrong they keep doubling that size um it's going to end well right sounds like a way to go bankrupt at the casino or something it's exactly that way and so what happens is they keep lading up so we we've seen now about 10 times over the last six months that this trade has gone over 10,000 contracts per side at One point it actually went 50,000 contracts in size and interestingly that was the Friday before the deepsea collapse and and the reason I bring this up is because the
day after these big Condor trades expire uh uh when they expire the day after volatility jump there's a very high correlation there now there's only again about 10 data points there so I can't like put a flag in the ground and have all the quants kind of like code to this uh but there Is this idea that this giant cor Condor trade suppresses volatility and then suddenly volatility expands so what day was that you know 50,000 lot Condor might you ask it was this day right here it was the same day as uh vix expiration
in or Opex and Friday Opex so was right here was that giant 50,000 loot Condor trade right then the next day volatility dumps so there's become this really interesting correlation it just happened after this most recent trade as well Where again the short-term positioning may be having an exacerbated effect in volatility um just in the side before we move on to the next slide uh we don't know who Captain Condor is right this is a Anonymous person it is an anonymous person or persons yeah um there's a rumor that it's a kind of a retail
trading community and uh I don't want to say which one cuz I don't want to really draw attention to this because I don't know that it's a really healthy trading Strategy the reason is because as we all know if you play roulette and you run the Mart Gale trading strategy it works great until you're wrong five six times in a row then suddenly you don't have enough bankroll to continue or the casino manager comes out and says you're done uh which you know you're talking about when you're talking about 30,000 uh spreads that's a you
know six seven eight million uh trade right um and then if you double that you're Talking about you know 105 million trade you double that so the the the value can just that this person risking can can accelerate very very quickly um and this is the CPI day and I just want to highlight this like CPI comes out here there's this huge up reaction then the market just does this giant gation thing and it's like okay I don't know if CPI was good or bad really at the end of the day but if CPI was
the most important thing ever the market Literally was unchanged uh and stayed exactly between these iron convor strikes that were so big in the market and that $85 price proved to be way too expensive right because the market closed essentially like unchanged so market makers in theory made a ton of money on that day as the as did the captain Condor on that day because overall volatility was just very muted and if that CPI was so important you would have expected a much bigger Directional change uh based on the outcome of that data print is
the captain Condor is he doing this consistently all the time it just doesn't get big that often or is he just doing it in certain times the trade started as near as I could tell in July of last year and um and you know it when it's small it starts about 2500 loot contract size which blends in with a lot of other positions so sometimes it could be hard to finger point you know or Point to exactly where that trade is but when they lose they quickly double up and as soon as you get over
5,000 size in the zero DT space your position is going to start to stand out a little bit particularly if it's a condor trade because a condor trade is short a put spread and short a call spread so you can line up these strikes pretty easily and you can figure out where the print is taking place so again it's been a little over 10 times that the position's Gotten over 10,000 in size um and that's where there're starts to be what seems like some you know definable market movement I will say for short tra short-term
Traders um we watch these strikes because the market seems to react to them so if you think about Futures Traders and stuff like that they they like to watch these positions because the market seems to react um but now there's this evidence that you know there's kind of this one DTE effect like So once the big Condor trade is goes away volatility seems to expand the next day there there seems to be evidence that that is a uh that is a true phenomenon and and and the the trade doesn't make sense for the strict reason
that it's a negatively skewed payoff the best I can figure the best case scenario you make a175 per contract when you are correct you lose $325 when you are wrong when your Condor trade is wrong I think the price he gets is actually tends to Be a little bit worse than that but let's just say great you make a $1.75 to lose 325 when you're wrong well his hit rate as near as I could tell is 60% so you can do the math on that Jack you can realize that that's a terrible trading strategy unless
you double down right and then when you double down if you're right you recoup your gains and then some the next day but of course like all other Martin Gale betting strategies at the casino there's going to be this Chain of events where you're wrong four five six times and you run out of bank roll and then this entire trading strategy just nukes you right um and you know unfortunately in those situations we all know the rules of the game change a mar a margin rate may change with your broker or whatever it may be
and that's why you can't trade you know it's just like the Hunt Brothers they had the silver market cornered and then said well guess what you're no longer allowed To uh was it buy or sell server I forget which one blew them up and you know uh and then the Hunt Brothers went belly up the silver squeeze if you I guess I'm older than you jack so you don't know that story you about the same remember I do I do know that not as well as you do but uh but yeah on this on this
next slide you're talking about of the many many things that have changed since our last episode this is another one correlation right so this Was in our previous what happened into February correlation was really low in this case correlation spiked what does correlation spiking means it means that suddenly all stocks are for sale so in a very bullish market like we had into July of last year or even into February of this year people ear in stocks right but then it becomes hey what stock do I buy oh Nvidia is going to crush it or
it's Tesla or it's a GameStop or it's micro strategy like people are trying to Bet on which stock they need to own to outperform the market when the market crashes all stocks go down and the conversation starts to be do I own stocks at all or should I be over there in bonds or in cash or in gold or whatever it may be right so that you know correlation spiking is evidence of generally the market crashing um and you know like other barometers this is just an index so you know you could start to see
we've reached the area of the August Selloff where correlation spiked and and we're kind of in that area of 2022 where all of 2022 was again do I own bonds or do I own stocks like which way am I going here or do I just sit in cash or I guess you didn't really want to own Bonds in 2022 either you wanted to own savings bonds was that that was it right wasn't that what everyone was into yeah I think it was I think it was savings sponse I never was but I guess so you
know the point was is like you know People viewed equities as an asset class uh in my in or out whereas most of the time people are like I own stocks which one do I own to outperform the market um so you know this correlation is a riskof sentiment again from these lows um the VA premium Now very high uh as you can see here on this chart this is the spider implied VA premium uh you know which is just showing you that the spr red between the red and blue lines is essentially the VA
premium and that has Obviously expanded quite a bit from where we were in February down in this kind of area um and you start to see that this is the August crash right where vix went over 60 and you know you can see you start to get this really big premium that premium brings out the options sellers right they start to go okay either if I own puts the great time to sell them I want to cash in when this premium is high or I may want to short puts because there's enough juice to Make
this BET right even if there is this risk of trump uh you know escalating the Tariff stuff statistically speaking I can make the case that this is a nice place for me to sell puts or short them uh or short volatility um because the you know the juice could be worth the squeeze in that situation right from last episode this this premium had been very low for a long time right before this yeah and if you just compare the spread generally Between this um you know you can see it es and flows uh but you
know February were over here where that that premium was really quite tight um and again this is just kind of a rough approximation of that idea but when you get plied VA really energized and jumping like the vix hits 60 or excuse me 30 in this case that's generally telling you that okay the The Vault Prem is getting pretty well High because Traders are starting to buy put options they're starting to Get worried about the downside um and and uh in generally again that extra premium starts to make short volatility strategies possibly more interesting so
now on this next slide we're getting at potential YouTube titles for for Jack here with the V waterfall the V waterfall um I still like Quant some comping that one never made anything so we'll try the Vol water that one was great yeah I wish that had work cuz that was phenomenal yeah yeah uh But the idea here is realized volatility has increased quite a bit and so realized VA in this case the the green line is one month realized VA so it's like how much has the market been moving over the last 30 days
on an annualized basis it's about uh 17 18 19% in that area um 5day realiz all is a red line and you can see we're up closer to 22 historically if you add 3.5 points to that green line you get the fair value for the vix so the green lines right About 1819 right now you had three let's call it four points to that um you got vix 22 so vix 22 is fair value based on how much the stock market's been moving hopefully that uh that's clear and so the idea is that if realized
VA starts to come down right I.E the stock market just stops whipping around so much then as that realized VA comes down then implied VA can come down as well right the vix can drop because fair value in the vix is lower it makes sense because If the market is moving less then you then you don't need to price in so much volatility in the future and that's really what this is uh realized all it's hard for the market to stain sustain this level of realized volatility uh of course if Trump starts trade War then
then that goes out the window but just generally speaking you're getting to this realized V level of roughly 20 you know the the S&P that's 1 to 2% moves on a daily basis That that generally is not a sustainable amount of movement and just to give you a little credit before we move on here as much as Quantum comping did not work as a YouTube title coiled for big moves which I took out of your last one um actually worked exceptionally well so our last episode had a very good click through it un coiled for
big moves all right I like it I'll find something in here that works I think yeah you just keep Throwing at the wall and then something sticks I guess pretty much what it is a lot of testing back and forth yeah um but so so this next one you're looking and this is something I think a lot of people don't understand what it is but so you're looking at fix strike V on this next one right yes it's a critical dynamic in this type of environment because so many people base their you know volatility sentiment
or Market sentiment off the vix and and We've talked about this several times in the past where the vix is a function of the prices of S&P 500 options and so the deal is is that naturally options that are farther out of the money so like put values and put options you know farther down they have naturally higher implied vaults than call options in the S&P 500 right there's this skew that is like a ramp and so when when you calculate the vix right you're taking all those options prices around basically where The S&P is
is trading you you essentially sum those implied balls up and that calculates the vix well if the market goes down let's say 2% then the vix is taking into the equation options with higher implied Vols just naturally right because they're that skew same thing if the market rallies well those calls already had a lower implied VA so now the vix is just calculating lower implied vs off of off of uh the natural skew of options prices so what I'm what I'm essentially telling you is often times the vix is just simply an expression of the
S&P going up or down it's not actually reflecting a volatility demand or demand for options um I I'm praying that that uh explanation that makes a lot of sense yeah and I think a lot of people get that wrong right A lot of people look at that look at the vix and maybe draw the wrong conclusions specifically during these big moves that's exactly right um If you know the vix has to go up in excess of of of of that S&P V or down an expression of okay you know volatility prices implied volatility actually went
up or down so you have to kind of that's why we look at fixed strike VA because what fix strike VA is showing you is what is the actual implied volatility change at each strike in the S&P 500 and so what I did here is I compared fixed strike V so you know what is the VA at the 5,500 puts for example from last Friday to today right and in the short term there's some noise right because you know dates creep up on us but if you look out at May or even July expirations here
what you can see is that fixed strike V is down across the board and those of you I don't know if some people just listen to this how you could possibly miss the slide decks is beyond me but uh we're down about one to two Vault points last over last week the S&P made fresh lows you know in in this uh During this time frame um but the fact that fixed strike V is down even though the market is actually a little bit lower is telling you that implied vol is falling right so the vix
is actually going to be flat to up during this period which most people will tell you means that there's more fear because the fear index is high but when you actually look at fix strike Val the fact that fix strike VA is down is telling you that implied vs are coming down that that the Risk that's being priced in the market is deflating it's coming off and unless you look at this fixed strike V lens um then you would not understand or uncover that uh phenomenon and for people like me there there's nothing publicly ailable
about this right you're not going to un unless you subscribe to something like spot Gamma or something else you're not going to find this data anywhere right yeah um I I'm sure there's some institutional Risk systems out there one of the reason we built this because it wasn't available anywhere else I don't say that as a plug i l legitimately don't know of of another uh good source for this and you know we built it because it provides such valuable information I think a lot of times you'll see you know chrisad deil and the real
V guys talking about fix strike v um and it's a shame because there is really some great information embedded in there right um You don't get Kind of like tricked or or uh you know you don't misread misread VA indexes for example when you're able to to monitor fix strike volatility so on this next slide we're again reversing last time we've gone from puts too cheap to puts too rich maybe yeah and there's a lot of noise in this chart but I I left it this way I just chose any options with the ADV over
50,000 uh calls just to thin it out a little bit uh thin out the the plots and So IV rank you know one is the highest implied VA over the last year so where are we ranked the stats go back a year so if you're near one you're at a really high implied VA and then skew rank which is the Y AIS if you're at a zero that means put prices relative to Vols uh excuse me relative to calls are at highs right so we we're huge put prices and very high volatility is kind of
the the sum of all this chart right um when you have a very bullish environment you Would have most of the plots up here at the top of the chart cuz call PR would be very high relative to puts so when you look at this you're going back to last year this is pricing in or includes the dates of you know the the August volatility crash and the fomc kind of Crash uh that we had in December and then of course the deep sea crash and stuff so you know the fact that a lot of
these names are at the bottom of this chart which tells us that put prices are High versus the ranking over the last year and then implied VA is also pretty high for most of these names it's telling you that again this is all very stretched when I look at this I go I can't buy puts any of these names or it just seems like a real disincentive for me to want to buy puts in any of these names because it's always already so expensive now do I want to sell those puts maybe maybe not that's
that's a different discussion I certainly want to Buy them it's just again this idea that things are too uh the downside is too stretched if we rally a little bit you relieve some of this pressure then maybe we could go back down but right now it's a stalemate because if you own puts you know maybe you're okay holding those but you definitely want to short uh you know you definitely want to buy them at this point right shorting in the hole essentially is what this is what this is showing us and the sector themes are
Also pretty interesting you see stuff like you know Apple Walmart JP Morgan Nike you know this is not just the Deep seek reaction this is actually some of the bigger more macro um you know defensive names or or retail names you know stuff that is generally not uh as volatile that's getting pretty beat up uh Airlines in here another one that I thought was really interesting that's showing up here is GDX and and actually gold right gold hit all-time highs um Yesterday or today and uh there is no evidence at all that the call buyers
are really coming in and heavy weight in in into gold um if you remember recently we talked about how rich call skes were in in the Chinese stocks for example off that huge rally um and that proved to be a stalling point an area where these Chinese stops have have stopped out because the call prices got too rich gold right now does not show any signs of being too rich in terms of call Prices which is very interesting given that it just hit new alltime high so I'm I'm kind of flagging this is one that
we're going to check in next next month and and really see what happened with gold prices as uh the idea being that once these call buyers kind of wake up that could really kind of accelerate gains and so that's that's something I'm I'm certainly watching um and and if nothing else if you're interested in kind trying to ride that gold train I I Don't know which way gold is going but I can tell you that call prices seem pretty reasonable uh if you want to bet that Gold's going to go higher and and I say
that because you can see here on the skew rank GLD which is the gold ETF it's at a 02 um that's telling you actually people if anything are more into puts than calls at this point which is uh which is a little bit uh unique so on this next slide we've got one of the reasons we're reporting early here which Is there's a lot of events coming up right next week we have vix expiration Tuesday there's a big fomc then a huge options expiration on Friday and then you got another roughly about a week and
then on 3:31 is where this JP Morgan call expires I'll talk about that in a second and then uh I believe that the next day uh it might be two days later I forget what I think 3:31 is a Monday actually so two days later is the Tariff deadline who knows what the heck that Means uh but there is a what looks like an implied VA bump which I think will get more kind of distinguished or or pronounced uh as we get closer to that date but the market definitely seems to be pricing in some
volatility around that date uh which makes sense so again the the the path here is between these positions all clearing out if the FED particularly is just kind of like a nothing burger or doesn't you know shake the the volatility tree too much then You would expect implied vol come down a little bit right the positioning should relieve some of the volatility but we we can't quite kick it into full gear until we get like a tariff all clear um which means that I think we could have a mild rally um after this but but
not a full you know risk-on rally unless you know fed could be very doish maybe and that would kind of light things up but the the real Point here is that the the volatility that we're seeing should Start to become really muted I think into the end of the end of the month um another sector I just want to toss this in for extra credit uh Danny Kur is is a is a great follow on Twitter there um an Institutional uh sales Trader uh he pointed out that hyg put volumes which is the high yield
uh put ETF or high yield uh Bond ETF excuse me had just these record Put volumes same thing with lqd and what's interesting about these record Put volumes is I'm I'm invoking The fix strike Matrix again here uh and what you see is the red is telling us that statistically imp vs are down um into the downside in hyg which which would infer that people are actually selling the puts that they owned right because if you're selling puts that's going to make the implied VA go down implied VA is just a way of saying options
prices so the fact that these options prices are so depressed is telling us that there's big put sellers Uh in hyg which is again these credit ETFs we're seeing similar flow in TLT big put flow uh as well as in lqd um which is just this kind of evidence again that maybe we've hit this short-term bottom hyg obviously has been you know beat up pretty good uh over the last couple of uh of days and weeks and so you know this seems to be some people monetizing or selling some puts that they owned uh another
just one of the things that maybe we're getting this Kind of risk on sentiment starting to starting to approach yeah and as next one we're getting the JP Morgan colar trade which could be Ive I've learned when we get near those strikes that's where it becomes more important right and so um this is going to be you know billions of dollars worth of Gam talking 5 to10 billion worth of gamma so what does that mean that means there's 5 to1 billion worth of hedging flow tied to this strike as we get into expiration And that's
persistent hedging flow it's not like it's on right now and then it goes away like hey I bought $5 billion with apple and I'm done it's like $5 billion need to buy here five billion need to sell here like all day long right um every day and so this is our Trace map uh and what it's essentially showing you is gamma by strike and the reason I highlight this is because you can see the gamma for this 55 65 is just really big gamma increases as we get Closer to expiration so that Strike should continue
to grow in size and importance um and it's been a real key level already I'm honestly tired of saying JP Morgan 5565 already and we still got another two weeks to go uh but this is the market performance over the last 5 days and that black line is the 5565 strike so you know there are these hedging flows that are only going to increase in size around this strike every also everyone also is kind of Aware that this trade is in the market which I think naturally makes it this support and resistance level kind of
like a moving average uh in that respect and so you know it is a it is something to watch on 331 they will roll their JP Morgan collar position to uh is it it's June is the next quarter I had to think about that for a second uh so at the end of June they will restrike these positions uh which is always kind of a big trading day um on that last day of Of uh of March and so you know the kind of rub here is again that there are these big supportive put positions
at 5,500 into next Friday's expiration but this position will still be there to tether the market in a lot of ways into the end of March and so you know you kind of need to be aware of that uh Dynamic you know and look if if the FED is doish and there's some good news that comes out about tariffs before the end of the month then then nothing says that We can't just rally Above This strike I do think though that it's hard for the market to push below this strike uh and close below it
onto expiration and so you know it's just a it's it's just another supportive indicator uh positioning indicator that's in the market until the end of March would there be something if we did break through it would there would it like serve to exacerbate the downside so if we did ever get through it would it get Would it make it more likely we' go down more you know that in theory that is correct what what the what seems to be happening to me though is that the dealers hedge it out right they have other positions that
offset some of the risk and so I'm going back to this other slide quickly because you see all these put positions right so this is the JP Morgan strike that same one that I highlighted in red before it's just big strike here there's all these other Smaller but positive gamma strikes below it which are offsetting the risk for the strike below right so if we net out all the all the exposure here to the downside there's actually not that much exposure and you can see because this red line goes up that's what that red line
is telling you that's kind of like the sum of gamma as we go down in price so this thing seems to be pretty well hedged out and you know there's some Futures short Futures that are tied to It as well and there'll be you know all else equal they're going to buy some of those Futures back as the position decays into 331 now this position is going to change quite a bit over the next week right with with the with the options expiration next Friday um but you know in theory Jack you are correct but
I think when you actually looked at positioning there's a lot that's offsetting the downside risk uh to this you know specific put and it it makes You kind of wonder why they bother doing this anyways because it doesn't ever seem to pay out and and and they short this call to the upside and that call often times get gets blown through to the upside so it just seems to be Real Performance drag uh for the fun but you know people like people like the yield I guess or whatever I don't know so as we wrap
up here Bren I gotta say like our our first markets in tmal episode was a lot of Fun we usually have in the Opex effect yeah I'm I'm looking forward to seeing how the Flames return and if people get a lot more excited um you know I can't bring myself to put the flames on the actual YouTube cover because I hate the channels that do that kind of stuff but I I will put it in the in the episode somewhere there'll be there'll be a picture of you with the Flames somewhere Inside the episode yeah
uh if it doesn't work we could start doing like shirtless Workout videos maybe though get I don't know if anybody wants to see that draw the that's a good note to wrap up on uh thank you everyone for joining us and we'll see you next time thanks so much ja it was fun and we'll see you we'll see you next month thanks so much for tuning into this episode if you found this discussion interesting and valuable Please Subscribe in either iTunes or on YouTube for L review or a Comment we appreciate Jack forand is a
principal at Validia Capital Management no information on this podcast should be construed as investment advice Securities discussed in the podcast may be Holdings of clients of Validia capital