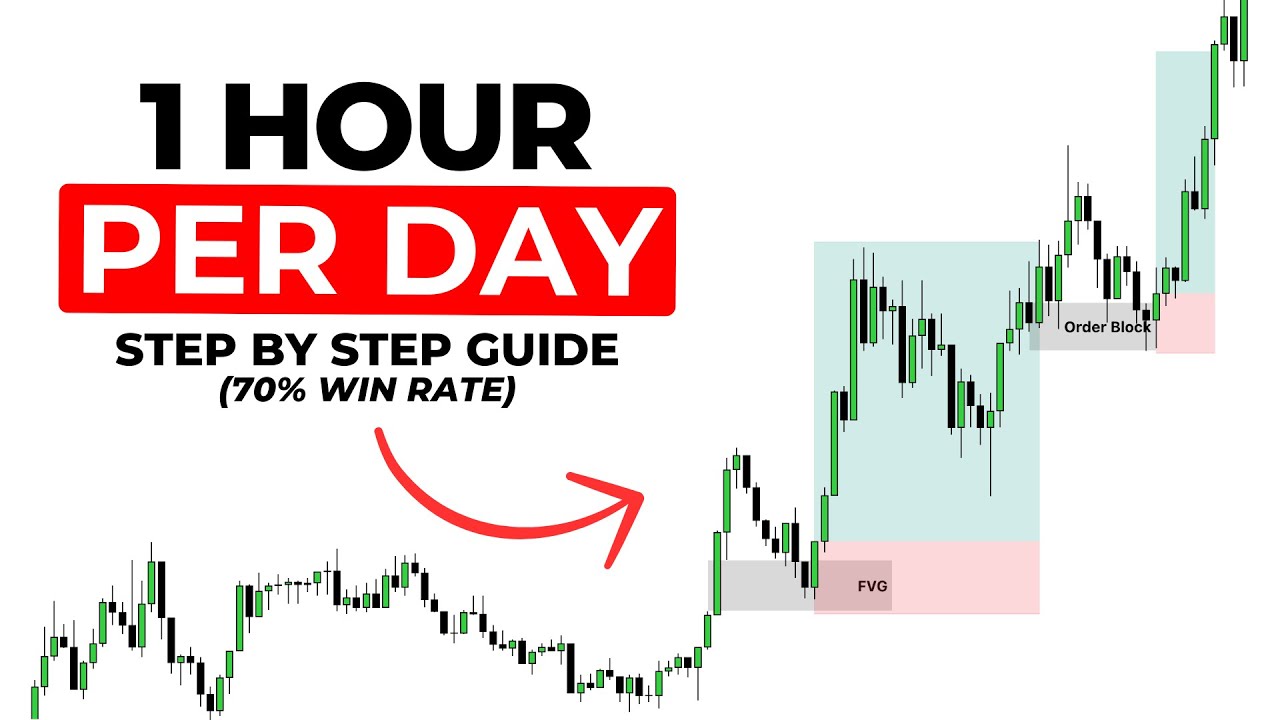
[Music] [Applause] Hi everyone and welcome back to a new video. In today's video, I'm going to walk you through a precise gold sculping strategy designed for fast, efficient trades in any market condition. Whether you're looking to sharpen your entries or maximize short-term opportunities, this step-by-step breakdown will give you a clear edge.
So, let's get started. All right, so let's talk about kill zone timings and why they are so important for traders like us. A kill zone simply refers to a specific time window during the trading day when the market is most active when big institutions like banks or hedge funds are moving money.
These windows are important because this is when we often see the most liquidity, the most manipulation, and the clearest setups. In other words, this is when smart money is most likely to make their moves. There are a few kill zones that we focus on.
Firstly, we focus on the Asia session kill zone, and this is between 8:00 p. m. and midnight.
Please take note that all these times are UTC minus 4 or UTC minus 5, but this is Eastern Standard Time. This is New York standard time. Then we have London Killzone.
Now, the London Kill Zone, which starts at 2:00 a. m. to 5:00 a.
m. And then we have New York Killzone. And for this specific strategy, we are going to focus on New York Killzone.
This happens from 7:00 a. m. New York time to 10:00 a.
m. New York time. So in the bottom right hand corner of your trading view, I'll show you later, but you should change your chart to New York time so that your times align with these New York timings.
During these periods, price action can be very sharp. You'll often see stop hunts, false moves to trap traders, and then the real direction takes off. By focusing your trading during these kill zones, you're aligning yourself with the times when smart money is most active instead of trying to force trades during dead low volume hours.
So, in short, kill zones help you trade smarter and not harder. And later on in this video, I'm going to show you exactly how to time the entries around this window to catch the highest probability trade on gold. Now that you understand kill zones and timings, let's move on to the second step of this model.
We're going to talk about change in the state of delivery. I have multiple videos where I discuss change instead of delivery, but I'll do quick rundown for those of you who are new to trading. Simply put, it is when the control of the market shifts from one side to the other, either from sellers to buyers or from buyers to sellers.
An example, if the market has been dropping because sellers were in control, but then we start seeing strong bullish candles, higher highs, higher lows, that's a sign that buyers are now taking over. In other words, the way price is being delivered is changing direction. Recognizing this shift early is a powerful because it tells you when the market momentum is likely to reverse and it helps you get into trades with the smart money and not against it.
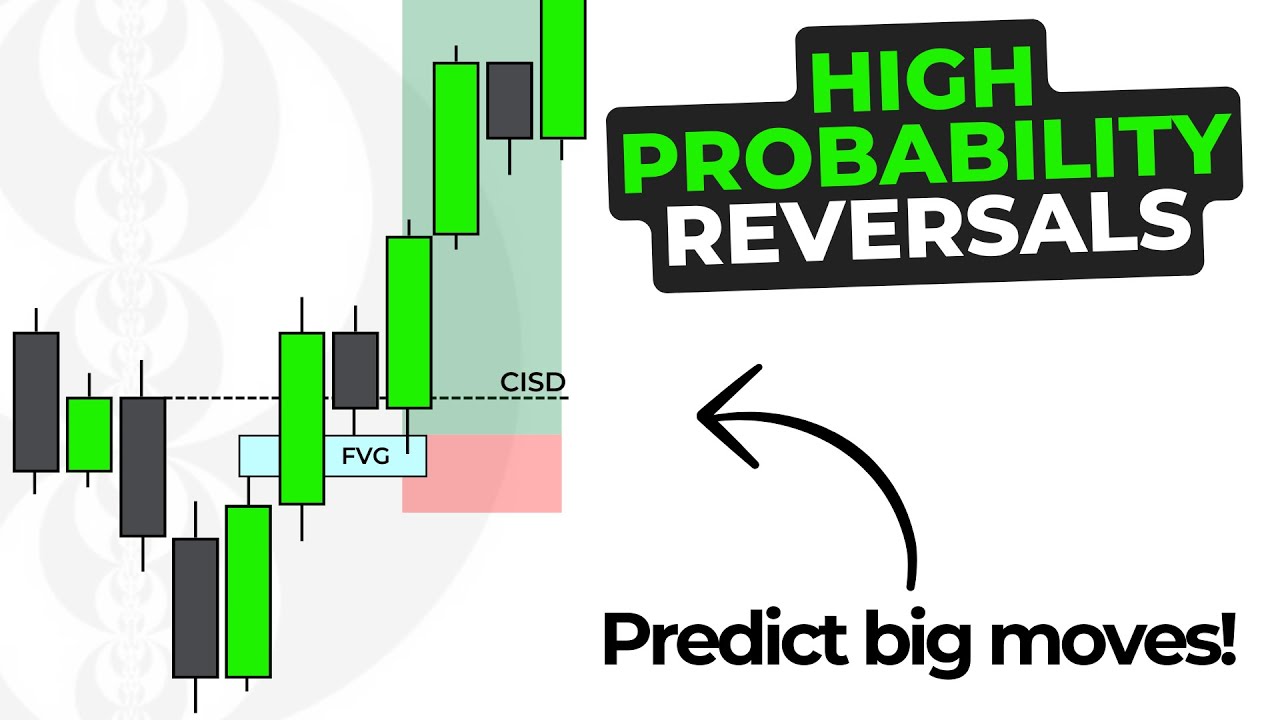
In a few minutes I'll show you how to spot this live on the charts and I'll show you how to use this um in the model that we are going to learn today. Here we have two different variations of change in a set of delivery. Here we can see we've got three down close candles.
Then we've got two up close candles and we have three down close candles that took out liquidity to the left. Now a change in the state of delivery will happen as soon as we close with a body through the opening price of this down close candle. And why why the opening price?
Because that opening price is the start of this bearish move. The high of the candle is not the start of the move. The opening price is the open of this bearish move.
So as soon as we close with a body through that opening price, a change in the state of delivery has occurred. And in this example, we can see that here we had multiple candles. Here we have one candle and it is the same principle.
So we can see we have a liquidity sweep to the left and we have one opening price, a down close candle that took out liquidity. So as soon as we close through the opening price of this bearish candle, that is my bullish change in the state of delivery and that is just vers inversed for a bearish example where we have multiple uplose candles. We are going to look for the opening price of the candle series that started that move.
As soon as we close through that with a body, a bearish CISD has taken place. But I'll show you in the charts an easy way to spot the correct change in a state of delivery very quickly. So now that we have spoken about kill timings, we have spoken about change in a state of delivery.
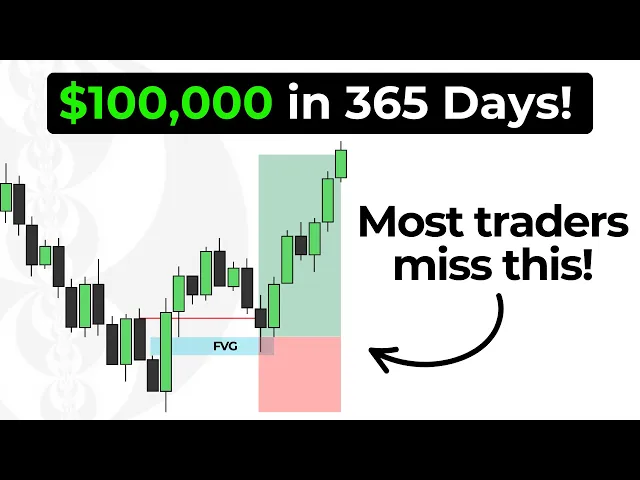
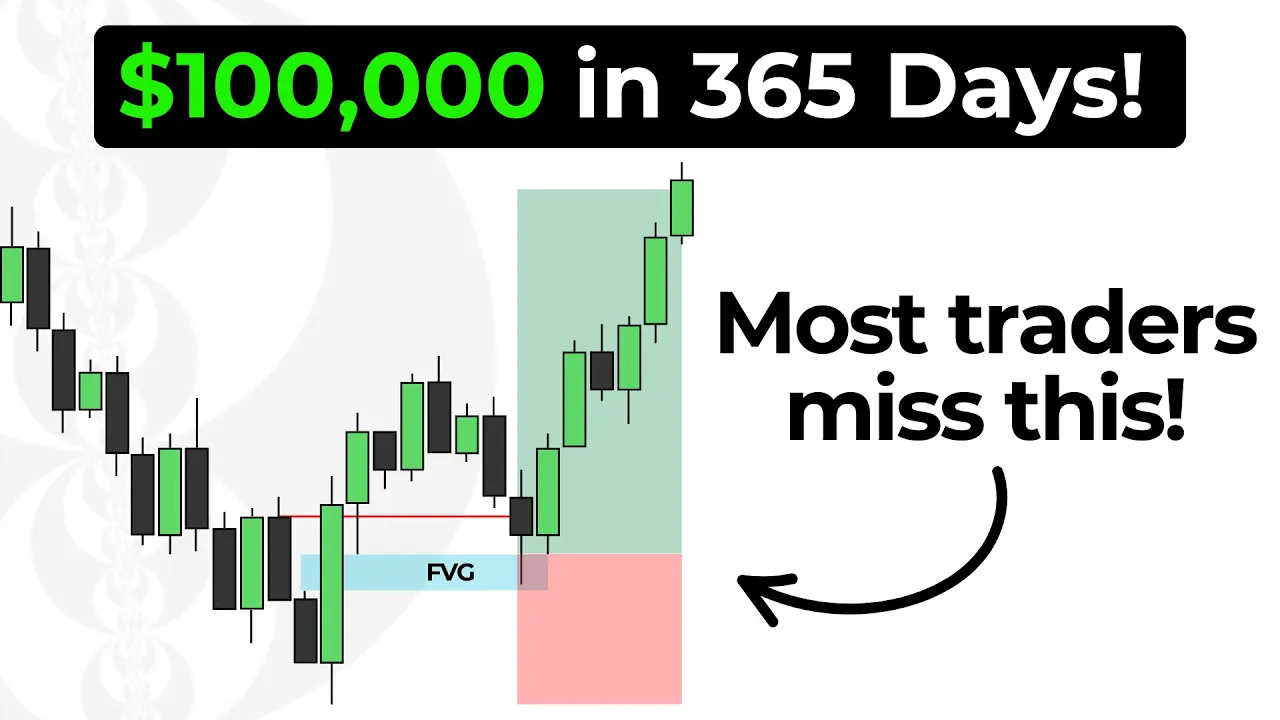
Now the last piece of the puzzle is a fair value gap. Now I'm pretty sure all of we all of us knows what a fair value gap is. But in case you don't, a fair value gap is simply a gap or imbalance on the chart where price moved too quickly without enough buyers and sellers trading fairly between them.
It usually happens when there's a strong move in one direction, leaving a space between candles. And smart money often comes back to fill that gap before continuing the move. Traders use fair value gaps as high probability areas to look for entries because price often return to these gaps to rebalance the market.
In a second I'll show you exactly how to spot them and how to use them to your advantage. So here I've drawn out a fair value gap, bearish gap, and here we have a bullish gap. It is a three candle pattern where we see the low of the first candle does not touch the high of the third candle leaving this green shaded gap in price.
We are going to use fair value gaps today in this model to take our entries from. So we're going to wait for price action to revisit that gap and then we can use that as an entry position. So let's talk about market environment.
The best market environment for this model is a consolidating or ranging market. So if we open our chart and we can see Asia kill zone has been consolidating or ranging that is ideal for this model. If you open your chart and you can see London and Asia is trending aggressively that is not ideal.
We don't want to see strong impulse moves in price. We want to see indecision in the market. That is exactly when we can use this model to catch that winning trade.
Now we are going to talk about how do you actually put all the different elements together to actually form a trading model. Firstly, we are going to mark out London kill zone. So we are going to go from 2:00 a.
m. to 5:00 a. m.
and we're going to mark out the high and the low. So we have let's say we have London kill zone. We're going to mark out the highest point and we're going to mark out the lowest point of London.
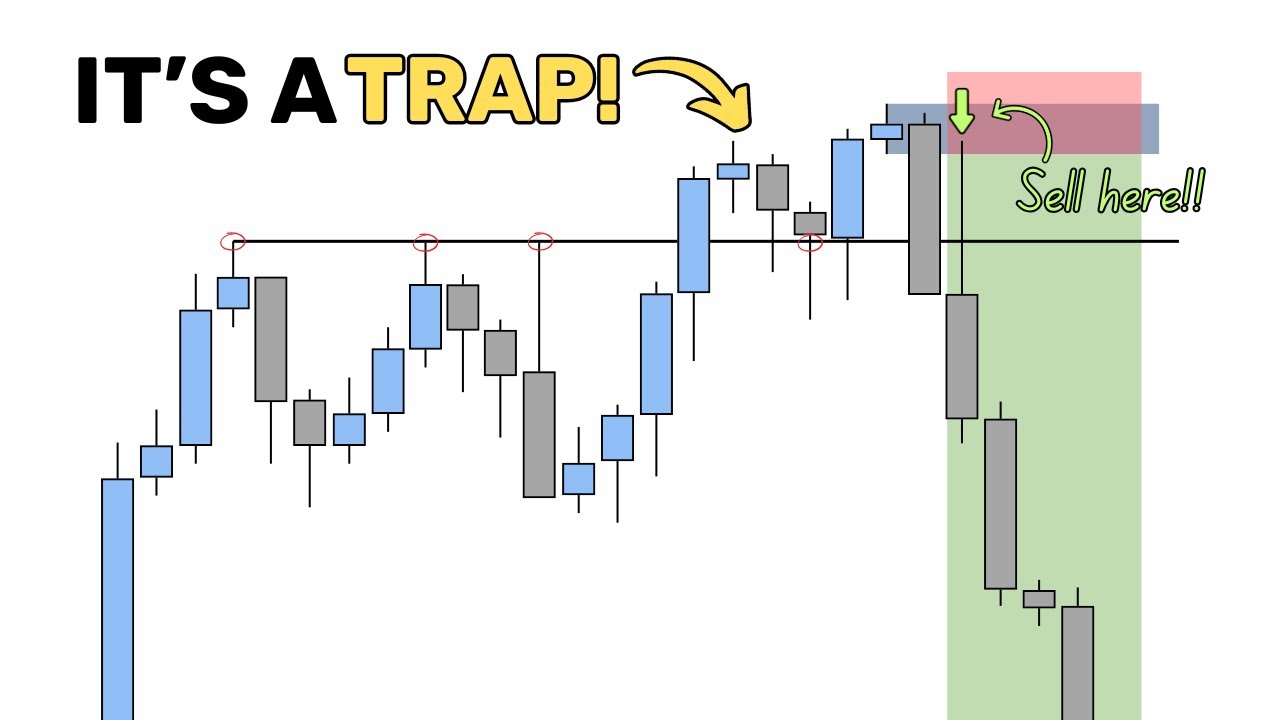
Then we are going to wait for New York kill zone to start and this is done on the 15minut time frame that you're going to mark out the high and the low. Now we're going to wait for New York Killzone to start and we're going to wait for a liquidity sweep of the high or a liquidity sweep of the low. That is what we're going to wait for of London high and London low.
As soon as we get that sweep of a high, we are going to wait for our change in the state of delivery to take place on the one minute time frame. I'm going to share a trading checklist at the end of the video for this strategy so that you can be sure you're trading it correctly. We're going to wait for a change instead of delivery on the 1 minute time frame and then as soon as that happens, we're going to look for the most extreme fair value gap and that is going to be our entry.
So marking this out clearly. Here we have London high and over here we have London low. So New York session starts and we're going to wait for a sweep of the low or the high.
wait for that bullish or bearish change in the state of delivery and then we're going to spot out the most extreme fair value gap and that is where we are going to take our entry stops will be covering the closest swing low. So in this example the closest swing low will be this low. So our stops will be here and we're going to target 2 R.
So in the first example I'm going to show you an example of a trade that happened today at the time of shooting this video. So, I'm showing you a strategy that works in today's market environment, not something that worked 20 years ago. I'm keeping it real and I'm showing you something that works today so that you can go ahead and make money with this immediately.
Now, looking at today's price action, we can see that we have a trending Asia, which is not ideal. But then we go ahead and we look at London Killzone. So, Asia session is my blue box.
London Kelzone is my green box. If you're looking for this indicator, it is called FXN Asian session range. So looking at this box, what do we see?
We see that we have London low and we have London high here. So London low gets taken out over here, but that is not within New York kill zone. New York kill zone only starts at 7 a.
m. So we need a sweep of a low in New York kill zone. Now because London low is very close to a swing low here, we are going to use this swing low because that swing low has already been mitigated.
Now we need a fresh swing low that happened in London or before London. So we have this swing low here. We're going to drag that out and we are going to wait for price action to take out either side.
And we can see on the 15-minute time frame that New York session opens here at 7:00 a. m. And we are going to play this ahead.
And we're going to wait for that low or high to get taken out. Waiting for that low to get swept. We can see it does get swept over here.
I'm going to go back to that candle cuz I did play it fast a little bit. Drpping to the one minute time frame. Then we start on the 50inut to look for those swing lows and highs.
And then we go to the one minute time frame and that is where our trade will happen. We can see that we have this low here. We are going to wait for that low to get taken over here on the 1 minute time frame.
So playing price action ahead and we're just waiting for that sweep of that low. Here we swept that low. So I'm just going to go ahead and drag this line back.
Here we have swept out that liquidity low. We have taken sellside liquidity and at the moment we have a change in a state of delivery that will happen when we close above these three down close candles. In the beginning of the video I shared with you a quick and easy way to spot change instead of deliveries quickly is in a downtrend we are looking for the lowest point of price and then we're looking for the series or single down close candle that made that low.
As soon as we close above the opening price of that get down close candle, that is my change in the state of delivery. So we are waiting for the candle for body closure above that level. So here we have that.
So we have a change in a state of delivery check. Now we need to mark out our most extreme fair value gap and that is over here. So now that we have marked out our change in a state of delivery and we have a valid fair value gap which is the extreme one meaning it's furthest away from price.
That is where we are going to take our entry from. So place our entry at the gap stops covering the closest swing low. At the moment it is going to be this low here and we are going to target 2 R.
When it comes to these trades I don't I'm not a fan of taking 10R trades. I think it's unrealistic. A quick two hour trade, bank your profit, come back the next day is what I love doing.
So, playing price ahead and let's see if we do in fact get an entry when it comes to this trade. We can see here we tap that fair value gap and immediately we start pushing away. So, leaving this as a fixed to our position.
Let's see what happens. And there we go up and we've hit our two R for this day. In this next example, I'm going to share with you a losing trade and I'm going to share with you what you can do to have a higher win rate.
So the previous example was a flat straightforward entry model. Now I'm going to share with you a little bit more advanced technique that you can implement to increase your overall win rate. Remember, no trading strategy has a 100% win rate and you will take losses.
So again, we're on gold on the 15-minute time frame and we have London Killzone here and New York Killzone has just opened. We can see that London Kilzen is sort of in a consolidation, but we do have an overall bearish bias. Looking at this market, what do we see?
We sweep out London low, but that happened outside of kill zone and so that doesn't count. And we get a nice little reversal from that low. Now we are approaching London high, which is this swing point over here.
So firstly, I'm going to share with you the losing trade and then I'm going to share with you the method that you can implement to increase your overall win rate. Now that we have marked out London high, we dropped to the one minute time frame and we can go ahead and we can wait for our entry criteria. So playing price ahead, we can see that we're approaching that line.
We have swept London high. So now what do we have? We're looking for the highest point.
We've got one, two, three up close candles that made that high. As soon as we close through this candle's opening price that becomes my change in the state of delivery. So, we are waiting for a candle body closure below that zone and we are waiting for a fair value gap.
So, here we get everything met. Here we have a valid trade. If we go and we take this trade, let's see what happens.
covering the closest swing high targeting to R. Let's see how this trade plays out. We open, we trade into that gap.
We get a small little reaction, but then ultimately we do run higher and we do get stopped out of this position, which is fine. It is normal just a losing trade. Brush it off, move on.
But now I want to show you a technique that you can use to increase your overall win rate. So, this is something that a lot of traders don't do is they don't show their losses. Now, I'm going to share with you a loss and how to avoid it.
Here we see we have London high as a swing point. What is right above that swing point? We have another draw on liquidity.
We have a swing high here. That was the highest point before we start running down again. So, if we measure out a dealing range from that high to this low, here we have a dealing range.
The start of the dealing rate was at this high. So when we have London high close to another swing high, that's the highest point. Rather use that high.
Here we have London low that isn't close to another swing low. So I'll rather use this low. But if we had a swing low and then London low, I would rather use this swing low.
I hope that makes sense. If it doesn't, ask a question in the comments below and I'll be happy to help. dropping to the one minute time frame again.
We are waiting for that overall high to get taken. That was the start of my dealing range. So playing price ahead, waiting for that to get swept.
We can see that does get swept. So now again we are looking for the highest point of price. The highest point of price action is this candle high here.
We've got 1 2 3 four up close candles that made that high. That is my change in the state of delivery. So we are just waiting for price action to close with a body through this level.
Playing price ahead. What do we get? Does this count as a valid change in state of delivery?
No. We sweep below it. We need a body closure below it.
That would be considered valid. So there we get it. Here we have a valid change in the state of delivery.
Now what do we need? Now we need a fair value gap. The extreme fair value gap.
So we have a fair value gap over here and we have a fair value gap over here. Which one are we going to use? We're going to use the top one.
So this becomes my fair value gap that I'm going to use to take my entry from. Here we place our position and we cover the closest swing point. The closest swing point is not this point.
The closest swing point is this swing high over here. So we are going to cover that swing high with a couple points and we are going to take two R when trading this model playing price action ahead. What do we get?
We get a sweep of that fair value gap. The consequent encroachment is respected and then we start trading lower and we ultimately hit our take profit. So, in this day, we had a losing trade and we had a winning trade.
If you've used the advanced method I've shown you, you would only have one winning trade on this day. Remember, if we have London high or low close to another swing point, rather use that swing point. Guys, I hope you enjoyed today's video.
I hope you found this video helpful. If you did, leave me a comment below, ask a question below, and I'll be happy to help. I am in the process of replying to all the different comments out there.
It has been a little while since I've last posted. I have spent time with family and I have been locked into the members inside of our community. If you are looking to join our community and trade live with me on a daily basis, check out the link in my description.
We are busy building a new website. So, if the link doesn't work, pop me an email and I'll help you through the process.