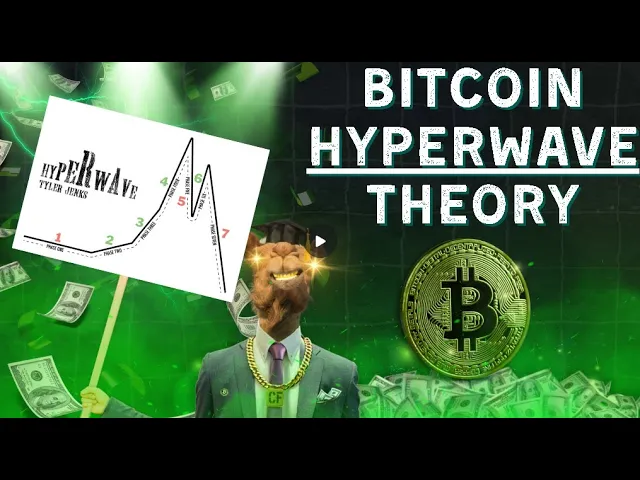
[Music] yeah warning this video and all other videos on this channel for entertainment purposes only the content of this video and all other videos on this channel the opinions of the Creator only and do not constitute legal trading investment or financial advice of any kind investing carries a high level of risk and the majority of retail clients lose money do not invest in capital unless you understand the risk and you are prepared to lose it all all right hello and welcome to camel Finance I'm your boy camel and today I want to talk about CPI inflation briefly and then I'm going to share with you some of my findings on Tyler Jen's hyperwave Theory so hyperwave theory is essentially the three angles of attack that I use except it's a much more refined highly polished and highly specific set of conditions that produce a hyperwave so all hyperwaves are bubbles but not all bubbles or parabolic blowoff tops qualify as hyperwaves so the interesting thing about this is they are incredibly rare Tyler jenss analyzed over 75,000 Assets in the charts of each one of those assets and only found around 400 hyperwave examples so that's how rare they are and the most interesting thing about all of this to me as I'm going to show you in a bit is number one I believe the stock market is currently in a hyperwave okay which is pretty pretty interesting and it also means that we can quantifiably know how to handle the stock market going forward and I also believe Bitcoin is setting up to enter a hyperwave and if it can confirm phase three it gives an 85% probability we will enter phase four so I'm going to show you what all of that means the implications are that nobody is bullish enough this is a very very very specific set of conditions like I said only 400 approximately examples have been found through over 75,000 charts so if if that's what we've got to play number one it means we're going way way way higher than anyone thinks is possible right now and actually the funniest thing of all is it means plan B's model which most people consider a joke would likely become the most accurate if we enter a hyperwave and the other thing it tells us is we have a hard and fast exit system to exit near the top if a hyperwave plays out we also know the path it will take following the breakdown of that fourth angle first of all we've got to touch on CPI okay so I have been long tracking CPI I've been I think amongst one of the best at tracking it and correctly getting the direction of the trend but as of yesterday's print okay this was like I said Color Me surprised okay so this is absolutely not what I was expecting this is absolutely not in line with my expectations of course this could be a counter Trend wobble right it could be but the thing is we have to point out a few facts okay number one we've been expecting on this channel for a long time down sideways and down we certainly started to get that but we've now bounced back up to here okay okay so maybe that's just a counter Trend wobble before we then resume to the downside maybe in which case you know happy days we'll have to continue to track this in real time but the thing there's a few things about this that don't sit right with me first of all we saw massive Divergence in true flation and we've seen massive Divergence like this once before and I was caught offside by true flation once before and that was back in January where we also saw true flation move really really sharply to the downside and then we actually got a hot CPI print come out in January now at the time I gave true inflation the benefit of the doubt because the government had just changed the way the CPI basket was calculated so I said well maybe that's what it is maybe they changed the calculation it threw it all off and to be fair going forward we saw a little bit of a counter Trend bounce a little bit stickier inflation than I had anticipated but we did ultimately resolve the primary Trend and the expectations weren't too far from reality okay we just had one or two wobbly prints and that's okay because like anything okay macro data sets also experience counter Trend wobbles so maybe that's what we're dealing with maybe okay but the thing that's quite concerning to me is this is the current readout for true flation so we've bounced assuming true inflation is not completely wrong okay then we made it all the way down to here and now since then we've been ticking up massively so this is going to make it very very difficult to not see another hot print or sticky print at the next CPI readout of course if we get another sticky print at the next CPI readout having just bounced up here then you know we're probably going to be back up in this kind of neighborhood fairly soon and then that no longer fits with down sideways and down does it so I'm setting up to be invalidated here we need to see a couple more prints I can never just say well there's one sticky print we'll throw the whole thing out the window you know the unfortunate thing about this is we only get one print a month and it's going to take some time right it's going to take some time before we can actually know for sure how wrong I am if I'm wrong at all there is another way to interpret this data and let me be clear I'm not trying to sell you anything you could easily interpret what I'm about to say as confirmation bias or me trying to fit a narrative to fit my expectations okay like I'm not pushing this on you I'm not trying to present anything as fact I'm not trying to sell you on anything I'm just showing you you know one other way of looking at it and then you get to decide whether you agree with me whether it's confirmation bias whether you know whatever you you get to make your own decision on this I'm just showing you another way to look at this but that is if we use realtime metrics for shelter headline inflation drops from 2. 6 which is what of course was reported yesterday down to 1. 3% and now that would not only fit tration readout but it would also fit my expectations now I know there's going to be some people that feel uncomfortable with what I'm saying like I said that's fine I'm not trying to sell you on anything you know if you think I'm this is confirmation bias or fit in data to my narrative that's absolutely your prerogative and your right to believe that it would also drop core inflation from 3.
3 to 1. 76 and official BLS shelter of 4. 9 would come down to about 1.
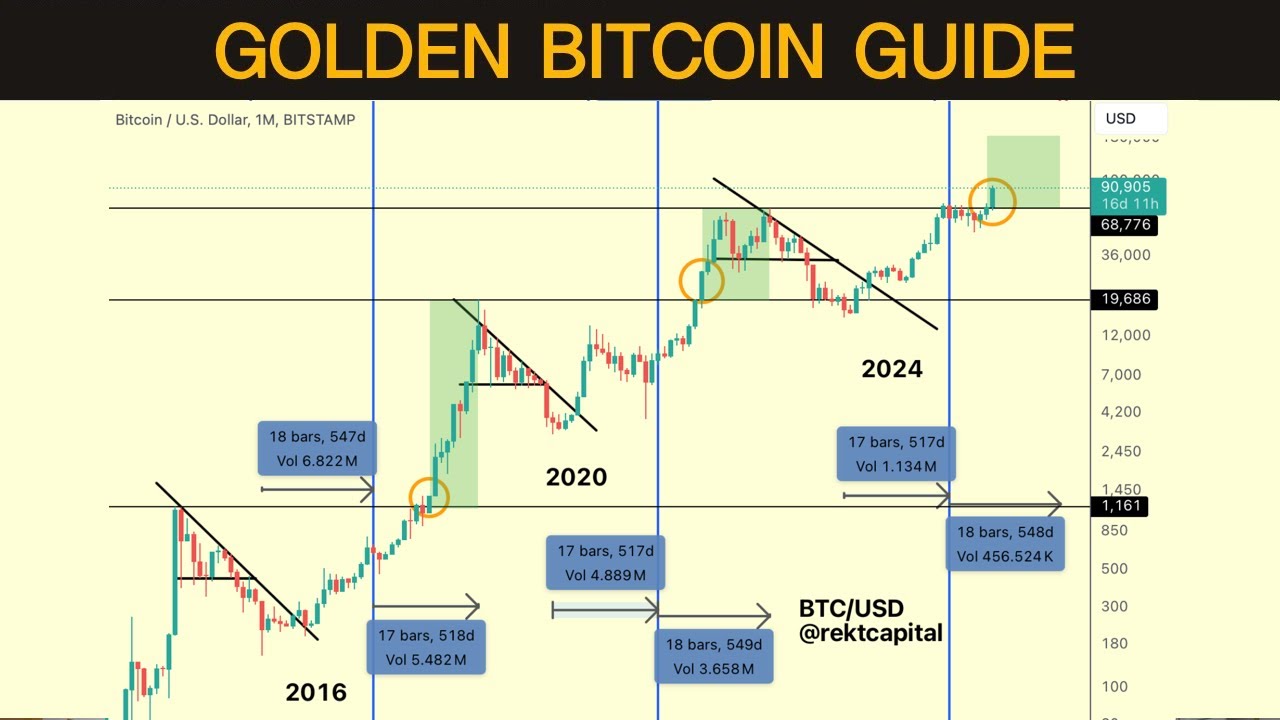
3% which would actually give us negative 0. 4% month over month so we would actually be deflation AR month over month again that number of around 1. 3 fits quite nicely with true flation readout so I do wonder I do wonder if what we've got is a real world CPI print which is of course trending down towards where it's supposed to be and towards expectations and instead the FED just doesn't quite want to let on about this yet so again I'm not trying to convince you of that that when we look at the CME for the rate cut probabilities at December's meeting okay the CME seem to agree with me it doesn't seem to think that inflation is sticky okay because it is not repricing in favor of remaining paused it's not putting hikes on the table if we go to compare one week ago we were down at 60% 66% probability of seeing a 25 basis point cut and following the print okay we've popped up to 83% just under so according to the CME okay they don't think inflation is sticky they don't think the rate cut probabilities are overly restrictive they don't think at all what they think is okay probably this data is not quite right as as it's being presented this is possibly closer to the mark and shelters lagging and causing it and thus we do actually need to see further Cuts so again not trying to sell you you make your own decision there objectively speaking this is not what I expected to see okay but it's not the first time we've had a wobbly print and again unfortunately all we can really do is give it another couple of prints to play out and see if we actually get a true TR Trend change so like I said if this becomes this okay then camel is clearly wrong absolutely but we can't really tell until we get a breakout and a true directional change okay if what we see is something like this one or two prints and then a roll over wholly speaking I don't think I would have been too far wrong so we can't tell until after the fact but it is what it is we will continue to track it in real time I'll continue to try to say as objective as possible so now I want to talk about hyperwave Theory because hyperwave theory is incredibly interesting to me all hyperwaves are bubbles but not all bubbles are hyperwaves like said at the beginning hyperwaves are very very specific in terms of their structure and how they behave if Bitcoin is about to Stage a hyperwave it would probably look something akin to this okay so that would mean third this whole thing I've drawn here this first part of the yellow squiggle would be in line with this fractal okay so a bit more of a push a 60-day cycle low that of course coincides with the uh DT inauguration and then we should in theory if a hyper wave is going to play out move into this fourth angle which would be camel's third and final blowoff top angle and then the implications of hyperwave are that the price will return to at least the stage one base if not move below it now there's an interesting Nuance to this because out of all of the examples they all return at least to the phase one okay all of them except for Bitcoin so I'll show you an example of that in a minute here is the hyperight structure it's very very specific we have a phase one which is a range okay at some point this breaks out and enters around a 45 degree Advance many many many markets will never leave phase two okay they will break down from phase two and then enter phase one again or whatever it's incredibly rare for markets to even enter phase three but what's interesting about phase three is by the time phase three has been established on the weekly time frame there is an 85% probability phase 4 will occur which means if I'm right about Bitcoin entering phase 3 we needless to say have an 85% probability phase four is coming something else that's really interesting to me about these is part of Tyler jens's definitions for hyperwaves right part of his requirements or conditions were that these only occur during major economic shifts we had an example of this in the Japanese stock market the Japanese stock market underwent a hyperwave and it was because something major was happening under the hood that major economic shift for the Japanese stock market to complete a hyper wve was that the Japanese economy was climbing the ranks and on its way to challenge the US economy for being the largest now it ended up falling slightly short of that it ended up only making it to the number two spot by the time it got to this hyper wave but that was a significant and major economic shift that occurred okay we also saw the same thing in gold and silver gold and silver have undergone hyperwaves before and this hyperwave was induced in Gold this is the gold chart right here okay by a massive change in economic conditions so here we get the phase one lead in okay which leads to a breakout what happened right around here in 1971 Nixon took the dollar off of the gold standard we went from having fiat currency that was backed by gold which carries inherent value and is difficult to inflate to having a major economic shift whereby they took the dollar off the gold standard and they can now print infinite amounts infinite units of currency then notice what happens here okay now according to the rules we use the lowest weekly low close to set the trend line for angle two okay then we get an acceleration into angle three okay as you can see right here before ultimately wave four in the hyperwave system is set and we get this huge expansive blowoff top move so the other cool thing about hyperwave theory is we know where to sell okay we sell on a weekly candle close below this fourth blowoff top angle and as you can see we then get phase five a counter Trend bounce which we know will form a lower high it never goes on to produce a higher high and then rolls over which means even if you miss this for some reason okay you can you can have full confidence that a counter Trend bounce is come in to let you out here this is also a very nice area to short the market on a high probability setup and all the while that Weekly trend on the fourth angle is not broken then it keeps you in the trade whereas we can kind of see this now with Bitcoin right everyone's looking at Bitcoin going oh it's extended it's extended it's extended as I'm going to show you in a minute we might only be at the early stages of this phase three okay phase four May well be to come I also wanted to show you a very very nice example with Bitcoin from back in 2017 of a hyperwave okay so we can draw that again big leadin phase phase one which is flat okay then we get a breakout from Phase 1 to phase two as you can see here okay then it accelerates from Phase 2 into phase three and then of course we get the final blowoff top move so this is a very very clean example of a textbook hyperwave once again notice how the wholeway through here everyone was saying this thing's overextended blah blah blah but if you knew the hyperwave structure then you have hard invalidations on the trend line breaks and all the while the trend is not broken you can stay on this thing until all the way up here you could have got out at 17,300 that's when you would have been taken out of the system and you missed the top by a few K okay which is essentially in this game Flawless no one is going to sell the exact top so pretty wild okay and then as I was saying earlier wave four once it completes should ultimately resolve to a sharp sell-off okay we see that here this would be five six and then seven comes down five six and seven comes down now Bitcoin is very unique because it should have been targeting 1K back at this phase one level but for some reason it didn't do it now this is completely unique to bitcoin I have my own theory for this and potentially it's because of the minor flaw price and things like that and the miners defend in the network but outside of Bitcoin okay all of these hyperwaves that break down go through five six and seven and seven always resolves to that phase one level or below it which is pretty cool now I also think when I was playing around with this we're going to see the stock market violate this fourth angle pretty soon okay so I'm going to show you that and then I'm going to show you at the hard right Edge why I believe Bitcoin is currently experiencing a hyperwave of its own and nobody is bullish enough so let's do the stock market first anyone that's familiar with this channel will have seen these three angles of attack this is my own crude version that I kind of just developed from experience in the market and getting sick of watching parabolic moves unfold and either selling too early or selling too late so I figured out pretty early on in my career because I started with penny stocks and lots of those undergo parabolic blowoff tops so by the time I found Bitcoin I had already seen and traded hundreds of parabas before now remember all hyperwaves are parabas but not all parabas are hyperwaves so there's a big distinction here anyway if you like the three angles of attack okay this works for me okay it keeps us on the trend until this eventually breaks and when it does as I've said a million times in my experience it breaks hits the second angle and then breaks again and the first angle becomes the minimum Target now if it's a hyper wve of course that implies we come all the way back down to the leadin phase so let me show you this once more and just why this is so incredible based on everything I've shown you so far so I want to show you this really quickly okay this is the SPX now I don't want to mess up my own ta so I'm going to leave this here but the reason I want to point this out okay is because during this.