Model Studio includes a suite of integrated data mining tools to facilitate end-to-end data mining analysis. Today I'll show you how to create a pipeline to compare models, how to automatically generate an optimal model, and how to compare multiple pipelines. If you have access to Model Studio, I encourage you to follow along with me.
Your environment might already have all the files used in this demo. However, if you don't see them, please visit the Learning Center from your Profile menu. Look for the guide labeled Quick Start Videos to find instructions for loading the demo data and files.
The files are also available on our SAS GitHub site (show URL). To start using Model Studio, select Build Models from the Analytics Life Cycle menu. When you access Model Studio, the Projects page appears with a tile view of projects that have been created already.
Let's start a new project. I'll name this project Example and select the HOME_EQUITY data source. If the data source is not already loaded in memory, make sure you do so now After giving the project a name and selecting a data source, you can select a modeling template or autogenerate a model.
Let's select an advanced template for a class target. Click Advanced to view and modify some of the advanced pipeline settings. By default, the data is divided into training, validation, and test partitions.
Click Save, and click save again The project opens on the Data tab. Next, set up the modeling properties of your data. In this data set, BAD is the target variable.
The software detected that it is a binary variable Notice that, by default, it has a role of Input. Let's change that to Target so that it is used as the target variable in models. You can also select variables to assess for bias in your models.
Let's select one. In this case, I'll select the variable Job to assess for bias. I am also going to reject it from being used as a predictor in the models.
By clicking the Pipeline tab, we can see the pipeline that has been generated for our data. After some pre-processing, the data is trained and validated on six models. An ensemble of the six models is also trained, and all seven resulting models are compared.
You can change settings on any of the nodes in the pipeline or add new nodes to it. Let's run the pipeline. When you check the Model Comparison node, by right-clicking and selecting Results, you can see which model has the best performance, which, in this case, is the gradient boosting model.
In the Assessment window, you can see plots of model performance as well as a table of fit statistics to compare the different models. Click Close to exit the Model Comparison results. You can look at the results for any specific model as well, by right-clicking the node and selecting Results.
Let's look at the Gradient Boosting Model. In the model's results window, you can see variable importance statistics, Error plots, and several useful types of code. The Fairness and Bias tab enables you to check variables for possible bias.
Click Close to exit the results. Let's add another pipeline, and this time, we'll let SAS automate the training and selection. Select Automatically generate the Pipeline, set a time limit, and click Save.
Once your pipeline is built, you can run it just as it is, or you can unlock the pipeline to make additional changes. Let's run this pipeline. The champion model in this case is the Ensemble Finally, we can include pipelines that use models from open source.
Let's use the basic template for a class target and add an Open Source code node. The basic pipeline includes a Data node, an Imputation node, a Logistic Regression node, and a Model Comparison node. Let's add an Open Source code node beneath the Imputation The model scoring code is provided on our sassoftware GitHub site.
Visit the sas-viya-quick-start-videos repository to view Train_HOME_EQUITY. txt and Score_HOME_EQUITY. txt.
Copy the code in the text file, and then return to Model Studio and paste it into the Open Source code node. OPen the code editor to paste your training code into the training code window, and paste your scoring code into the scoring code window. Click Close.
Once we add the model training and scoring code, we can update any setting as needed and then specify the node as a supervised model. In some cases, it might be necessary to disable SAS formats when passing data to the Python code. This is done by expanding Data Sample and un-checking Include SAS Formats.
Finally, right-click to MOVE the node type to Supervised Learning, and the node will connect to the Model Comparison node. When we run this pipeline, it runs the Python code against the data and includes it in the model comparison. (Run Pipeline) Click the Pipeline Comparison tab.
How do the winners from each pipeline compare to each other? The models that are winners from each of our pipelines are compared against one another, using the K-S statistic by default. You can change this selection statistic.
In this case, the ensemble model from our automatically generated pipeline is the Project Champion. The Insights tab generates a natural language summary to help you interpret the results of the pipeline comparison as well as a host of useful assessment graphs. You can also generate a PDF of your project results.
We can register the champion model to deploy it later. In the Pipeline Comparison tab, right-click the champion and then select Register model. Click Close.
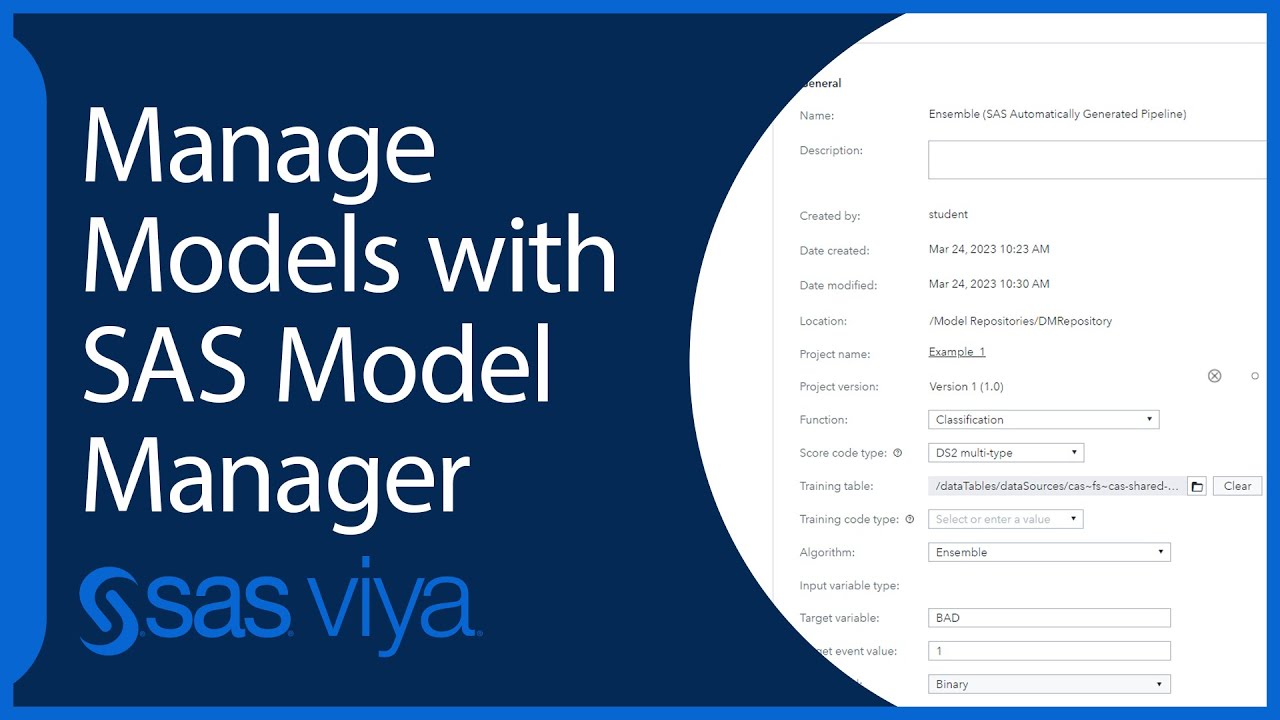
The model is registered in SAS Model Manager You can open SAS Model Manager by going to the menu and selecting Manage models. There you'll see a list of your previously registered models, as well as the model that you just registered. Now it's your turn to explore Model Studio and see what you can do.