Are you actually a price action trader, or do you just know how to read concepts? Because there's a big difference between the two. I would argue most here would call themselves a price action trader. Yet, if you open the charts without any concepts, without any labels, would you be able to understand what price is actually doing? Now, odds are, even if you try to do so, you have formed a habit of automatically Spotting concepts like fair value gap here, like an order block right there. So, my question to you again is, do you actually know
how to read price action for what it is? Or have you just been trained to spot concepts? In this video, I'm going to show you the difference and why it is so important. We're going to dive into how to actually read price action. Now, first of all, why is this so important to start off with? Why is this such a Big deal? Well, with concepts, you can only trade what you have been taught to see. So, again, I'm not here to bash concepts. I'm going to explain this a little bit deeper as well later on.
But, if you only know how to spot certain concepts, you're quite limited in what you can do, if that makes sense. So, often times, then the solution becomes adding more and more and more concepts to make up for those limitations. But, when you really think about it, do you Need to know that this is a fair value gap if we are likely to continue lower? All things we're going to dive into. Now, if we continue right here, then what's also important is you get more control over any market condition. So, if we start to consolidate,
if we go back from a consolidation to a trending market again, you can spot that without needing to understand concepts. So, I need you to understand how significant this actually is, because you could Argue that the approach we're going to dive into is essentially trading without any concepts. And even though it's trading without any concepts, you're still going to understand every concept that is out there, because it encapsulates everything. And we're going to dive into that in just a second. So, again, ask yourself, can you actually drive a car, or do you just know the
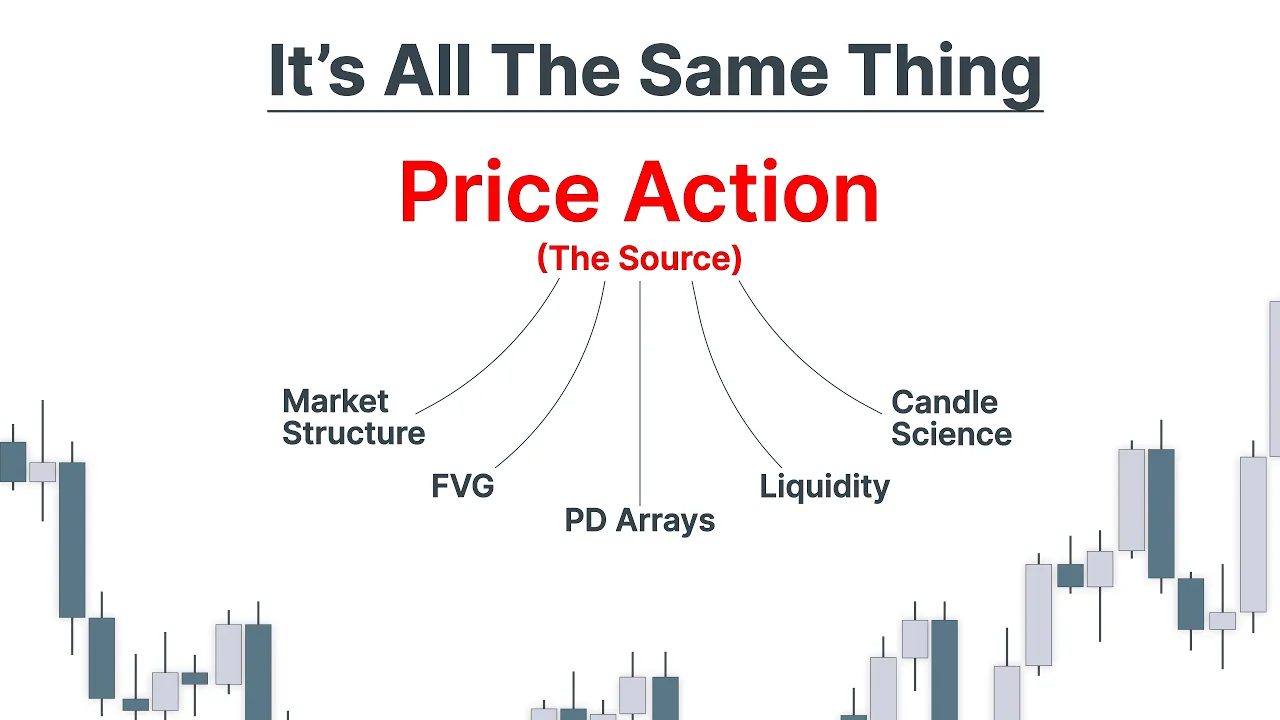
theory? Okay, so what do I actually mean? What are we talking about? So, to Fully sketch this idea right here, I want you to maybe write down even for yourself every concept that you have ever been taught. And write that down right here. Because most likely every concept that you have ever been taught is just based on price action. That's the source. Again, when I refer to price action, I refer to the charts, these candlesticks, right? This is price action. This is what we call price action. Now now every concept that you Can think of
is created based on that price action right there. So for example, right here. We can see that price action is the source and based on that for example, basic support and resistance is created with basic support and resistance levels. On top of that, we take a little bit further, we have trend lines right there that are also created from or based off of price action. Then we also have, if we go more and more advanced or these seemingly More advanced, market structure. Market structure is also based on price action, swing highs, swing lows. If we
go further, then we have for example fair value gaps. So all of the SMC, ICT space, anything that you think about is just purely based on price action. Right? We understand that those concepts are created based on price action. Now you might have a rational story behind it, but the reality is it's based on price action. So if we move on right here, then PD arrays, for example, they're also based on price action. Then we see right here, we have liquidity sweeps. These are also based on price action. Or for example, candle reading right here.
So for example, a doji candle or those different types of candles, it's all based on price action. Because it's all based on what you are seeing right here with those candlesticks. That's it. So think about what the source is. The Source is those candlesticks. That's price action. Now I've named a couple of technical analysis concepts right here, but think of every concept that you have ever learned, that you have ever been taught. Every concept falls under this. It's all based on price action. That is the source. Now why is this important and why is this
so extremely significant in my opinion without trying to be over dramatic. The reason for that is if you know how to read price action and you know how to read the source, then every single concept out there is already yours because again, if we go back a little bit right here, price action creates all these different concepts. So, if you know how to read price action, you know how to read support and resistance, trend lines, market structure, fair value gap, PD arrays, liquidity sweep, candle reading, everything, inverse fair Value gap, but anything that you can
think of because you understand how to read price action as a whole. So, price action somewhat encapsulates all these different concepts because everything comes and everything is based off of price action. It's the source. So, then the question becomes, well, how do we read price action? Because of course, that sounds quite vague. Okay. Well, reading price action is reading the intent of the market. What is it trying to tell you? Because the market, if you remove all labels, if you remove all concepts, it is literally just trying to tell you something. But most refer automatically,
like I mentioned, it's a habit that they created and I also have that habit. I automatically start spotting, for example, fair value gaps. But if you remove that for a second, then what is it just inherently trying to tell you? What is a bearish fair value gap? It's Bearish momentum, right? It's just bearish intent. So, let's break that down a little bit further. Okay, number one right here, the intent. So, what is this intent? What are we trying to read essentially? Okay. Well, there are three intent options, right? And this is very basic. We're first
going to lay out all the different possibilities and then we're going to see how we can spot the different possibilities that are playing out. So, what do I mean by that? Well, Again, the three intent options. So, at any moment in time, what can the market do? Well, number one, it can continue higher. So, it can potentially be bullish right there. Quite straight forward, right? Number two, what is the second option? Well, you guessed it, we can continue lower. We can be bearish. And again, this is super basic, right? But this is important to understand
because if you understand these possibilities, then you understand what The market is trying to tell you because you understand, okay, which one of these possibilities is the market currently trying to show me what it's doing. And these are all the three things that the market can ever do, right? So we have the third option right here. Okay, and that is a consolidation. So we're not going higher, we're not going lower, we are consolidating. So either we go higher in the market or we go lower or we don't go anywhere. We're not going Higher, we're not
going lower, and we are consolidating. Those are the three possibilities of what the market can do. It is our job to try and read which one of these is the market trying to do next. Because if you understand it's going higher, if you understand it's going lower, you can profit from that, right? Okay, moving on right here. Then most used concepts to try and read the intent. So the concepts are like a simplification. Now, I thought of a Beautiful analogy, very reliable in my opinion. It's like asking AI or ChatGPT or anything like that to
summarize a book instead of reading it. A summary is not necessarily that bad, especially as a reminder. But when you ask, for example, an AI to summarize a book for you, you don't actually ingrain the information. There's actually studies behind this as well if you fully want to dive into it. You don't actually take in the information. If you read the full Book, you understand the full thought process, you have the full context. So if you have read the book, you have all the information, all the relevant context, and you need to compete against someone
in, I don't know, a speech about the book, and that person only read a summary, who do you think is going to do better? The person that understands the whole book. So I do want you to understand, I'm not here trying to bash concepts, not at all. That's not my Intention because later on we're also going to show you how to combine the concepts with what we're talking about right here. Because I need you to understand, concepts, they open the door to reading price action. It's like the introduction to see intent. Again, I also wouldn't
be able to do to read that intent like I do right now and read price action for what it is if I didn't get introduced to certain concepts. So, it's again, it's like the introduction, It opens the door. So, how does it open the door? Well, for example, some examples right here. Fair value gaps. What do they actually inherently tell you? Well, and again, you don't need to understand these concepts, right? You can take any concepts that you use, you don't need to understand these concepts right here. But, a fair value gap inherently just tells
you momentum, it tells you intent, right? So, for example, if we create this bearish fair Value gap, but we have a couple of more bearish fair value gaps right here. We have a bearish fair value gap right there. Fair value gap right there as well. We have a bearish fair value gap right there. A lot of bearish fair value gaps. Inherently, what are they telling you? And this is all I always mention this as well, because someone that doesn't know about fair value gaps can still read a fair value gap, right? Because anyone who doesn't
know about Fair value gaps can still see there's a lot of bearish momentum right here. There's a lot of intent that we want to move lower. So, the concepts right here are inherently trying to tell you one of the three intents. And a bearish fair value gap just tells you, well, it's more likely that we are going to continue lower. Again, it's a simplification. And we have more examples. For example, candle reading or I refer to this as candle science as Well. You might understand these doji candles, those candles with those long wicks, etc. What
inherently is that trying to tell you? Well, the same thing, intent, momentum. So, for example, right here, when we create this long wick at the top right there, we know that as for example, well, on lower time frame it might be fair value gaps right there to continue lower right there. Inherently, what is it just trying to tell you? It is just intent. It shows you that we tried to continue higher, failed to do so, and we're continuing lower again. But, you don't need to understand that it's a doji candle or anything like that to
understand what the intent is. Or for example, order blocks. Again, what do order blocks tell you? Well, no surprise, they also tell you the intent. Or for example, a liquidity sweep versus a run. What does that tell you? Intent. The same thing. Stronger move in favor Or not. When you really think about a liquidity sweep versus a run. Again, if I just draw on the chart, let's say we have this low right here that we are trying to well, potentially run or sweep right there. If we run it, it simply says that we It simply
tells you that we are more bearish than we are bullish. There's more bearish intent because we completely blow by essentially that swing low. If we are sweeping it and we have a Liquidity sweep, what does it tell you? Well, we're not that bearish because we sweep below the low and we potentially continue higher. So, there's more bullish intent. It's all intent. Now again, this is going to become a whole lot more clear once you understand what this intent actually means. Okay. So, the concepts, the usual concepts, they all try and tell you one of the
three intent options, right? So, what does a bullish fair value gap try to tell you? Well, for example, right here. It tries to tell you that we might continue higher right there. So, many use concepts to read the intent. It's again, that simplification. So, a fair value gap, they they read fair value gap to try and tell them, do we want to continue higher or do we want to, for example, continue lower right there? Or they might use order blocks instead of that. Or they might use liquidity to read that intent. But all of those
Concepts and any concept that you can really think about, all it tells you is one of these three intent options. So, if we sweep a swing low, then what does it inherently tell you? Well, that we might be bullish, we might continue higher. So, all the concepts are designed to tell you one of the three intent options. But the thing is right here or for example, a consolidation right there, you might use fair value gaps to recognize that we are in a Consolidation right there. But inherently, you don't need the concepts to tell you that
if you know how to read the intent for what it is. If you know how to read the intent itself. So, then how do we actually do that? Well, number two, let's dive into it. So, how do we start reading this intent? What even is this intent? Again, it's still a little bit vague. Okay, I understand. Let's move on. For me, intent, uh this all comes down to Momentum. That's the way I like to refer to it. And you might not be familiar with momentum, but momentum is arguably the basics. But the basics are already
quite advanced. This is the most beautiful thing of trading where if you simplify something, you can oftentimes encapsulate every advanced metric that you might understand or every advanced concept etc. So if we go back a little bit to the basics right here, then what is momentum? A trends without any Labels. So forget about fair value gaps, forget about all these different concepts for a moment. I know it's to do but try and do it. Well, when we move higher right here, then inherently what are we doing? Right? You might say it when we move higher,
well, we have a bullish fair value gap right here. We might have a bullish fair value gap right there. So that shows us that we are moving higher. In the retracements, we don't have a bearish fair value gap. So again, it shows us that we are moving higher. Forget about that for a second. Inherently, what is this? A trends. Well, it just means right here that for example, the move higher that we see might be 10 points. Just an example. But the move lower, the retracements and because the move lower is only we see three
points right there, that's why we call the retracement. So when we are bullish, when we are moving higher, Inherently what is it? Well, the moves higher are larger than the moves lower. That's it, right? That's it. And you see this everywhere, right? Without looking at any labels right here, if you just take price action for what it is, why are we continuing higher? Well, we are continuing higher because this move right here is, let's say, 7,500. The bearish move right there is, what is that? 3,300. So the bullish moves are Larger than the bearish moves.
That's why the bearish moves are called retracements at that moment in time because they are smaller than the bullish moves right there. So that allows us to continue higher. Again, it's very basic, right? Because if everyone draws a trend, is it something like this? We have a large move in our favor, smaller retracement, large move higher again, smaller retracement, and that creates that bullish trend. The Reason why it is important is what we're going to dive into just a second. But again, if we then go over that bearish trend, it's basically the same thing, right?
Because right here, we see that the bearish moves are simply larger. So, for example, 10 points right there, and we see the bullish moves right there are smaller. So, for example, three points right there. And that allows price to move lower because the momentum at that moment of time is more bearish than it Is bullish. And in the first one right here, we take a look at the bullish trend again, then the momentum is more bullish than it is bearish. That's inherently what it comes down to. Order number three right here, what if we are
consolidating? Then how do we actually look at that? Well, a consolidation right here, what does that mean? Well, if we take a look at this move right higher, then we might be moving five points higher right there. But we are Consolidating because we see that the move lower right there is also equal, and it's also five points. So, if we are moving higher by five points, and we're moving lower by five points, so the bullish move higher gets equaled, gets matched essentially with the same amount of bearish momentum, then we are consolidating. We're not going
anywhere. Why is that? Because one side is not stronger than the other side. And again, this is very basic, right? If we are Moving higher right there, that means the bearish side is simply weaker. So, the bearish moves are smaller, the bullish moves are larger. So, we create a bullish trend. That's it. The moment we start consolidating right here, that's because when we move higher right here, the bullish side was still stronger. So, the bullish momentum was stronger. Now, the bearish momentum, so the bearish legs, start to equal the size of the bullish ones right
there. So, where we have an equal amount of strength on the bullish side and the bearish side. When that's the case, we're not going anywhere, right? Because then we are just consolidating right there because no side is strong enough to actually make a significant push. Now, eventually that might change right here. Here, the bearish side starts to create larger moves, the bullish side creates smaller moves. So, what is happening? Well, we are moving lower Because the moves lower are simply larger than the moves higher. It's so simple. That's it. And if you just look at
it like that, it's so logical that we are moving lower, right? You don't need a concept to tell you you can just believe your own eyes. That's the thing I'm trying to tell you. You can just believe your own eyes. You don't need to rely on someone else to tell you a certain concept to tell you, "Yes, we are bearish because we have a bearish For value gap right there." No. We are bearish because we are simply moving lower more than we are moving higher. I can see that for myself. My 4-year-old nephew could sit
here and say, "Well, what do you think we are likely going to do?" Well, we have been moving lower more, so we are probably going to continue lower. Okay, thank you. And again, I'm being a bit silly, but that is the point I'm trying to make. And this is going to Become a little bit more advanced, but first, you need to understand the basics right here of intent, which is essentially more momentum, because then you can start reading it in singular candles, etc. And replacing essentially all the concepts that you know about. Okay, moving on
by here. So, intent is just reading the momentum. That is what it comes down to. That is also what we are going to dive into deeper. All right, so how does that actually work? Let's go over a couple of examples, because again, of course, right now is quite vague like how does that replace all the concepts that we know? I know. I was I'm I'm being a little bit silly, but I'm trying to get the point across by here. Moving on. Intent examples by here. Okay, if you take a look at this candle by here,
then inherently, what is it trying to tell you? If you just read it for what it is, without any without any Try to remove anything from your mind, if you just read it for what it is. Well, an up candle, what does an up candle mean right there? Well, price is trying to continue higher, right? That's inherently what it's doing. Okay, if we then create this candle right there, then what is happening right here? Well, price tried to continue higher. Why, right? If if and I the The I like to see this, if you for
example have an up candle like this or you have that Second candle that we talked about right there, where is this wick right here? That long wick at the top at the at the top right there. The way I like to see this is just think of it as a trend, as a trend underneath a candle. So for example, this candle right here all the way on the left, that is essentially just a move higher like this, right? This candle, what is happening in this candle right here? When it's creating That long wick at the
top, what is happening? What first started to continue higher was So it was essentially the same thing as this first one, that first move, but then afterward what what it did is it continued lower again right there. So this one tried to continue higher and now creates a retracement. This one tried to continue higher and is succeeding essentially. So that's the difference between those candles. So for example, if we take a Look right here at this candle, this up candle, what is it inherently telling you? Well, like we went over, this is continuing higher, creates
that wick and continues lower again. So this creates that close, right? Then afterwards we have this down candle. So that means that we are following through to continue lower like this. So that means we are moving higher, we are essentially failing and we continue lower again. That's what it's trying to tell you Inherently and that comes down a lot to momentum, the intent. So if we move on with a couple bearish examples again, just invert this, then what is this trying to tell you? Well, price is trying to continue lower. What is this trying to
tell you? When we have a long wick at the bottom, well, price was trying to continue lower, but it arguably is somewhat failing right there. So price tried to continue lower with that bottom wick. That's what we're Seeing. Now how inherently is this useful because what kind of momentum can you actually see right here? Well, for example, if we take a look at this long wick right here, again, we understand what is what is it doing? Well, price tried to continue higher. So what that inherently tells you is that the bullish momentum is weakening, right?
It's getting weaker. If you compare this candle right here to an up candle, just this up candle right here on the left, Then this is where we have more bullish momentum, right? When we create this wick, we are creating a retracement. So, the bullish momentum is inherently a little bit weaker than what we saw, relatively seen to that just that up candle right there. So, right here, this is where the bullish momentum is inherently getting weaker. So, same for the bearish one right there. Again, when we create a long wick at the bottom, what is
it trying to tell You? Well, first, again, imagine how that candle was forming, right? That candle opened right here. Then it continued lower right there, all the way towards that low right there, towards that bottom. That's That was the full down candle that we had. Then it retraced all the way back to the top, and then it created a wick. And again, you probably understand that, but if if sometimes it's just the basics that allow you to understand the advanced Things. Because right here, that tells you that we first tried to continue lower. We failed
to do so, at least in the short term right here, and now we are continuing higher. So, price tried to continue lower. We see the bearish momentum is weakening, it's getting weaker at that moment in time. So, if we move on to the next one, then what could this potentially tell us? But, what if this happens right here? We try to continue higher, and instead we continue Lower right there. Now, you might see that as for example, on this channel I talk a lot about candle signs as well, you might see it through that or
candle reading. This was a doji candle, we can expect that. But, inherently, what is that? Just take it for what it is. It's just momentum. That's it. It's just intent. It's just trying to tell you something. So, right here, the bullish momentum has failed. We can potentially continue lower. Now, it doesn't Automatically mean that there will be a reversal, which we're going to dive into in just a second as well. Here, for example, we tried to continue lower right there. Okay, now we continue higher. Right there. So, we tried to continue lower, and now we
are continuing higher. That's what the momentum tells us. So, I'm going to go over a couple of more examples right here. But, again, the bearish momentum essentially failed Right there. This is similar to what we are seeing, for example, with this candle, right? So, we tried to continue higher, a long wick, and then we continue lower. And again, imagine it that underneath you're just looking at that trend right there. So, we're just looking at something like this, right? And we're just following what the momentum is trying to tell us. So, here we see well that
we create more bearish momentum right there. Try to Continue higher again with this up candle right there. Well, it's not up candle, but we close higher right there. And then we continue lower again. So, inherently what is happening within these candles well something like this. We try to continue higher. But to do so, we try to continue higher again, create a retracement to then continue lower again. That's inherently what's happening, right? On the lower time, that's just momentum. Now, does This right here, does this these examples, does this automatically mean it's a reversal? No, not
necessarily. Because right here, when we try to continue higher and we create for example a long wick at the at the top right there. And we then continue lower. This for all we know could just be a retracement right here and we could still continue higher. Because what does this tell you? What it it tells you it tried to continue higher. Now, it tried To continue lower. We don't know if it will actually be confirmed. This is something I want to dive into a little bit more advanced later on this video as well. This is
mainly evidence-based decision-making that we're going to talk about. But right here, for example, now we see this candle. And you don't see a bearish fair value gap or anything like that. You don't see a market structure shift, but inherently does that tell you it's reversing? Yes, it does. Because Right there, what is happening on the lower time frame? We tried to continue higher. We then continued lower. So, we're trying to continue lower. We then try to continue higher again and failed. So, twice right here we tried to continue higher and failed to do so. And
instead we are continuing lower again. So, inherently what that tells you is that we are creating a reversal. This is for example, how you can confirm a reversal right there where the bullish Momentum keeps failing. But you don't necessarily see it as a bearish fair value gap or you see it as a market structure shift or anything like that. And when you really take a second to think of it, then this arguably takes into account every concept that you might know you're arguably out of the curve because you see it coming before your concept, your
market structure, your bearish divergence might see it coming even. Because right here, for Example, we see that we have been consuming higher, right? So, the bullish momentum is quite strong. Now, at some point, we create this long wick right there at the top. What does it tell you? Well, that tells you something like this is happening, right? We try to continue higher, we create this retracement right there. And then with this down candle that we see afterwards, we create even a further retracement like this. Then we create some more up candles right [snorts] here. Some
more up candles right there. Now, those up candles, they all and even down candles afterwards, they have long wicks at the top. So, what is happening right here? It's It's keeps trying It's trying to push higher right there. And if the bullish momentum was truly that strong, wouldn't you agree with me that we should have pushed higher right there and we shouldn't have created those long Wicks? Because it would have just been an up candle, right? It would have just been a solid up candle look right there because then that tells us that the bullish
momentum is very strong. So, right here, we instead create those wicks and we keep we keep continuing lower right there to continue lower. Now, this eventually leads to this large drop-off, but if you read it for what it is, then we see a long wick. The bullish momentum is getting weaker. We create More bearish momentum. That's why we even created a retracement in the first place. Again, we need bearish momentum in order to create a retracement, right? So, momentum is never binary. It might be 80% bullish, might be 70% bullish, might be 60% bullish, for
example. It's never just we are we are we are bullish. It never says, "No, there's always a certain degree that we are bearish." Because the bearishness creates those retracements right there. Now, if the Bearishness starts to overtake, so what we see right here is we might be very bullish right there. If the bearishness becomes stronger and stronger right there, where we might be going from 80% bullish right there, 20% bearish, that 20% creates the retracement. Now, we instead switch that and we turn 80% bearish right there and 20% bullish, then we are just dropping off
heavily, right? So, that momentum shifts, that intent shifts. In the example I just Showed you, I know I mentioned a lot about percentages and we're not always just bullish or bearish. I want to make this very clear through a scoreboard, so the momentum scoreboard. This is the way I see it. What is important to understand is that the market going higher or lower is always a battle between bullish and bearish. So, for example here, I have a momentum scoreboard where we might be 50% bullish, we might be 50% bearish at that Moment of time. If
we are 50/50, then inherently we're not going anywhere, right? So, one side needs to be stronger. But because one side is not is stronger doesn't mean the other side doesn't exist. So, what do I mean by that? Well, for example here, I'm going to draw a line higher right there. That might mean we might be 100% bullish, but because we created a retracement, we might be 20 4% bearish and 76% bullish. Again, these are just random numbers, It's just to get the idea across. So, if we now continue higher right here, it doesn't mean we
are just bullish. It's not binary, if that makes sense. So, we might be 83% bullish right there, 17% bearish. So, because we are also a little bit bearish, that creates the retracement. But then what happens is, for example, something like this. We continue higher still, then we create a large retracement like this. Now all of a Sudden, we get closer to 50/50. So, the bearish side, that bearish momentum starts to get stronger, if you will. So, here, if we now create, for example, these smaller up movements right there, and that's followed by these larger down
moves, then inherently what's happening, well, the bearish side here is getting stronger right there and is overtaking. So, now we switch it around, if that makes sense. And that is essentially what I am trying to tell you through Those percentages as well. I hope this momentum scoreboard makes that a bit more clear. So, what we're seeing right here, long wick at the top, we create a retracement right there. We try to continue higher a couple of times. We failed to do so. We keep creating those long wicks. We try to continue higher, but we failed
to do so. This tells you the bullish momentum is weaker and at this moment in time the bearish momentum is getting stronger. So, Instead what we're seeing is we are going to drop off right there. We are going to get a retracement. Now, I'm going to have some live examples of this later on. It is not just all hindsight, etc., etc. And it's And the moment we then drop off right here, we create those large down candles. Okay, a lot of bearish momentum. Here we then create an up candle right there. So, we try to
continue higher again, but we failed to do so right There. And then we continue lower again. And these targets right there become a target. And to really drive that point home, you might be waiting at this moment in time for a retracement back into, for example, this fair value gap right there. And I used to be the same. But if you really think of it as momentum and intent and you remove the the concept again. And the concept at that moment in time might be a Limitation to what you are seeing. And if we are
truly that bearish, and as you said, what should happen? If we are truly that bearish, what should happen? Well, if we are truly that bearish, we shouldn't even create a retracement back into the fair value gap in the first place, right? Because if we are truly that bearish, we will just keep dropping off and we will just keep continuing lower. So, for a bullish reversal, for example, right here, we see that we have A long wick at the bottom right there. So, we try to continue lower, we failed to do so. Now, we continue higher
right there with an up candle. Does not mean that we're automatically reversing right here. If we now try to continue lower again and we failed to do so again, that tells us that we do have a potential reversal right there. Because this is where the bearish momentum keeps failing essentially and we keep continuing higher. So, a very Nice example of this is, for example, right here. If we try to continue lower right there and we succeed, then we create a long wick at the bottom right there. Now, we try to continue higher. Of course, doesn't
automatically mean that we now explode higher or anything like that. But we try to continue lower again, we create long weeks at the bottom and we fail. So now we start to continue higher again right there. That right there is where of course the Bullish momentum is getting stronger than the bearish momentum, so we are turning that around if that makes sense. So we're getting into the more advanced material right now. I know it's quite a lot to take in especially if you have been used to the concepts right there because you can you can't
stop yourself from automatically spotting those concepts etc. and making a story based on that. But if you do anything right here, even using concepts, what's Important to understand is that for myself I'm a big relier on and a big believer in evidence-based decision-making, EBDM. Again, it speaks for itself, but based on the evidence that you have in the chart, based on that I like to make a decision. So now I want to dive into a certain a couple of frameworks that will clear this up a lot more in my opinion. Okay. So we have tested
versus non-tested Move. And actually the funny thing right here is that if you go to the to to to Wednesday's video, when was that? That was the 25th of March, I uploaded the video about Nasdaq right here. And I mentioned that oftentimes when you create these moves right here, when we create large up moves like this or we create large down moves of any sort, and oftentimes uh that's actually manipulation and we might continue lower right there. Now if you think of it from An intent moment perspective, that makes a whole lot of sense. Why
is that? Okay, let's dive into it right here. So here we have a move higher. When we move higher, all we have and the evidence that we have is that we moved higher, right? But we don't know anything else. So there's many possibilities as to what might happen still. We could still continue lower at that moment in time, we could still continue higher, we could consolidate. We don't have the evidence at that moment in time to back any decision up if that makes sense. So right here, what could happen is we are trying to continue
higher. That's clear, I believe, right? We are trying to continue higher right here. Now for all we know, this doesn't mean that we automatically continue higher. Because if we try to continue higher, we could also just still continue lower like this. Right? It's important to Understand. So, what happens after is absolutely crucial right here. Okay, we remove that line right here. Now, we tried to continue lower right here and we stop right there where that that that dot is. So, this is where we try to continue lower and instead we are now trying to continue
higher again. So, we try to continue higher, we succeed, we try to continue lower and we fail and we continue higher again. What is the Evidence that you have at this moment in time? This is oftentimes, by the way, why a retracement in itself is not necessarily inherently bad because a move against you can tell you a lot more than a move in your favor, actually. So, I'm I'm going to explain what I mean by that, but right here, what is the evidence that we have? Well, the evidence is we tried to continue higher and
we succeeded. We then tried to continue Lower and we failed to do so. And now we're continuing higher again. So, the evidence is that we are too weak to continue lower. That's what price is telling me, inherently, right? So, the evidence is that we are more likely to continue higher. And I don't need, again, I don't need those concepts to tell me that right there because I can just see it through price action. So, right here, we tried to continue lower and we failed to do so. The bullish side Has been tested right here. This
is what I mean with tested versus non-tested move. So, the move that we had initially, this move was not tested. It could just continue lower very well. But, if we test it, we create a retracement right there, we tried to continue lower and failed right there, and then we continue higher again, the bullish side has been tested. So, now the evidence is that we are more likely to continue higher. So, there's evidence That price is not strong enough to continue lower, so it's more likely to keep continuing higher. What does this example on the left
look like through candles right here? Because you might, and my mind also does that, and I talk a lot about fair value gaps, but my my channel, etc., is a lot about fair value gaps as well. But, at some point you start realizing that fair value gaps, all they are are just certain momentum, right? And you don't necessarily need Fair value gaps to tell you a certain momentum, for example. So, I still use fair value gap, don't get me wrong, but right here, my mind automatically, when I see this move right here, it's it thinks
of, "Oh yeah, we are retracing back into a fair value gap, for example, right there, and then we are continuing higher." But, like I just showed you, for example, with this move right here, we don't need to retrace back into the fair value gap to continue lower. So, Oftentimes, the fair value gap right there, or waiting for a retrace, or needing a retrace back into it, is a limitation in itself, if that makes sense. Where momentum intent already tells you what it wants to do. And the momentum, again, already takes into account the fair value
gap that you have right there. Okay, so what does that look like through candles? Well, for example, this right here, that same move higher, right? That same move higher, Where we are trying to continue higher. Now, we create this down candle right there. What happened in a down candle? In a down candle, we try to continue lower right there, but we failed to do so. And now we are continuing higher again afterwards, right there. So, this is the same as what we are seeing, for example, through those lines. We are trying to continue higher right
here. We are trying to continue higher. We try to continue lower, we failed to do so, and We are continuing higher again. So, the evidence is that price is not strong enough to continue lower at that moment in time. That's what we are seeing. So, this is where something interesting as well is that the best time to read a candle is oftentimes whilst it's forming, not after the fact. Because whilst a candle is forming, it actually tells you a whole lot that you sometimes might not be able to spot uh after the fact. So, for
example, if we Take a look at Nasdaq right here, we see that we are continuing lower with this candle, that monthly candle, obviously. But, if we replay this a little bit right here, then you'll see, actually, that this candle as well, the previous candle, tried to continue higher right there. So, if we do want to continue higher, you would expect something like this right there. Instead, we continue lower. But, I want you to pay attention to how we continue lower right here. Again, that candle forming in itself tells you a whole lot, right? Because this
candle right here is currently trying to do something like this. Trying to continue higher, because that's the up candle that we have. Now, afterwards, what we see is now it's continuing lower. So, even while we create the wick, so we have some price action like this right here. That's the price action that we are currently seeing right here. If we now continue lower again right there, then what is happening here? We continue lower again right there. So, something like this is happening underneath, right? So, here if we now continue lower and we mess around a
little bit, we continue lower, then what we saw right there is where we create a long wick, is we see something like this again right here. So, inherently, if you mark out The candle with those lines, what you're seeing is you're just seeing it continuing lower, right? That that's inherently what you're seeing if you just take it for what it is. So, right here, then we afterwards eventually drop off heavily right there and continue lower again right there. That's This is This is what we are seeing underneath. So, the reason why it's so valuable to
look at a candle whilst it's forming, because here you might make the argument Right there, well, this is just a move lower right there. That's all it is. No, because so much happened underneath. We we were first trying to continue higher, then we continue lower, we try to continue higher again, we failed to do so, we continued lower again. So, if it's in that candle, if it's creating those long bottom wicks for example, and then it's continuing lower again, it's telling you inherently it tried to continue higher within a candle, it Failed to do so,
and now it's continuing lower again. Now, for the monthly time frame, of course, you could also make the argument, well, are you thinking very much, but I can see this on the daily time frame, I can see this on the 4-hour time frame. Yes, but for example, on the 1-minute time frame. No, on the 1-minute time frame you could also argue you can see this on the seconds time frame. But, how valuable is this in my opinion? If you can You don't need to go Down in time frames to understand what those candles are doing.
So, again, later on we're going to have in just a in just a moment we're going to have a live example of how I'm reading that on the 1-minute time frame. And I'm just reading what will happen most likely next. So, if we move on right here, then tested versus non-tested moves. Again, we have this move higher right here. Okay. That's all we have, right? So, there's no real evidence Evidence-based decision-making. You couldn't really do anything with just a move higher right there. So, for all we know, we might just drop off after right here,
like we're seeing right there. So, we're trying to continue higher right there, and now we have a large drop off right there. Okay. So, now we actually have the same thing. If we go back a little bit, we're now trying to continue lower. So, again, all price can do really is It's trying to continue higher. If it's not continuing higher, it's likely continuing lower, right? So, if it's not if it's now trying to continue lower right there, that doesn't automatically mean that we now have enough evidence. For example, what I would like to see is,
okay, we now create this move right there. So, similar to what we saw in the bullish example, and we now continue lower instead. So, What is that What is it that we have? Well, again, it's trying to continue lower right here. Afterwards, the bearish side has now been tested because this move right here is trying to continue higher, but it failed to do so. It's not equaling that bearish move or anything like that. So, now we are actually continuing lower instead. There's evidence that price is not strong enough to continue higher, so It's more likely
that we are going to continue lower, right? So, if we again go over what does this look like in a candle formation? Well, for example, that same candle same up candle right there. Instead of that wick at the bottom, we create a down candle right there. At this moment in time, this might for all we know, this might also just be a consolidation. It's not entirely clear. Afterwards, what we see right here is Again a long wick at the top, for example, right there. Can be an up candle with a long wick at the top
right there. So, we try to continue higher right there, and afterwards we continue lower again. This is where the bearish side is now very strong because we have evidence that we tried to continue lower, and that succeeded. We try to continue higher, that failed, and we continue lower again. That's it. So, ask yourself Right here. If price is not continuing higher, then what is the only other possibility that it has? Well, if price is not going to continue higher, then it's likely going to continue lower. But, what if we also don't continue lower? So, what
if we don't continue higher, we don't continue lower? Well, we already went over it. Then, we create something like this. So, right here, we have a move higher right there. It's Trying to continue higher. At the same time, we have this move lower right there. It's also trying to continue lower right there. That also fails, and we continue higher again right there. So, it's not really continuing higher. At the same time, it's also not continuing lower. We have equal You can see the bullish lags right there are of equal or similar size as the bearish
lags right there. So, there is Inherently not a stronger momentum side at that moment. So, right here, we are trying to continue higher, we are trying to continue lower. Both sides failed right there. When that happens, when you see something like this, often times what's happening is that there's evidence right now the price is not strong enough to continue higher, nor lower. So, what we can expect is something like this. Just a consolidation. Yes, we can still Continue lower, continue higher, but inherently, we're not moving anywhere. We don't have a bullish, nor a bearish trend
right there. What does that look like in the form of candles? Well, for example, right here. We have an up candle, that same up candle right there. We create a down candle right there. But afterwards, we don't really do anything, we create an up candle right there again of similar size. We create a down candle again. And that's when we start Consolidating. So, what does that, for example, look like in a chart right here? If we take the most recent example on Nasdaq, then we see we are creating this larger retracement. Well, at that moment
in time again, this could continue higher, this could also create a retracement, or con- continue lower even. We're not entirely sure what it can do. Now, what we see right here is we see a large up candle. Those that large up candle gets matched quite fast afterwards with some down candles right there. Those down candles right there also get matched with more up candles and more up candles right there. Eventually, this leads to price action being arguably equal. So, here we create more up candles, we create more down candles of similar size, we create more
up candles, down candles of similar size. We're not going anywhere at that moment in time. Until this happens right Here. So, we start to create these continuations lower again, right there. Okay, we are trying to continue lower again and well, at that moment in time, we are succeeding. And here, we are trying to continue higher again. Okay, that's interesting. If this now completely matches the bearish move that we had right there, we're just going back into a consolidation, it's not really that interesting. But instead, what we're seeing is that we are now Continuing lower again,
right there. And again, you don't need to see that, like I just mentioned, you don't need to see that after the fact, right there, because even during the fact, you can see, for example, right here, we tried to continue lower, even a little bit earlier on the 1-hour time frame, we tried to continue lower right here. We had up candle, we tried to continue higher right there. We then continue lower again, right there, and keep Continuing lower. And even right here, that's already instant, right there, to continue lower towards a couple of targets that we
have. Here, we now continue higher again, right there. We continue lower, right there, again. We here try to continue higher. Again, we continue lower instead, again. I'm just reading price action for what it is, essentially. Now, the interesting part, right here, is that you don't necessarily need, for example, to Understand certain concepts. I need to understand the concepts form because intent because momentum is there. But often times, those concepts will inherently become limitations because they might not always show up, but the momentum will always be there. The intent is always there. So, I'm going to
play you a quick clip the from the live session that we had in the MMT, where we actually continued lower right here on the 1-minute. It was very interesting to Get involved. But there's inherently no bearish divergence. We don't need them. It's It's actually continuing lower right there, as well. It's actually a very good example, right here. If we take this as an example, let me let me put it side by side. So, for me, a momentum shift is the following. Well, let's take the bullish one, right here. Or no, let's take the bearish one
right there. We push lower, we try to push higher again. Which is that wick Right there. So, if you go into the second time frame, what is happening right there? We push lower, we try to push higher again, and fail. And we push lower again, right there. When that happens, that's a very solid momentum shift right there. That's essentially momentum telling you that we do want to continue lower. And that's essentially where it's it we're pretty confident right here that we do want to continue lower. In The same way, for example, if we want to
see a bullish push, with this long wick, for example, what we're seeing is we try to push higher, we push higher, if we try to push lower and fail and continue higher again, that's a bullish momentum shift. But if we try to push higher and fail in general, and we're not continuing lower right here, and we try to push high higher again, and we fail and we continue lower, it's Very good that we're bearish right there. That's reading its momentum. That's reading its intent, as it is, if that makes sense. And again, why is this
important to understand? Because you could argue, well, all right, this is the exact same thing as a reading this is an ST right there. Might be an ST. This is the read to continue lower. This is order flow confirmed. What you'll notice is not it the market doesn't conform to your concepts. The market is Not sitting there and saying, "Oh, well, Aureo's fair value gap needs to be respected." It doesn't work like that. So, you'll notice often time the market is messy right here. The The market is extremely chaotic. We don't get a perfect ST,
a perfect read right there to continue lower. So, if you can read momentum, if you can read intent without relying on the concepts right there, then you're so far ahead of the rest. It tells you literally everything. Of Course, with probability still attached to it, but it tells you when we are bullish, bearish, consolidating, retracing, reversing, everything. Everything. Without needing the specific concepts to match, if that makes sense. And I think it tells you the early signs as to what's happening based on everything we discussed. So, you can see it coming, not just after effect.
You can pinpoint the next likely move based on what's happening. What is the next Likely move right here? Well, based on momentum and intent, it's to continue lower towards those lows right there. It's This goes very, very deep. And again, we need a proper module to talk about this, but I'm going to try and cover everything that you should know for now in this live session as well. So, again, what is happening right here? Without needing to understand what a fair value gap is, we see and what is every candle doing right there? So, Every
candle, what you're seeing, and if you're just reading and again, we know that this candle size, right? But you can also read this as intent momentum. We try to continue lower and we do. And we try to continue higher and we failed to do so. And we keep doing that. Can you see that right there? We create long wicks at the top right there. We continue lower. And these are retracements, right? These are retracements on the seconds time frame. What is happening right there? This right here is a retracement, right? To continue lower again. My
thought process right here. The whole reason we move higher or lower or consolidate or reverse is all momentum, right? Now, what momentum exactly is made up of that might be buyers, sellers is momentum. Because again, when you are looking at momentum itself and when you are looking at this price action right here to continue lower, if that is made up of Buyers and sellers, then inherently what are you looking at? Well, you're just looking at the So, for example, this is why footprints or flow charts also doesn't make sense to me because price action tells
you that, right? Price action tells you the orders as to what's happening if you can read price action. It tells you everything. So, what I mean by that is, for example, the reason we continue lower right here is because there are more sellers and there are Less buyers. Obviously, but we can already see that through price action right there. I don't need something else to tell me that. If that makes sense. I can see that through price action literally because price action is the only method of objectively seeing and objectively understanding what is happening right
now. Because you can look at an order chart, you can look at a footprint chart or flow chart or anything like that, but you it The price Action tells you what is happening. It tells you how many sellers there are. It tells you if sellers are in control, if buyers are in control. It tells you everything you need to know, if that makes sense. It's the most objective way of seeing it. Very important to understand. So, when we move on right here, again, going back to this example, what is also important to understand, and the
reason why I said a retracement is so valuable, arguably, is because When you have this right here, we try to continue higher right there. If we now create an up candle like this, what does that inherently tell you? What it tells you we try to continue lower, we try to continue higher, we try to continue lower right there, and we failed, and instead we continue higher again. So, we have an up candle, we have a retracement right there, and we continue higher again. So, what does that look like on the lower time frame? Well, on
any other time frame, if you draw it with lines, that looks something like this, right? To continue higher. So, oftentimes that is very, very valuable. If we go to Nasdaq again, if we after this up candle right there, and that long wick at the top, created another up candle, that would have been extremely valuable information, because that tells us that something like this happened. We continued higher, tried to continue Lower, and we continued higher again right there. So, that right there is extremely valuable to then continue higher afterwards again. For example, with this right here,
we see that we have an up candle, we create a long wick at the bottom. Okay. Afterwards, that gets followed through by immediately another down candle. That tells you quite clearly that we do want to continue lower towards, for example, those next targets right there, towards That liquidity right there. Because this tries to continue higher, fails to do so, and instead continues lower again. This is where the bullish momentum now recovered. Now, if you invert that, then here we have the down candle right there, we try to continue higher, and here we see another down
candle. So, the bearish momentum has recovered at that moment in time, where essentially it's the same thing, right? Just inverted. We try to continue lower right there. Okay, We create a lower retracement, little bit tricky. What can we do at that moment in time? And then afterwards, we continue lower again. Tells you so much information right there on what we want to do next. So, ask yourself, if you are bullish and you're seeing a bullish scenario, then did it at least try to push lower right there. That's important. Now, if you are bearish, then the
opposite, did it at least try to push higher? Because when you see a move Like this right here, you see a large bullish move, it never inherently tried to push lower at that moment in time. So after we see this large candle right there. So the evidence that we have is that we just have a large move, but for all we know that could also be manipulation to potentially continue lower again. And that's exactly what happened. So if it tried to push you lower right here and then was followed through by more up candles right
there, That's a very different scenario. And then again, it doesn't have to be traded back into for example those rally gaps. No, even after this candle right here, if we now created more up candles right there, it would have been very different. We would have likely still continued higher and target for example those highs. The same right here. And again, most people get tricked by this, but here you see an up candle right there. That doesn't automatically mean That we will continue higher. It depends on what happens afterwards because we never tested this move. Like
we never tested this move higher right there. So if it tries to continue lower, pushes higher again, perfect. We can continue higher. But my first assumption is we never tested the move right there. So all the evidence that we have is well, this is just one move against a whole lot of bearish moves right there. I would argue it's more likely to continue Lower actually. And of course, there's a timing for when you ask these things. And what I mean by that is right here, we see that we continue lower. We tried to continue higher
right there. So if we replay this a little bit, we tried to continue higher right there. Now we see that we create also a long wick right there. And the moment this next candle is forming right there and it's continuing lower, and we see that, it's already very instinct to look to get Involved and start targeting those lows, start targeting those lows and those next lows right there. The moment we now have a large move right here. That large move, of course we have previous evidence right there. But this large move is just a new
large move if that makes sense. So for me, I still I don't see any evidence at that moment in time that we tried to continue higher. Of course previously, yes, but not a new, not after that large move Lower right there. So for all we know, this could just create large retracements and continue higher again. So now we try to continue higher right there. Okay, if that fails and we inherently continue lower like this again, perfect, right? That that that's all right. But instead we continue higher again. Okay, what do we do afterwards? We see
right here we continue higher. We try to continue lower. Okay, that's interesting. And Then right here we see that we continue higher again right there. That at that moment in time tells me, even though we had this previous price action, at this moment in time, what it tells me at this moment in time, not previously, is based on evidence that we are more likely to continue higher. Because that that's what it's telling me. We try to continue lower right here. Instead we are continuing higher right there. So it's more likely that we are going to
Continuing higher at least in the short term. Now again, like I mentioned at the start, I don't want to completely bash concepts and I think the most powerful way of using this is actually combining it. So I understand that was a lot to take in what we just went over and in all honesty, I wouldn't expect you to understand that first time around. But if you combine it with what you already know, this will be very powerful in my opinion. So what do I mean by that? Well, if you combine it again with anything that
you are used to using. So for example, for me that's fair value gaps, that's order blocks, that's liquidity. You might not use that. Even I would argue if you just use this understanding and you apply to support and resistance, you can get a very long way as well. Or anything that you can that you're using. So again, for me that is mainly PD arrays. So if we quickly go over the PD arrays again, this for me Right there is a swing low right there. So that three candle pattern when one wick at the bottom right
there sticks out. Or we also have this swing high where it's inverted and we have that wick at the top right there sticking out, which is that swing high. That's what I refer to often times as liquidity. Those swing highs and swing lows. That's swing points again. Quick reminder right here, bullish and bearish fair value gaps right there. Also that Three candle pattern, right? This inherently, if you look at it in the right now, that's just momentum. What it really is, right? And that will not always be created those fair value gaps, but they're still
going to be momentum. That's what I like to use right there as well. It's still something that we can reject from. It's It's somewhat my support and resistance areas, if that makes sense. These are my fancy support and resistance areas. Now, number three Right there is what I like to call an order block or what I refer to often time as well is a fair value area. That's it. Essentially, where we the retracement before we continue higher right there, that retracement to where those orders are, that's what we can potentially reject from again right there.
So, these are all things, PD arrays, that we can reject from potentially right there. Now, if we combine it with intent, with a momentum, We can really understand which PD arrays we are trying to reject from and which ones we aren't. If you really want to take it a step further and you want to really dive into the momentum intent world, you could even argue that you don't need to understand what we are rejecting from. Because if the rejection happens and you see that through momentum, then inherently it doesn't matter what we are rejecting from,
right? This is This is food for thought. But anyway, if we combine it right now, then again, those PD arrays can do two things. I always refer to that as well, either rejecting or not rejecting. So, rejecting is the same thing as respect. For example, we trade above this swing high right there and we reject away from that swing high. It's like a resistance level, arguably. And reject away from it to continue lower right there. So, that means in in my book, we are respecting it. Same thing as rejecting. If we're Not rejecting it or
not respecting it, we are disrespecting it. So, for example, we have this swing high right there as well. And instead of rejecting, so to continue lower and rejecting away from it, we are continuing higher right there. That means we are disrespecting that level, essentially. Now, this is where I want to show you another clip of a live example that I recorded specifically for this video to try and read the intent with combination with The PD arrays right there. Um I'm going to show you that from from last week a clip that I recorded. All right,
I wanted to give you a live example as to how to read price action whilst it's actually happening, whilst it's forming and not just after the fact, of course, those hindsight examples. Now, like I already mentioned in the video, it is, in my opinion, the strongest if you combine the concepts of those levels that you already know and you combine it With trying to read and understand price action as it's forming. So, what I mean by that is for example, I have a couple of levels that I have marked out right here. I have a
swing high right there. I also have this swing high right there and I have that swing high right there. Now, if I take a look at currently what's happening for example, we see right here quite sure forward. So, building the story from what's happening, what I can potentially expect Right here. As you know, the 15-minute that we tried to push higher right there and we do so. We tried to push lower with that down candle, failed to do so and instead we are pushing higher again. So, I would argue that on at least the 15-minute
time frame, not necessarily look at the higher higher time frame. I argue in the short term, this looks more bullish to me than bearish. So, what I'm going to do right here is I'm going to the 1-minute time frame and I don't Trade the 1-minute time frame. I'm not I'm not looking for a trade quite frankly right here. But, I like to use the 1-minute time frame because it's very fast. So, you're training yourself very fast as well if that makes sense. You're training yourself a very fast price action. And then if you if you
go up and that's just purely the purpose for that is reading price action as it comes, being very good at decision-making. What is it trying to Tell you very fast, etc. etc. Because of course, patience can only be built by looking at the higher time frame and as it's forming for example, 15-minute candle because that just takes a lot longer than a 1-minute candle of course. 15 minutes compared to 1 minute. But, the 1-minute candle in my opinion is very valuable in just tape reading, seeing how it forms if you don't have anything to do,
you want to study something, just open a 1-minute chart. See what's happening at that moment in time and just reading price action as it is. So, what am I trying to read right now? Well, I determined on for example, the 15-minute time frame right here based [clears throat] on the analysis that you do based on even the price action itself right here, we see the candles push higher, try to push lower, failed to do so and then push higher again. That to me tells me that we're Trying to push higher. We're trying to continue higher
right now and we can that towards for example these swing highs. Those can be targets. So, all I'm trying to read now right now is for example, if I'm looking for a buy, if I'm simulating that process, then can we still continue higher? Is it still interesting to to continue higher at this moment in time? Or are we potentially trying to consolidate? Is price action even trying to push lower Right there? I'm trying to read price action's intent in my favor, if that makes sense. So, I wanted to continue higher, so I'm trying to read
that as well. And if something else happens besides that, I'm also going to read that, of course. So, what are we looking at? Okay, we see this first candle pushes higher. Good. We try to push lower again, and that's quite well followed quite fast after with these up candles right there, where We're now trying to push higher. Now, my main concern right here is for example, if we do create a larger retracement back to the fair value gap, and even I I mentioned this as a fair value gap, but even if we create a larger
retracement for example into a certain level, it's arguably not that relevant if you just read price action for what it is. It to know the level, right? So, to quickly go back to price action right here, we try to push higher right there In the short term. It does seem like we're struggling. So, I do feel like we might be seeing a larger retracement at this moment in time at least. Now, if we still want to be bullish, it's still good. A retracement is not bad. It's what happens after the retracement. So, right here, to
me again, this feels like those candles right there. We try to push higher. At this moment in time, it seems like we're struggling a little bit to do so because we are we follow that By by these down candles etc. So, it feels like we might be in for somewhat of a retracement right there. Now, if we do get the retracement, again, a retracement is not bad. It's what happens after. Can we still continue higher? Or do we follow through all the way lower right there? So, if I'm trying to read price action's intent right
here, and I already have somewhat of a predetermined or I understand what it what I'm trying to See, then I know if I'm trying to see anything besides that, that's not going to be interesting to me. So, if I see right here price is trying to continue lower, it's trying to potentially consolidate. That's not interesting to me. Now, currently we're also seeing that we're trying to push lower or sorry, we are trying to push higher right there. We are trying to push lower. We create this wick right there that ends up well, Becoming a wick
right there where it's still this down candle. It's going to be very important to see and understand what this candle, this next candle is trying to do right there to determine what price action as a whole is trying to do. Okay, so we do see that retracement and that retrace again and again I need to understand this is not magical what I'm trying to show you here, what I'm trying to do. Okay, let's first read this candle before I go back To that. So, at this moment in time, if we are looking to continue higher,
I want to This is good actually. This is very good. Now, the the lower we close in that candle, the the worse it is essentially because if we close quite high, what does that tell you? Well, that tells you that price tried to continue lower right there and instead, what is happening is now we explode higher again like we're seeing here. This is very good. Very good right There. So, based on this price action, now I would say our price action intend is to continue higher again to target, for example, those highs. To target those
highs and continue at least in the short term right here towards a couple of these next targets right there. Let's see, that target is quite far away, but potentially you can find a target right here and we can we can just work with this target right there, for example, in the short term at least. Let's see. Stepping on a 5 minutes just to zoom out a little bit just to not get lost and this is again reading its intent, right? So, what was I trying to say? Because again, 1 minute happens very fast, so I
need to talk very fast to to essentially keep up so it doesn't that same hindsight thing that we're trying to avoid. Did you see what happened right there? I'm going to tell you summarize a little bit, but here, this is going to be super Interesting to see because now we have this new level right here. So, now we can see price is trying to push lower, but it in the same candle right here, in the same candle, it tried to push lower, failing to do so and continuing higher. So, that tells me at least in
the short term right here, we want to continue higher just a little bit more. Now, I don't exactly know where the next target is. So, again, I do want to have a level, but it tells me we can expand a Little bit higher above this high, if that makes sense. Let me see where where where is the next level really quick. Should have marked that out before I started, to be honest. Sorry about that, but that's this high. Well, what else do we have at that moment in time? Uh we can we can mark it
that high right there. Okay, let's see. Let's see right there. Let's see. Let's see what we have. All right. So, currently we see we did continue higher a little bit right there, but now we are creating this larger down candle right there, of course. Whenever this area is very large right there, and I can't really accurately say what are we going to potentially reject from, etc., it makes it a little bit more nuanced. All right. So, let's take a look at this next candle. We did try to continue higher a little bit, and we started
to create a Larger retracement a little bit. This is interesting. This is interesting, because now it's trying to potentially push lower again. It tried to push higher, as well. It's very interesting how it's going to follow through right now, because when it's trying to push lower like this, long wick at the top, long wick at the bottom, to me that tells me it's a little bit indecisive right here. Little bit indecisive. Now, if we do want to Continue higher, I would like to see us, again, do something along these lines right here. Create that expansion.
But, again, at this moment in time it's quite indecisive. So, I don't what I would expect from short-term price action right here is that we might stay a little bit in the same place. We might continue lower a little bit, continue higher a little bit, but stay in the same place a little bit until we get More signs of what price action is actually trying to show us right here. Let's see. Let's see what we can do. Okay. So, to summarize what I was talking about right here is, again, uh I almost forgot myself, because
everything is happening so fast right here, is uh the reason why we wanted to see, or not necessarily wanted to see, again, that's what I was trying to say. I was trying To say there's nothing magical. It's not rocket science or anything like that. All I'm doing right here is the same if you're trying to read a person's intent, what you think this next person's step might be. Then, you're reading that next person you're reading that person's intent from the outside and you're determining what the next likely move is based on what they what the
evidence that they are giving you, if that makes sense. So, It's an it's an evidence-based choice, if that makes sense. I there's a better word for that, but you're making decisions based on evidence that you have at that moment in time, if that makes sense. And that's the same in price action. So, for example, if you're reading its intent, the reason why, for example, I expect someone for retracement is because that's what it's telling me. It tried to push higher, it's failing to do so, we Started to create down candles right there, telling me we
might be in for a large retracement. Here, we create this retracement. Now, we try to push lower, we failed to do so, create a long wick, it's trying to continue higher again. I think we might be continuing higher towards these next targets right there. It's just telling me its intent. Now, on the 1-minute time frame, is that very interesting right there? Not necessarily right there, but imagine If this happens on a daily time frame. Imagine if this happens on the monthly time frame, on the weekly, on the daily, on the 4-hour, even a 1-hour, even
a 15-minute right there. That will allow you to capitalize on all those lower time frames if you understand that we are going to continue lower. This, you could, for example, uh it's a little bit crazy, you could dive into the one the the seconds time frame and under and capitalize on this move right there. Now, don't do that. Don't do that. It's just purely for tape reading purposes, but you get the point, right? Because this is fractal. So, if it happens on the 1-minute time frame, those same setups also happen on the higher time frame.
And that makes this very interesting. And that's why I'm trying to trade on the 1-minute, for example. Okay. Now, again, I need to understand you're not Always going to be 100% correct. And that's what I what was trying to say. There's nothing magical. There's not It's It's nothing magical as in you are trying to predict its next its next most likely move. So, what is most likely going to happen next? Okay, let's take a look at this. So, we trade back into this fair value gap again, and you could even argue the levels are not
that relevant, right? The levels that we are looking at. We trade back into it. We Try to continue lower right there. Now we push higher. It's a very good sign. So so far this is very good. I would argue this looks strong to continue higher again. Towards for example, these targets right there. Now, if we now start creating a long wick, that's what I'm looking out for. So if we start creating a long wick like this where we try to push higher but we fail to do so, that's going to be my concern. So often
times when I'm looking at price action Itself for example, I like to be somewhat pessimistic. As in of course, you would want to see something in your favor, but I I I want to see I want to look out for things that don't go in my favor. So they don't go my way. So for example, currently I want to see price continuing higher. If I now if we now create a long wick right there, then for me that long wick, that's not good of course. That is not good. So look out for details that go
Against you because often times you can then get caught up in yeah, but this candle was very good. Yeah, but this candle tells you it's not that good anymore right here or at least not that good anymore in the short term right there in the very short term. But now, can you see what it tried to do? It tried to push lower right there with that wick and now it's continuing higher again. That gives me so much confidence that we are going to reach That high right there to continue higher for example. So again, imagine
if that daily if this one minute time frame right there was a daily time frame right there. Imagine this is a weekly time frame and you could capitalize on this move to continue higher towards that next high right there or even even beyond that even higher right there. That's that's very interesting. So let's see what we're trying to do here. We tried to push lower Well, someone create a wick right there but that wick is well, not a wick anymore. It's a body right there. If we want to continue higher right here, that that's exactly
that's that's a very good sign right here. So when we try to push lower right there, we create those those wicks at the bottom. That's a very good sign in my opinion that we do want to continue higher again towards those highs. Let's see if we can actually get something along these Lines. Let me zoom out a little bit to the 5 minute time frame as well to see what we have. Nothing to really worry about. Okay. So, for example, if if you trade with fair value gaps, it's also very interesting to read this. If
you read this scenario at this moment in time, here you have a 5-minute fair value gap right there, and you see this candle already happening. Then it's not very likely that we are going to trade Back into the 5-minute fair value gap in the short term, right? So, you might be left waiting often times right there, waiting for a retracement, which might eventually happen if we now create a long wick right there from the levels that we've reached right there. So, let me show you again. So, we've we've done like again, like where we expected
or like we we thought might be the next likely move. Now, from this high, let's see what we can do. Can We create a larger rejection? What is price action trying to do right here? Currently, I would argue this looks more bearish right here than bullish. Now, then if if that like the lower time frame leads to the higher time frame, then if that happens, that might eventually lead to a larger retracement, for example, on the 5-minute time frame right there. We might see something like this, if that makes sense. So, again, this is this
is a super Interesting story, in my opinion, on how to read this. Okay, currently we are rejecting from that right there. So, we tried to push higher right there. We failed to do so. Now, let's see if we can try to push lower, which we are doing, and if we can actually follow through on that as well. We don't. >> [laughter] >> Perfect. What a what a perfect timing right there. Okay, perfect. So, this Still looks very solid to reach these next targets, in my opinion, right there. Still looks very solid, in my opinion, to
reach these next targets right there as well. So, again, if you understand this on the 1-minute time frame, this can also allow you, for example, on the 1-minute to actually place a trade or to decide I'm not going to take a trade at this moment in time or I am going to take a trade. Again, what does this tell us? It tells Us we tried to push lower, then immediately after I said that, we just exploded higher in the short term right there. So, to me, that tells me we're still not strong enough to push
lower. So, this still looks more interesting, at least in the short term right here, to continue higher, And it confirms the idea of reaching these next targets, for example, reaching those next targets. So, this is still very solid to continue Higher. That makes sense. And that's reading its intent. I know everything is going quite fast, so you would have to maybe rewatch this as well because again, we start off with expecting consolidation. We got that. We then get a retrace right here. We get this long wick. We We then go over to Okay, we can
potentially continue higher. We get this retracement. We can then say We say again, "Okay, we can potentially continue higher again." It's the next Most likely move in the short term. That happens again right here. And then now, arguably again, it tried to push lower. Trying to continue higher right there. I would argue in the short term we can again look to continue higher towards these next targets right there. Let's see if we can reach that. Let's see if that is the next likely move. And again, it's all about the next likely move. It's never 100%
certain, so I want to get get out of your minds, please, Because I never really got taught this as it's happening right there. Perfect timing right there. I never really got taught this. Um in in in my own trading because it always always people made They made it seem like it was a certainty. It was binary. But it's always probabilities. So, if you think price is telling you something, there's a certain probability Attached to it as to how likely it is that it is going to happen, if that makes sense. Like we've been doing right
here. And again, we arguably got the whole sequence right right here. Uh but that doesn't mean anything because I will also get sequences wrong, for example. But it's all probability-based. So, it's all Okay, I think this might happen that might have a 70% chance of actually happening, if that makes sense. It's never 100% or 0%. No, it's not Binary. So, that's very important to understand because you are going to get Sometimes you're going to get it wrong. Sometimes price action will tell you that it wants to continue higher. And instead, it just all of a
sudden starts to explode lower instead. Again, you're not always going to get it right. So, this is quite important to understand. And then again, the next step, of course, This is fun, right? Price action and reading This price action. But the next step is reading that price action and understanding, okay, well, if right here, I see that we are and this is exactly what we use, for example, for context areas on the higher time frame. I'm going to slow it down a little bit. I hope this reading right there made sense. Let me add on
to this a little bit more as well. If I now see, let's say the 15 minutes. If you ignore the time frame fact right Here that we're looking at the 1-minute time frame. And we try to push it lower right there and we fail to do so and instead we continue higher and have this next target above right there, then this area is super interesting to, for example, go into the lower time frame to look for an entry, right? Imagine if this area you have it on the daily time frame. Imagine if you have it
on the 4-hour time frame in the higher time frame in general, even a 15 minute right There. And then diving into the lower time frame to profit from that. That's exactly what we consistently do in the MMT. Because even this this 1-minute what we're looking at right there, it's arguably entry of what the larger area that we are looking at, right? Remember where we started this this little section. We continue higher, try to push it lower right there. And here we try to push it lower, we saw a little bit of a wick right there
as well. And we keep Continuing higher towards this next target. Here you can re-evaluate, right now, okay, what are we trying to do? Are we still trying to continue higher right there towards these next targets? What are we trying to do? And that is, again, it That's it. That's the That's the interesting part. That is what makes it so interesting. And if you now uh again, do that same thing on the daily time frame, for example, right here. You have this daily bearish fair value gap right Here on that at this moment in time. Okay.
We see that we try to push it lower from it arguably two times. Try to push it lower right here. Try to push it lower right here. Now, it could be that we will not necessarily explode higher, but we might continue higher a little bit and we might consolidate or even drop off afterwards right there again. So, for me, for example, an interesting target is this 4-hour high that we have above it. Let me remove everything else. There's a lot going on. Sorry to to have all these things right here on my my But we
have this daily bearish engulfing right there. You can see we tried to continue lower for multiple times. We tried to push lower, and we failed to do so multiple times. So, if we now try to push higher right there, or we failed to push lower, instead, in my opinion, what we can do is now try to push higher at least until we reach, for example, that 4-hour swing high. Once we reach that 4-hour swing high right there, then we can reevaluate. What are we trying to do from that? And that's consistently it, right? I'm not
here making a prediction that we're now going to reach all-time highs. No. Once we reach that next level, what What is price What is price now trying to tell me? What is it now trying to tell me? Can we still continue higher? Are we likely to continue lower, right? Or, again, you consistently reevaluate. And that's Why And this is why I like the 1-minute time frame is because you're essentially you're making a lot of micro decisions very fast at each other. So, what is it trying to tell you? And you're You need to act on
that. It's the same if you play a sport, for example. I think basketball is a very good example. In basketball, but any sport, but basketball happens very fast at times. So, the decision-making, am I going to pass? Am I going to shoot? Am I going to wait it out? Is super important. You need to have fast short-term decision-making, if that makes sense. And that's just a skill. You can train that. You can train that. Just with time. And on the 1-minute time frame, you really get exposed to that. The decision-making, if that makes sense. Are
you going getting it Do you think it's going higher? Do you think it's going lower? Do you think it's going to consolidate? And you need to Know that in split second, if that makes sense. And if you then zoom out right here to the 15-minute time frame, it's the same like playing a basketball game in slow motion. Well, now I don't really need to understand on the 1-minute time frame what is happening very fast. I can just take my time reading it. And that's That's the thing, then you're preparing yourself, if that makes sense. And
that, in my opinion, is extremely Valuable right here. So, for example, here, what are we seeing? We've reached these highs towards the left, and you could argue the 1-minute at this moment in time is quite indecisive. So, you would need to let it develop. We tried to push uh a right there. We tried to push higher as well. We create those wicks. Quite indecisive at this moment in time. So, unless we create more signs that we do want to continue lower or we want to continue higher again, at this Moment in time it's indecisive. When
something is indecisive, of course, it's it's a consolidation. It's not really that interesting right here to look to do anything unless you get more signs that we do want to continue higher or we do want to continue lower again. Now, after combining it, of course, there is one arguably major thing that is still missing and that is the time frames. Because the time frames are very important to understand. Now, what's Important to understand regarding time frames is that they are all It's all interconnected. So, what I mean by that is just all connected. All the
time frames are somehow linked to each other if that makes sense. Now, to make that a little more clear, what happens on the lower time frame will lead to the higher time frame. So, you might understand that the higher time frame is the stronger time frame, right? And that that is inherently true. But, that Doesn't mean that usually you see signs on the lower time frame before you see it on the higher time frame, of course. So, if we go over an example right here. We have an up candle. We have a down candle right
there. Okay. We see that it That is on the 4-hour right there. Now, this is arguably a little bit after the fact, right? So, we see an up candle and a down candle on the 4-hour right now. If we look at that from through a 15-minute perspective, through a 15-minute lens, then that might look something like this right here. Now, this is very familiar to if you've watched some previous videos of mine. It's the same sequence right here. So, initially we tried to continue higher. This is what creates that up candle, right? Now, we might
arrive at a point right here where we still continue higher right there, but we struggle a little bit more. So, now we continue lower instead. This lower time frame What we're seeing right here is trying to continue lower. Now, it is continuing lower. It's trying to continue higher afterwards right here as well. And right there. It's failing to do so and continuing lower again right there. So, this lower time frame, and if it continues, eventually leads to that higher time frame candle as we see it. So, often times, why is it important to understand? Because
often times, you can anticipate what is going to happen. You don't necessarily need to your trading for example a specific candle. You're trading with a specific candle on on the higher time frame if that makes sense through the lower time frame. So, if we take a look at this example whilst we are continuing lower right there towards this low right there. Now, a lot of this can be read on the lower time frame already. So, let's break it down. We see that we have this up candle. And I'm going to mark out the low of
that up Candle right there. If we go into the 15-minute time frame for example, you can see this quite clearly. This is also where I took a trade myself a little bit later on right there. I'll show you that in a little bit. Here we see we reach this low right there. We create this long wick. That long wick essentially you could argue well, potentially we are trying to continue higher right there. And it does. It Tries to continue higher. We see great long wicks at the top. So, it is failing to do so. Here
we have a very valuable formation again. Very similar again, this is fractal, right? Happens on every time frame. 1-minute time frame, 15-minute time frame, it doesn't matter. Here we see that we now have the same formation right here. So, this same candle. That long wick at the bottom right there whilst we also have a long wick at the Top. This is extremely valuable. Because we try to continue higher, we're arguably failing. We're also trying to continue lower, we're arguably failing. So, what happens next is extremely valuable. If we now continue lower, and again, that doesn't
have to be after the fact, but as we see this candle expanding right here below these lows right there again, that's extremely valuable. Because now we try to continue lower, try to continue higher again. Perfect. And if we try to continue lower again right there, perfect. That tells us that we are inherently more bearish at that moment in time. What's happening on the lower time frame is something like this, right? Like that. That that's what's happening right there. So, here we continue lower, we keep continuing lower right there, we eventually again combining it, we arrive
in this fair value area right there from here, which is basically just an order Block. Now, right here we see that we create a rejection. What I'm trying to understand at that moment in time is can we still continue lower? whatever you're about to do, can we create a larger retracement, what are we going to do? So here we see that we create this low right there. Again, very valuable information, right? Because now we try to continue higher, arguably. Now, instead we continue lower again. Now, of course, you might also see that As a rejection
from this bearish fair value gap. But I want you to try and let go of that a little bit. I know combining it right there, but we don't need to reject from that fair value gap, if that makes sense. In the same way that we don't need to reject from a fair value gap right here, yet we are still very bearish at that moment in time. That's because then you're limiting yourself to a certain view, if that makes sense. So right here, we now Continue lower. Okay, perfect. What I'm waiting for essentially right here is
can we get something like this to continue higher again and then continue lower again. So we see right here that if I go to the next candle, we get this wick right there. Perfect, that's what I'm looking for. So if we now overtake that again right there to continue lower, then again we try to continue higher, fail to do so, and we continue lower again. So this is where I Now look to get involved, where my entry was around this area right there covering those bodies right there to then target a one to two RR,
which eventually played out essentially. But you'll notice right here, I'm not using, for example, 15-minute fair value gap. I don't necessarily need them in order to understand what is happening right there. And then you're taking a whole step further into the right direction The moment you start realizing that and you start understanding that. So eventually we continue lower right here and we continue lower. Same reason why, for example, before we reach this next target right there, we don't reject back into this fair value gap. And often you will be left waiting, but we already see
we try to continue higher right there, try to create a retracement, we fail to do so, and we continue lower again right there, if that makes sense. So here, Okay, we now run into this low right there, so that liquidity level right there. So on the lower time frame, and even if you go into the one-minute time frame, let's take it to the extreme right here, you'll see that we try to continue lower right here. We We actually succeed somewhat in the short term. Now we try to continue higher right there. We create actually a
retracement right there. So we try to continue lower again, we fail to do so, And we continue higher. So typical shift, right? Typical shift is move in our favor, try to do the opposite right there, another move in our favor. Typical shift right there. So this is where we now continue higher again right there, where this this uh what we're seeing on the lower time frame eventually leads to that 1-hour close, for example, that we're seeing on the higher time frame right there. For the same reason that we are seeing a long Wick at the
top right there. If you go into the 1-minute time frame, for example, you see we create a large down candle right there. Try to continue higher, I fail to do so. We continue lower again. That creates a long wick that we are seeing. So the lower time frame right here leads to that higher time frame formation. Now, the reason again why that is so extremely valuable is because the moment we start to continue lower here again right there, And we, for example, go into the 15-minute time frame, we see that we try to continue lower.
Perfect. Try to continue higher, fail to do so, and we continue lower again. Perfect. So here, this is very interesting to now continue lower towards those targets again right there. To now keep continuing lower. And that eventually leads that 4-hour large down candle, for example, but you don't need to arguably wait for that complete candle to be closed right there. No, Within that candle that already tells you so much. So it's understanding how these time frames are all connected to each other. I always mention understanding time frames in itself is is is skill that you
need to learn. And the only way you can learn that is by simply, for example, doing some tapering sessions, just not necessarily trading, just looking at the time frames, how this is happening, what is happening on lower time frame compared to the higher Time frame is difficult. It's very overwhelming at the start. But it's something that is extremely valuable in your trading, because you can get lost in the time frames as well. Now, when something like this happens, we call this early signs. So, for example, if we take a look at this 4-hour down down
candle right there. That's after effect. Now, the early sign that that was happening is, for example, we try to continue lower. Perfect. We try to Continue higher, fail to do so, and we continue lower again right there. When that happens right there, and the same thing happens right here, we call these early signs that this is all just failing essentially, and we are likely going to continue lower to then create a larger 4-hour down candle right there as well. That's important. I know this is a lot to take in, and I can probably already see
some of the comments as well. Uh this is too much, and why not Just use the concepts? Again, if you can achieve I don't think people understand how significant this actually is, and maybe I'm just extremely passionate. I am extremely passionate, I can tell you that. But I don't think people understand how significant this is, because if you can understand if you can read that momentum and intent, and you can read price action for what it really is, then every other concept that you can think and that gets created is Already within that, if that
makes sense. So, you don't need to learn any more concepts or anything like that, because you can read momentum and intent, and you have everything that you need. And that is significant. That is a monumental shift. That is like we don't need anything else anymore. That is That is pretty insane. Now, of course, right here I want to end with a quote. Uh once you have read the full book, the summary becomes a tool you choose to use, not Something you depend on. Because the moment you depend on the summary, anyone who read the full
book will always have the edge.