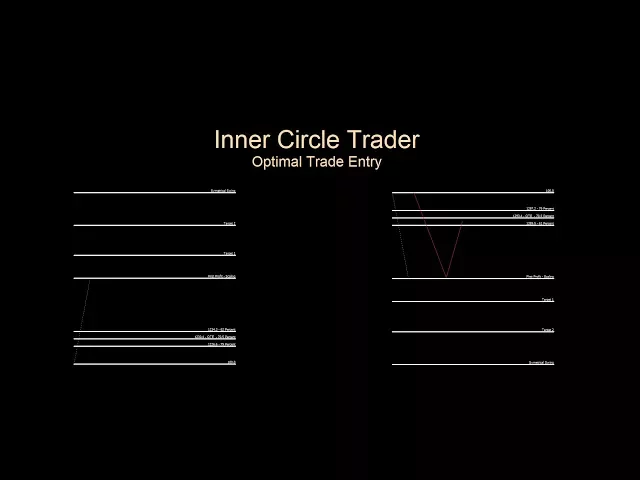
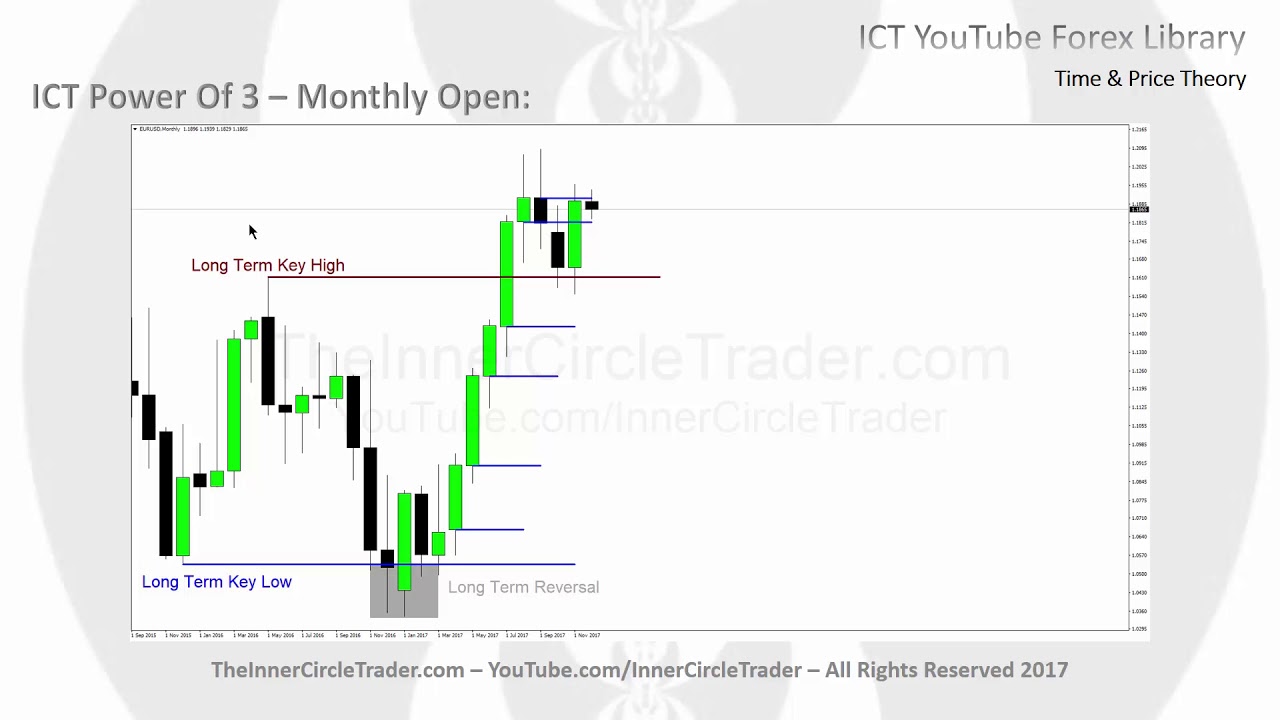
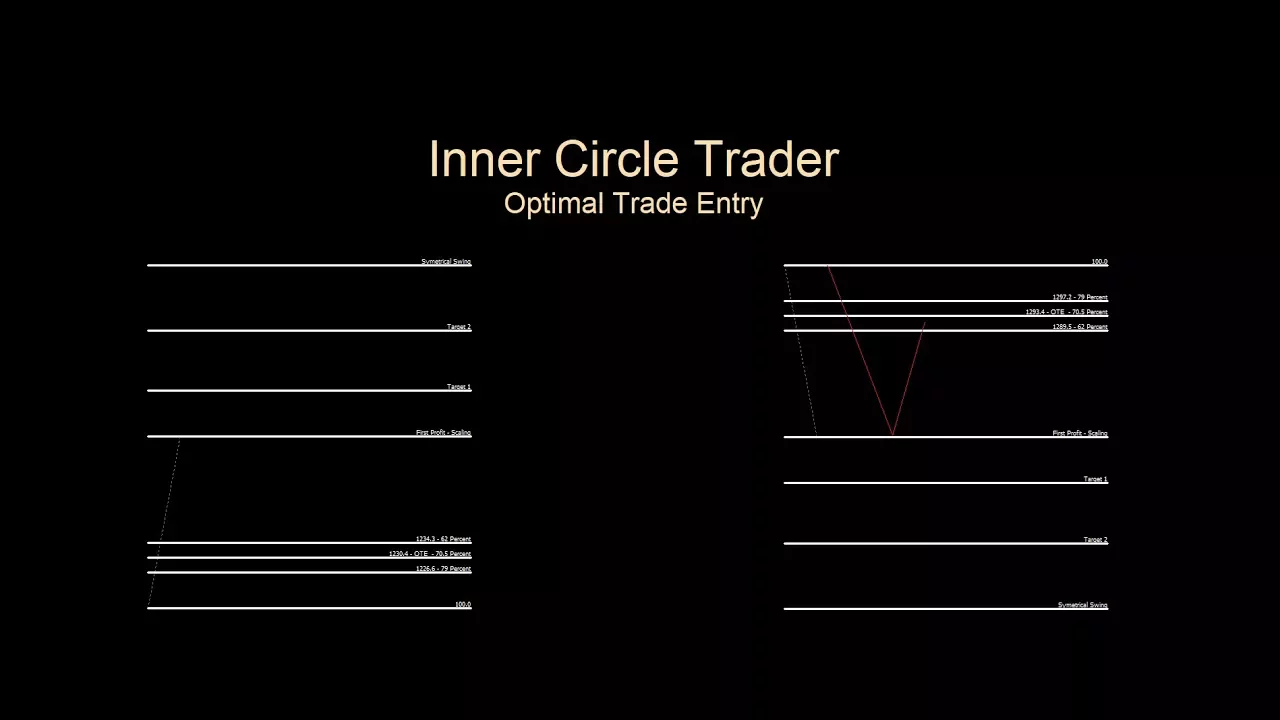
okay folks welcome this is gonna be the first video I do as a beginning or a point of origin if you want to call it that for my continuing series on the YouTube channel inner circle trader so it's gonna be a daily entry in terms of the YouTube channel will have a Monday through Friday video log so there'll be something posted and in October 2017 I'm going to be doing a New York session live commentary so I'll be talking about one particular pair per day based on personal choice and selection it doesn't mean there's gonna be a setup that comes to fruition every single day it just means I'm going to give you an example focusing on one particular pair and using that as a foundation in understanding you're in learning price action so the first thing I want to kind of bring the focus to is why everyone starts trading obviously they want to make money okay number one I'm not promising you that okay cuz no one can the only thing I can tell you is this is a particular pattern that I first discovered in price action and it was very easy to spot it was very easy to see and understood the mechanics rather quickly and I think from everyone I've ever taught this is the one pattern that most gravitate towards there's a lot of different trading patterns out there especially in my personal repertoire but truth be told I only have only two setups that look at and I'm not gonna give you there's particular setups here but I'm gonna be teaching you the generic optimal trade entry from a foundational standpoint or bare basics approach to it now right away much like everyone else has already gone through my free tutorials they either dismissed it as oh well you know it's too easy too simple trading can't be that easy and no trading isn't and CLE easy quote-unquote makes it difficult this is you have to measure the amount of risk involved for every setup and then you have to stick to a trading plan that you know follows that setup and even that doesn't guarantee you're gonna make money so the author I'm guaranteeing you here is a solid understanding of what I see in terms of price action as it relates to optimal trade entry or as it's deemed on the Internet and in my own tutorials OTE okay just abbreviation for optimal trade entry alright so the first idea is number one before we do anything I'll kind of like want to remind you all that I did a lecture years and years ago about how your trading plan as many as some might feel that's necessary to have you know 14-page you know treaty yeah what it is you're going to do I think personally once you understand the mechanics of it all and what you're doing and conceptually it only needs to be enough to fill the back of a business card okay so you need a short little list of things that you know by heart what's your risk model how to frame that what makes your entry what gives you the conditions in the market place that makes you bullish and bearish and you know how do you execute and how you manage that trade and then you obviously you know where do you take your profits at so obviously it's a very oversimplification on my part admittedly I understand that but my return back to online I guess tutelage and teaching it's really kind of like bring it back in the scope of simplification because I have a lot of things that I've taught everyone about trading every asset class specifically Forex the common consensus this is because everyone's tried to learn everything I taught and they tried to apply it to every possible scenario and every particular trading day that they have time to sit in from the Sharks it doesn't promote you know solid understanding in fact it creates kind like a paralysis effect so what happens is one quickly walks away from the material thinking well number one he's just a demo guy because you can't do it or because I haven't showed a track record and it's always been about you not about me so if you take this information use it I promise you you will have a greater understanding about price action than you have right now that's the only thing I can promise now does that mean you're gonna making be making any money no I can't promise that okay so everything I talk about is going to be referred to as a hypothetical scenario because I'm not trying to take ownership of the risk and rewards that you take in using this information so this understand that - it's for informational purposes only I think if you look at it you'll quickly see that there's something of worth in terms of studying it says the first thing we're gonna look at is understanding what makes the market predisposed to go higher or lower now if you recall for those that have had that benefit of going through my old tutorials I had a teaching on selecting key support resistance levels and it's primarily just marking from a higher time frame monthly down into the lower time frame so you wanna say lower time frame that would be about the four hours the lowest I'd go in terms of defining it as a key anything less than four hours is too short term to refine that on a large institutional basis so what I like to look for is and when I taught one if Reta twirls is that if you used a higher time frame monthly weekly daily n' four-hour and will just leave the four-hour offer right now this focus on a monthly daily and weekly time frames if you look for key levels where price has moved away from it in other words if price has moved up to a resistance level and repelled and went lower we can reasonably assume that there was a large degree of institutions that had a interest and being short there and if the market trades down to a level and bounces off of it and goes higher we can reasonably assume that there is an institutional basis for that rally to ensue no without going in the great detail and revisiting everything I've ever done and trying to compressing into a very short video just that that simple premise of using a hard time frame chart and use a monthly chart there's plenty of high probability scenarios that you could find just using a monthly chart no you don't get a whole lot of setups but if you're watching a wide array of particular assets there's always something trading at or near a monthly level okay and what's a monthly level an old high an old low simple as that now everything I'm going to be teaching and revisiting in the YouTube channel is all about simplification very simple processes simple ideas no indicators no gimmicks none of those types of things you don't need all that stuff a very simple understand of price action the premise behind what makes these things strong is we're looking for the evidence that there's going to be a institutional sponsorship behind the price move that means big entities deep pockets lots of orders coming in large sizeable orders are coming in we're not looking at ladders we're not looking at little tiny little fluctuations of intraday volatility we're looking at big massive tell-tale signs that these big boys have pushed price around and you can see that on the hard time frame I've said this so many times if folks would just focus on these timeframes it will answer 80% of the problems you're having because you're too worried about what's going on in these lower timeframes because you're in enamored by something maybe I've done with an intraday chart five-minute 15-minute something that we've been one minute charts you get on social media everybody's a wizard now and they're showing all kinds of things that they've either done or can do and that's great but one minute charts are not going to decipher what smart money's doing that's just very short-term volatility now I'm not disparaging the ability to make money doing that because I can do it just as well as the next guy can but what I really want to focus my time on this is what I taught from 2010 that's it really just to 4x but it really goes across all asset classes if you use a higher time frames you want any asset classes you're looking to speculate in or study that is where the big money moves are it's as simple as that it doesn't get any plainer than that okay so we're going to assume for a moment that we are you assumed it's a markets bullish okay and we would be looking for the market to trade higher optimal trade entry is really based on buying retracements okay as the market makes a impulse price move higher that impulse price move has to be incorporating a break in market structure and I'll show you what that looks like in the chart and then your what you're doing is you're trying to buy the retracement slower and obviously it's very cliche to here in technical analysis buy the dips sell the rallies okay if you're bullish you're gonna be buying the dips or any retracement slower after a price leg higher and then the expectation is you're buying it when it retraces and then you want to buy it as it does that and then capture the next leg higher and everything's reversed for when it's bearish we'd be looking for rallies in price and we look into sell those rallies with the expectation that we're going to break to lower lows okay and that's the optimal trader through short and optimal trade entry long in a bare definition simple definition so what it looks like is on a fib this is the basic model there's been many approaches to having the Fibonacci show what I use for optimal trade entry but this is the bare bones is how it started this is how it is and I'll show you what these settings are let's go here and click on and I'll let you see the settings that way you can set your mt4 or equivalent to the same the zero level is first profit and scaling I'll explain these as I go 62 percent retracement level unraveling it and then you have the 100 level which is one here and then we have the % dollar sign just allows the mt4 platform to plot the actual value you can see that over here and then it's 0. 7 0 5 for the sweet spot for optimal for entry that's the price level I'd like to see price trade - and 79% and we have our target levels which is zero negative zero point six two negative zero two seven and then negative one for a symmetrical price swing okay and then the same as this you know done over here I don't need to show you the property settings for that it's the same thing that's shown in the scale of looking for downside objectives so the premise is we would be looking for price to do something like this okay we have a impulse price leg higher and then we have another impulse price leg off that level and trading down into optimal trade entry okay so we're trying to do is get below halfway of that price leg higher down into 60 to 70 and a half to 79% raise my level okay I try to get my fill at 62 just to everyone knows right away it's for completeness sake I try to get a tour very close to the 62% tracing level I allow up to a little small deviation below the sub types of trades along 280 ok now I allow that for price now my stop will be exactly at this low not 10 pips for 5 to put pips below that it's gonna be right at that low okay so it's the easily defined if we are trying to get in at 62% traits level it'd be my fill would be one I'm sorry 1234 0. 3 was calling this is the gold market behind all this stuff it's just that's the price is showing I'd look to get there um fill that basically 12:35 we'll call it okay just a little bit about 62 I'm not gonna fancy dance around try to get the actual level I just want to be in a level that makes sense okay and then between net and where I think the lows should be formed based on my analysis where price would be turns for the price swing I'll show you what that looks like in the chart this stop would be exactly right there so between the two reference points that would be the risk okay the level up here zero level is when you take off first profit now I like to go a little bit early because it can always fail getting back to this high so at that high or just below it that's where my first profit is that's your first scaling that's not your first target first target is here okay so you got to expect price to want to eventually get to this level or maybe this level if you're really extremely bullish all the way up here to have a measured move what's a measured move the impulse leg low to high that move is the same thing just add it to the high up okay so that's a perfectly symmetrical price swing you don't always happen to that degree and that's why we have to be looking to take profit right before our old high because it could fail there and if it goes above it at the 127 extension basically is what this is I'm gonna be looking to take something off there and if we get to 162 extension up here I would be another portion for me to take profits and then if I'm extremely bullish I'll leave a small piece on for a measured move type effect so the same thing as seen over here for when the markets bearish we look for an impulse leg lower in price okay and then we expect to see price retrace higher back into optimal trade entry and that's defined between 62 and 79 cent racial it can be anywhere in here now the problem is is I'm not teaching supply and demand so supply and demand zones and stuff like that I don't do those types of things I look for specific price levels and I'll teach you through the month of October how to refine that down to a specific price level and not just wonder you know where it is in that zone you're going to be taking a trade at okay so I'm going to do the actual price levels to look for the same thing we would expect the price to show willingness to drop lower limiting our risk to the actual high between their entry and the hi that's our risk so we would take that amount of risk defiant divided by you know the percent risk that we're willing to assume based on our count let's say it's a half a percent we're a half percent of your account is you take that in terms of the pips and break that down and that would give you your per pip leverage and I know something I'm brushing over that rather quickly and it's because I'm trying to just give you a pound a ssin and then obviously through the entire scope of October will actually refine as you can see how to do your risk how to determine your risk and figure out what you can earn on the position and what you're you're risking and I'll teach you how to move all the stops when when it's supposed to be done and all that but ultimately we would expect to see it then move down into some reasonable objective first profit would be down here but just above the old low so we would on take profit here the thing is this is what why most traders screw up and you don't make money and they're not profitable either in demo or in live is they don't do this practice right here knowing where to get out it's our first scale you have to know what that is and it has to be a reasonable amount of range to promote the idea of justification for the risk so if I know I'm getting in here in my entry exit but a loss is up here with my stop it has to be a reasonable you know better than in my opinion better than two to one okay and that's about as good as I get in terms of trusting reward to risk ratios okay so what I'm looking for is everyone will look like this way they'll say okay I'm I'm trading here at is short and my risk is here so that's my risk okay whatever that multiple is then they start doing this it's okay for if I get short from that point there's one are there's two are there's three orders for our I think that's flawed okay and that's the reason why I make fun of folks when they want to talk about risk to reward models it really should be done on first scaling okay so if I'm getting here as an entry and my risk is here it needs to be enough of the position coming off that promotes at least two to one so this is one are in terms of risk whatever that is I have to be able to make two times that in my first profit that's what I'm trying to shoot for now sometimes I'll take trades that are just slightly underneath - it might be like one in three quarters okay if I'm really really aggressive and I'm just in a fast market and we're not even fast mark I should say like this if I'm gonna market debt is indecisive but I'm already in a position so I'm managing it I'll I'll look to take out one and a half percent but I'm really looking for trades that'll frame a model that will give me around - okay so whatever my risk is from here to here I want two times that from my entry to first profit okay and that's why I want to get as deep as I can you know into that 70.
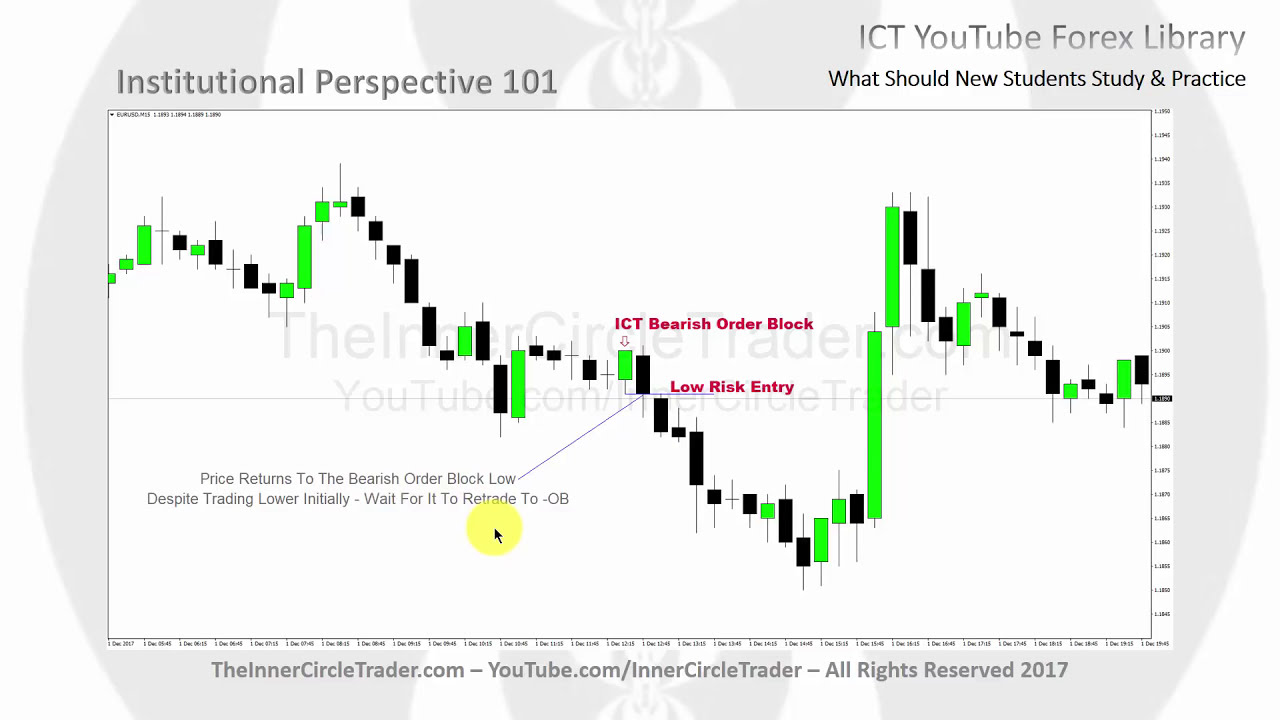
5 level I'm not going to demand 79% tracing level I'm gonna be looking for the 70. 5 preferably they give you my entry at 62 so that's what I'm looking for so not all trade scenarios are gonna give me this gearing but the ones that do are the ones I'm gonna take okay and obviously it's not as good if it's owned like a 1 or 5 minute chart cuz the range is gonna be very very small this setups that on like an alloy chart they're good because it'll give me enough of a range to get close to that two-to-one reward the risk and if I get that everything past that first scaling out takes care of itself and that's why it's I laugh when I hear folks saying it's stupid to take first profit or scaling out profits because your initial risk is X and then you've taken a small profit yada yada ya well that's because I'm looking for these objectives down here and it takes care of itself okay and it ends up becoming my last portion ends up being way more generally than what I did in my first scaling so it's it's not an issue for me to be worrying about if you see examples of it going forward you'll you'll see quickly there's no reason to be thinking it's a bad idea actually so let's go over to the charts and I'll give you some examples of how quickly and easily you can find these setups and we'll give you all kinds of examples of it going forward in October okay we're over here at tradingview dot-com and admittedly I'm a little clumsy when it comes to this platform I've not been active in using it but I've been practicing with it so that way I can use it as our medium for our teachings so I want to kind of draw your attention to how price on the euro dollar this is a wiggly timeframe and price in recent weeks have pushed above these old highs over here okay so if we did this on a monthly scale and that's still it just for completeness sake okay you can see this high here you do me a little bit so we have this high here in this high comes in at one 1714 okay one 1714 for this particular month so what I'm gonna do is I'm gonna draw a horizontal line right on it and I'm gonna ask you a question regarding pricing so if we see price trade on this particular month right here it trades above this high rate above it once we go above this old high just think in terms of simple support resistance folks it's not complicated when price is above it whatever that price level is an organ we've already assumed not assembly that I figured it out it was 1 1714 the markets trade in an algorithmic format okay there's price engines that generate you runs on price and runs on stops and it's accelerations in price and we're delivery skips and jumps to specific areas and pricing the easiest way to understand what that is is if you look at a chart you can do it like on an hourly chart or a 15-minute time frame you can see it on all time frames but really 15 in one minute if you do it every course of a week you'll see how price gravitates from a full figure okay that would be an example of like one 1700 to 118 zeroes there that would be a full penny move in a year a dollar that one penny move is broken down algorithmically to the 11780 level 11750 level or mid figure 117 20 level and then we have 117 big figure okay so my question G is this if price traces above it this old high back here because we broke through that this look this is high I'm sorry this high is 1 1714 so from an algorithmic standpoint what price level would it want to reach back down into if it's gonna go down for support 1 17 20 which was it's just above the 1 1714 right so if this high would have been 117 say 65 what would the level be that we you'd expect to see it reach down into for an algorithmic support level 1 1750 mid figure okay so think in terms of that okay and what this does is it eliminates all this distraction ok looking at ladders and depth of market and all those types of things you can probably swear by it and tell me you've done really really well and that's great just like anybody else using crossovers and MACD they can tell me they've done really well it out - I'm not telling you that you can't make money doing that kind of stuff I'm just simply suggesting to you there's a much easier purpose to doing this than everyone's doing so we're using an old high here and while the level is 1 1714 and the specific high from an algorithmic standpoint we would look for sensitivity or support to form around or at 1 1720 okay so we're gonna leave the level here and we're gonna drop down into a daily okay so we have the 1 4 on 1 1714 level on our charts and now I'm going to ask you to consider what is going on in reference to the institutional level from an algorithmic standpoint in other words we look at our pricing model it's full figure above it the 20 level above that mid figure 50 above that the 80 level institutional and then we have the next full figure okay or 118 so if we're above price when it trades above it here we expect to see price find support when it comes back down into the 20 level okay so now we can adjust this level here in show at 117 20 okay so 117 20 is the institutional price level from an algorithmic standpoint price is going to want to trade back down to that level the reason why it does that is it allows the market to pick up orders at just below or above that level okay there's limit orders there there's there stops there but generally it's coming down to run stops to pair the orders with smart money's limit orders okay every time you see my chart below the market I'm always referring to it as running cell stops above the market I'm always referring to it as running 5 stops those that are not in the know they will question whether or not I'm using the right definition I am using the right definition because I'm looking at things from an institutional standpoint those cell stops they're below the market place smart money will have their buy limits to pair up with those cell stops okay so my perspective is not retail so I'm looking at it from an institutional standpoint from where I'm from I don't look at retail so if we understand it the market is above this 20 level when it trades down into it we should see the market rate into a support level that sport level is going to be defined by some pricing model and I just gave you one that's very simple we used a old monthly high and we're finding support we want to see price trade-off of that and give us a pattern so now we have a level it's been rounded to an institutional level twenty seventeen twenty and now we can drop down into lower timeframe charts and we'll just look at a fifteen minute time frame okay anymore okay here we are alright so we have price trading down on the 27th and hitting the 20 level notice what it does it hits it and it rallies away that rally this is what you're looking for you want to see it take out a short term high that is seen here you a short term high it trades through it once it does that this break above that short term high is a market structure break okay so now from an algorithmic standpoint the price will want to retrace back down once it retraces okay it's going to pick up more orders and then rally again okay we have another break above this short term high here and I'm quite certain you guys that are more proficient with trading view you're probably smiling saying you could have done this or that and just made a copy I don't know all that yet so this is give me some time so we have another break here okay so we have short term high broken and another high broke and now watch this high being higher than this one from a market structure standpoint short term high intermediate term high so now when this breaks here have a much more solid setup for a pencil potential running and price higher now we have to enter the optimal trade entry because we already have a consolidation in here price trades away can came back to the consolidation distribution redistribution smart money reversal low-risk Buy and here we're looking for another area to buy okay or another area of accumulation or Aria cumulation to take us above this consolidation now what I just described to you is a market maker by model simple as that some of you will say oh that's Wyckoff well I kind of got the idea from looking at price action alone and then when I saw Wyckoff describing that scenario it made me feel better that I seen something that someone years and years before me was able to see that same price structure but his definitions and things I don't use that there's a different approach in folks that went through my mentorship know right away and I've challenged them as well to go through Wyckoff and see if what I was teaching was Wyckoff it's not it's very similar in terms of the general market profile itself because it's a very generic process markup and discounts and simple as that but the long and short is the the run above here right there that impulse leg is all that's necessary because now we have a a buy profile or model it would take us above this consolidation so we would look for this whole price action right in here to be traded above okay because that's where the buy stocks are hitting are sitting so smart money buys down here at the 20 level and we would know this level beforehand and it's basically the one 1820 because above this high this height would be 118 10.