in today's video I am going to show you one simple trading indicator that will immediately solve 90% of all your Trader problems and with that knowledge I can assure you that your profits are going to improve and I mean improve quickly now I'm not just going to stand up here and talk to you about some silly obscure indicator that sounds really good but does not work in a real-time Market nor am I going to sit there and tell you we need to draw a bunch of lines and connect the dots like we're all in the
third grade what I am going to show you is an indicator that when used correctly can get get you on the right side of the market more than 85% of the time but better than that I am going to prove it to you with a series of real trades in a real Market using real money three different ways that this indicator is going to make you a successful Trader number one how you will use this indicator as a standalone strategy to manufacture winning trades on a day-to-day basis number two how you will use this indicator
as a profit targeting tool and number three which will be the most important how you will use this indicator to keep you from making a bad trade in the first place now one of the interesting things about this indicator is there's a pretty good chance you already know what it is in fact there's a pretty good chance that some of you might be using it right now but unfortunately it's been taught to you all wrong and you've yet to see its true power so in this video I will show you how this indicator will help
you read the market like you are a seasoned Pro without any noise without any complications without any confusion and how this indicator will help elevate your trading results to a whole new level so what is this mysterious indicator that I speak of well the indicator I'd like to talk to you about is the ever so popular vwap indicator also known as volume weighted average price and the reason this is so popular and the reason I believe you've heard of it before it tried to use it is because when it's used correctly this thing has incredible
power to give you an enormous Edge in the market however like a lot of indicators if it's used incorrectly it's like one of the worst decisions that you will ever make now before I get started with this whole thing no matter what side of the fence that you're standing on for those who might be trying to learn this indicator you came to the right place for those of you that may have had a bad experience or maybe you've got a couple of decent strategies that you're working with right now I want you to do me
a favor if you listen to what I have to say here today and you follow the stepbystep blueprint that I'm going to provide with you I can promise you without a shadow of a doubt that when this video over you will in fact be a better Trader and the very next trade that you make using this indicator will make more sense you will have Clarity and chances are you're going to make a lot of money and how I'm going to do that first and foremost is I want us to look at this vwap a specific
way that's going to answer a lot of our questions from the start now I'm sure many of you out there already know what the definition of the vwap is it stands for volume weighted average price which is a measurement of the current day's volume against the current price of the stock here's the first thing we're going to do we're going to change the way that we look at this indicator what you need to know about it is this it's what the price should let's use some air quotes should be trading based on the current volume
so when you see the vwap according to the Market's volume it has collected for that day that's where the price should be now let's move over to to the Whiteboard and I'm going to try to make a little bit more sense of that statement that I just said I'm sure you've seen a stock chart that looked like this before where you've had this nice little Consolidated area right it's going up and down it's kind of just moving around and you don't know where it's going to go and then all of a sudden it goes on
this really aggressive ramp or you might see the inverse relationship where you've got the same kind of consolidation but you end up having this very aggressive rollover this waterfall now if if we were to lay a vwap and I'm going to show you how to set the vwap in a minute but what I want to do right here in this specific area is get everybody on the right side if you've struggled with this indicator you haven't gotten the results from this indicator or this thing is confusing you there's a reason why and before we even
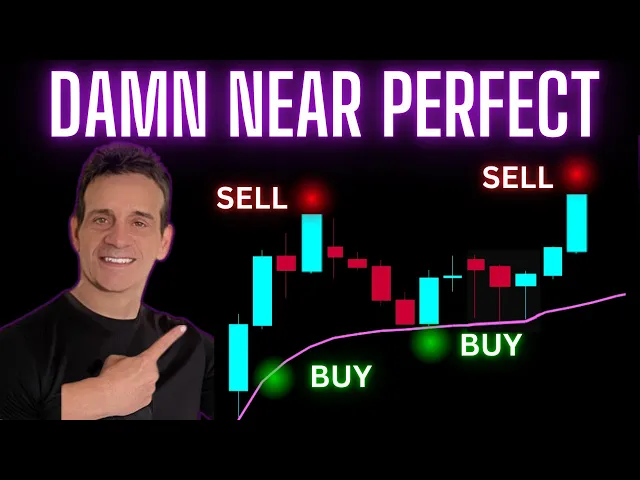
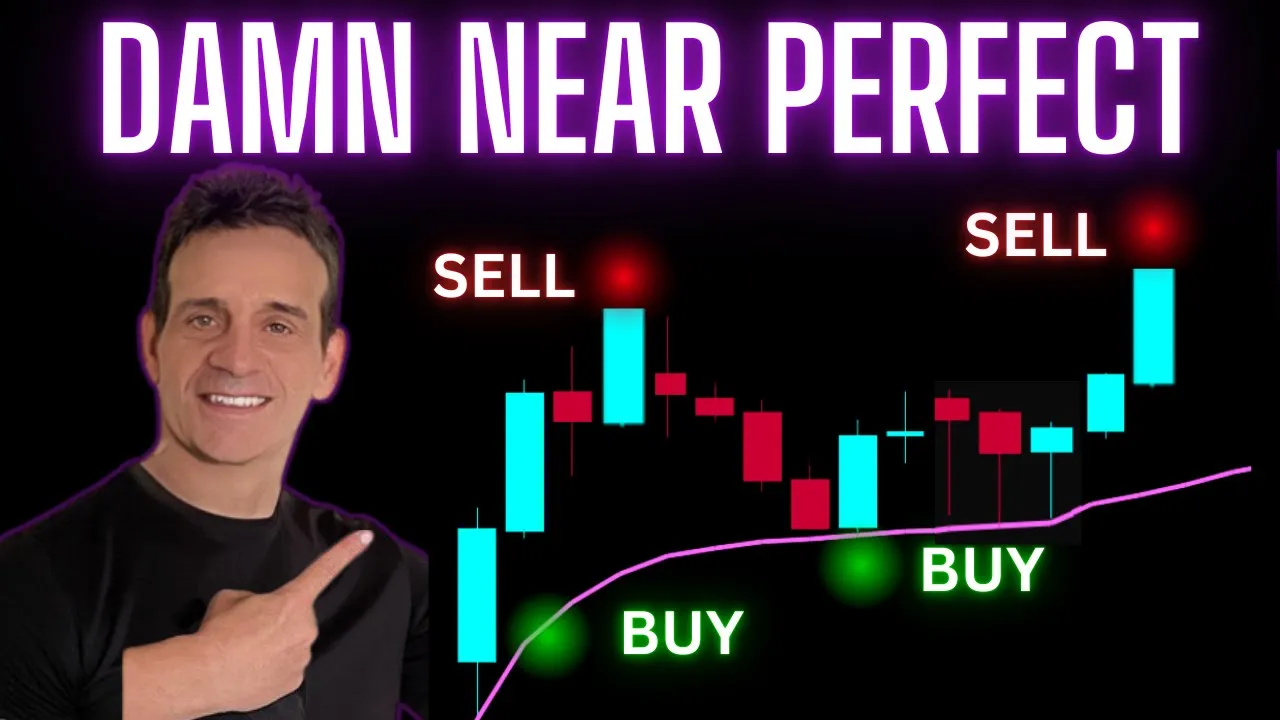
get into strategies and see live trades we got to understand these Concepts so we have the confidence that we need to trade so a vwap overlaying that might look something like this okay or if the instrument is moving down it may look something like that and I apologize for some of the sketchy drawing here I'm trying to do this with a mouse so this is the best I can offer you I'm not an artist I'm a Trader so here's what I want you to think first there are two specific scenarios that you will always 100%
of the time run into with a market so there's things that are not guaranteed things are guaranteed here's a guarantee there will be two specific spots for the vwap one will be something like this right here where you're bouncing around in consolidation and these two the stock price and the vwap are kind of long lost lovers they're just kissing each other just intertwining back and forth back and forth back and forth then what will in fact 100% of the time happen in the future there will become something we call a separator where they will separate
themselves and start to span out now let's focus on this up move because I'm sure you've seen this before and if you've used the vwap you're going to run into this almost every single day so let's go back to the should be if your vwap and I'm going to show you this in live trading and live charts so just how to follow me here then we'll move into the good stuff if the vwap is sitting down here according to the volume that has been transacted up to that point this will be on a one minute
or five minute chart by the way you can use whichever one the the formula is the the same no matter what it's telling you that the price should be right there but the stock price or the assets price is way up here okay now let's think about that for a minute we have obviously a serious discrepancy here we've got a stock price or an asset price that is really up here but then the vwap is down here now what does that mean this is what it all comes down to for us as a Trader because
when we see the stuff on the screen what we have to do is be able to decode the information and make a split-second decision here's what this means in just straight layman's terms at that pocket of time whether it's a one minute a five minute just focus on this that pocket of time you've got a market that is willing to overpay can I use air quotes again overpay for the right to own this instrument now I said just the right to overpay they they want to overpay at that pocket of time now in the longer
term scheme might not mean anything at all but for a Trader it means the world because what we have right now is a discrepancy where something is starting to detach itself from where it should be now here's where I want you to move your thinking right here so we don't get lost so we know exactly this is where our Edge is going to start showing up if it's up there there's only two things that are going to happen that's it either the asset price that you're looking at is going to Flatline while the vwap catches
up because it is a little bit lagging and it will adjust itself throughout the day so there's sort of like two long lost lovers like I mentioned they're going to somehow before the day is over intertwined once again and you'll see this in the charts it will expand come back contract expand and go on but first things first it's either going to stay up there or it's G to push itself back down rapidly into that vwap all you need to understand before we get into the charts is we have a discrepancy right there where somebody
is incorrect now again that doesn't mean the asset is overbought or oversold if it's going down it doesn't mean it's frothy or it's a scam or it's not going to continue but at this pocket of time you are losing a certain Edge if you are buying something stretched from vwap not because it won't go up over a series of days weeks or months but because at that little moment if you're trying to scalp or you're trying to day trade there might not be any value left in that trade or the very next move might be
a revisit of the vwap now keep that in mind because we're going to go over it same way to the downside you may have the same thing but before we move into charts here let's take as we move off of the Whiteboard a few lessons there because I bounced around for a second let's make sure we're all on the same page the the vwap is an indicator that's measuring where something should be trading and most of the day you will be intertwined with that which will give us an edge too in manufacturing the trades that
we want but also there's going to be several times throughout the day where you start to see a separation and the important thing to understand about that separation is the further that it gets please write this down the further that it gets we start to develop or we start to attract a different Kind of Traitor once we start to separate we start to get into possibly an emotional situation and that's important to understand the emotional situation because as you'll hear me say in a lot of my videos emotions are what the abandonment of intellect there
is no professional Traders consistently profitable professional traders that are chasing that price way up there I can guarantee you that now let's move over to a live chart and I'll show you what this looks like in a real time environment so on your screen here is an intraday chart of the ym Futures also known as the Dow Jones but before we get into all of that I guess what would be really cool at this moment is we talk about how we're going to set up this vwap because there's a good chance that some of you
might have this indicator set up in correctly that's why it's giving you false signals and of course we all need to be on the same page with the parameters we set for the indicator I'm using thinker swim platform here so if you want to set it up with them you click on studies which is right at the the top of your chart you can go to quick study or add a study and you will come over here to Market strength studies and you'll see way down there whoops let's go back here you will see vwap
just hit that button put it right up there on the chart now with thinker swim it gives you these like kind of upper lower bands these Ballinger bands we don't need that and we also do not need any fancy sort of setup with this so if you've programmed some sort of experimental numbers in there and it's not working for you you should move off of that we just need the standard settings which will be Universal through every broker they'll just give you this certain time period now very important to understand right here at this point
in order to get this right you must make sure pre-market data is enabled we need the entire picture now when you're looking at Futures they're trading like almost 24 hours a day so you have consistent trades the whole time but if you're Trading the stock we want to enable pre-market data because every indicator is a data point and we need to collect as much data as possible now I can't stand these upper Ballinger lines so you can just kind of click on them if your broker does this hit edit study and go right up here
you'll see these two inputs at the top the upper band and lower band I'm just going to set these at zero because all we're trying to pay attention to is the vwap itself and just hit apply and you'll see well there's the vwap now going back to the Whiteboard now take a look this is a real live chart what are you seeing here in terms of should be always keep that in your mind should be so you'll see throughout this time period right was just like it was drawn where the asset is right along with
the the vwap and the asset price are coinciding with one another so what that would really mean again in the layman's term it's trading at fair value it's a fair price according to the volume according to the price there is a balance there but what happens as the market begins to open for the day what happens there becomes an instant separation of those two now what we always have to keep in mind at this point and maybe why this hasn't worked this is really really important stuff right you have to trust these things are going
to give you the answers that you need one one formula to do here that I'll set right at the beginning so I don't don't I don't forget is whenever you get separation in case I've confused anybody up to this point whenever you get separation write this down don't go that way it's a trick you're going to get screwed so you can take a look here real clearly the Market's starting to drop right right from the open everybody's like whoa whoa whoa whoa whoaa what's happen What's happen What's happen right better short it better get out
better get out but you'll notice there's pretty significant separation and guess what happens right now I know a hindsight chart like this is going to give you the answers but I'm going to trade live with this and show you this is not a joke but take a look you start to pull down in here and guess what happens well you come all the way back up to the vwap right the little kiss right and then what happens to the other side you get a repeat of the move it's like they gave it to you twice
you extend all the way up here and then everybody now is emotionally on the opposite side again aren't they they're like whoa whoa whoa whoa whoa we gotta buy we gotta buy we gotta buy it's going to break out we gotta buy we gotta buy we gotta buy but what happens you come back down into the VW right here so there's a clear case right there and you can go back I'm GNA move this down as far as I can move it you will see every single time there is separation there is revisit that is
a 100% guarantee in a market scenario you stretch from the vwap you revisit it you go under the vwap you will revisit it you go under the vwap you revisit over the vwap revisit right under the vwap revisit under the VAP res 100% of the time that thing is going to happen now to clarify that statement remember it is also a lagging indicator so if the asset stays down well the let's call it maybe the Market's going to cheat a little bit the vwap is going to come down like okay I'm going to make it
easy on you to bounce but the point is one of the most difficult things for new Traders man is getting on the right side of the trade in the first place you can't get on the right side of the trade so this will tell you what to do so let's stop right there stop right there here's what I want you to do before you we even start talking strategies because I mentioned in the introduction there was a very important thing and that was it'll keep you out of a bad trade so let's write this down
if we are clustered in that vwap for an excessive period of time we don't want to trade that instrument because it's not ready to move up or down once it starts to move up significantly or down significantly we can change our mind for that patch of time it's off limits write that off if you have too much separation up or down you don't want to buy a separation up you don't want to sell a separation down if your goal was to buy that instrument that went up you need a revisit of the VW app right
and then a bounce or you need a bounce to sell into hopefully that made sense but let's start with what we should not do right and then we'll work our way from there right so what I am going to show you now are the strategies that we are going to use in real time because I believe we've covered how to set the vwap how we should be looking at it as it should and that they will always come back to visit one another like long lost lovers right so let's take a look at that here
real quick the strategy first that I'm going to show you is what I call the separator you've heard me use that word about a hundred times already so 90% of the separator trades will take place within the first 30 minutes now I want to kind of highlight that 30 minutes for just a second it may not click and register with you right now but one of the things like take this with you wherever you go might just be stepping off topic but when something pops into my head that I find is very important for people
I want you to hear it none of these indicators will work without context and time along with price is a unique feature one of the things that gives you an edge is this stuff will happen at a specific time like if you if you watch the John Wick strategy the John Wick strategy was based off of the opening break or the opening drop it has to happen at the open where emotions abandonment of intellect emotions are the highest right that's what we're taking advantage of the people that can't control themselves right so 90% of the
separator trade will happen in the first 30 minutes and what you will use in context with this is range and levels to execute that trade so think about that for a second that's what we're going to do and I'll show that to you but also I'm going to show you another strategy that we're going to use from it that's called the kiss pivot so the kiss pivot happens a little bit later you'll see the first thing that comes after the separator so there's two ways to use that you can either be the Super aggressive Trader
trade the separator then flip that position on the kiss pivot or if you don't want to go the other way because you really want to be focused on one biased side then just wait for it to come back the thing is there will be a revisit you have to believe that there's going to be a revisit it it comes after the separation and again you will use range level and Trend to execute trades now back to the charts let me show you exactly what I mean by all of this right here this is just a
FIV minute chart that we've already discussed on the Dow okay but first we always want to begin with the daily chart because the daily charts we don't have to make trades from the daily but I mentioned this as well with my others you got to know the data that comes from the daily because that's where your big levels but what I want you to focus on here to add context is the actual Trend itself right and I'll give you like a little jump ahead if a stock or an asset is super bullish they're going to
buy that dip it may look like oh it's going to tank Market's going to crash no it's not it's going to separate from the vwap and it's going to be a slam dunk buy you won't buy that dip that's how you'll know this is a great dip to buy now you can see here this is the midterm Trend here right you five six months trend is good enough you got an uptrend right here in the US markets in all of them right now okay you can call that bullish if you want or whatever you like
to say you can see that it's up visually with your eyes and over time you realize that so in a in an instrument like this 80% and this goes for anything that you guys are going to do 80% of all your trades should be with the trend you should be trying to buy dips and if you counter that Trend there's only one trade in my opinion that would be a parabolic separator kind of short that's the only Edge you're gonna have if you chase shorts in a bull market you're smoked right same way if you
chase Longs in a bare Market you smoked now you can see that with your eyes I'm going to give you a real quick cheat code and I do not want to confuse people but there might be new people that are learning technicals here's a here's a cheat code to figure that out let's say you look at it you like that's easy cuz it's going up but what about the one that's like that that's not so easy is that an uptrend or is it a down it's kind of confusing is it choppy one little trick here
gonna go back to studies you can use a simple moving average please don't use it for anything else but just a base guide I don't want to confuse by adding I hate indicators to some degree just go to the simple moving average down here and you'll see it it this automatically lays the 50 day moving average simple moving average okay I don't want to make any complication out of this we're not buying off of it we're not selling off of it we're not eyeballing this thing it's for the people out there that might be confused
about the trend that they're trading your Bitcoin your gold your foreign currencies your stock whatever you've got if it is above the 50-day moving average like this even though we've had a pullback in the in the Dow Jones you still got to give Bulls the benefit of the doubt you still should be buying 80% of the time in most cases because you're above the 50-day moving average if you're below the 50-day then you want to flip that most of your Trad should be short and you'll see it's the same thing you come there you you're
eventually going to reconnect there as well so you can use the 50-day as a cheat code so the first trade that we're going to talk about is that separator trade so take a look at this chart right now since we're already on it let me leave it up here I'll just use this one as as a guide we're still would be looking at buying the dip here for traits and giving the Bulls the benefit of the doubt because we've remained above that pretty much since September so every single dip that you buy we want to
look for that early morning flush out that early morning trickery move to do the buy now I'm going to show it to you here this will be a fixed chart that will be a little bit tad bit on the hindsight but trust me I'm going to do it for real that's the only way to prove it to you but I just want you to get the idea so when the live trades come by you understand and you'll see that you'll begin to have these moves it starts to accelerate lower and look it immediately bounces back
to it accelerates lower immediately bounces back to it accelerates lower bounces back accelerates way lower bounces back accelerates lower and just blows through it eventually okay nonetheless here's what you need to pay attention to why it works for Traders even though you have decreased in price over the last few days and that's what you're seeing on The Daily without question you're still ripping here okay you're still bouncing and if you wish to short it my personal opinion the better shorts are going to come from the parabolics that move into it so we're going to look
for opening moves right that move back into that as a separator ch trade right or if you wanted to short it we would be looking for bounce trades like this that will push back up the kiss right we and come back down so vwap if we're looking for a separator trade we're looking for a very aggressive open up or open down and a revisit of that vwap that would be either a short on a big parabolic or a dip bu on a big flush or you have the parabolic up you're pulling back into the vwap
we're going to use that vwap right there as a base and then see it move up here or vice versa you want a short you're going to look for a short right there risks will be above so those are the two trades that we're going to use and I will record a series of live trades here that way you'll see pre-market how it works and how we're going to handle this trade from here on out okay let's do some live trades here it's October 24th of 2024 I want to just let everybody know it's a
tad bit late I like to make these trades first thing in the morning but they're starting to develop a little later and because this is the day I chose to record I'm going to record so we're going to start out here with Tesla and we're going to use the kiss pivot here we have a stock that is a very good Catalyst after earnings it's up a lot so rather than Chase it let's see if we can get a pullback right in the vwap here see if the market chooses to support that we'll try to do
that kiss pivot right off of there and Target either the high of day or who knows maybe it will really take off running but that's the key rather than Chase we want to get the best best execution price possible so we'll give it a couple minutes and what we want to watch here too is that candle how does that candle get picked up if you guys watched the John Wick video The Box Theory video it showed you noticing that candle so we we need some kind of reversal candle or some kind of Wick or some
kind of signal off of that vwap to show us that the Market's interested in buying it okay we do have our next candle and that's exactly what we're looking for we have the retracement we have two tests of that VAP looks like it's going to hold we can buy here stop here apologize for the quick speaking but hey we got to get in this thing let's try to buy it right here all right so we are in Tesla price is 24788 stop is right there Target is up towards the high this is the kiss pivot
so here we have gold this is going to be interesting this is a completely different asset class again it's still late I want you to keep that in mind but I want to do these trades for you guys so you see how they work and you get the formula now what do we have here on gold we got a nice bit of Separation I don't want to talk too much I don't want to miss this trade nice separation but what in a nice bull Trend way above the 50 moving average we want to buy dips
aggressively we're very very close to support so we've got structure we got a double bottom I'll highlight all this stuff and go back to it very very slowly so we all on the same page but let's go ahead and buy this and we're going to Target that vwap so this is a separator trade so we are in right there 274 4010 and we are going to use stops roughly and right down here about 2735 and we're going to Target up here in this area so that's gold so a real quick update here on the gold
trade exactly what we were looking for we have our bounce we've held underneath this vwap where we held the support and it looks like we're going to kiss this vwb so let's go ahead and just put the cell here let's try to grab that we are okay we're out there 320 so that's pretty good so a little bit of an update here as they say a blind squirrel finds a nut every once in a while by using the vwap look I'm gonna sit here and tell you I did not expect the move to be that
powerful but there it is you got to be in it to win it right you got to take the trade you never know what the outcome is going to be you just have to take it in management I'm not going to sit here and say I saw this whole thing coming but did see the vwap we did do the kiss trade down there you are just I mean that's just as good as it gets I mean I couldn't have drawn it any better again it's not always going to be that crisp take it for what
it's worth it's just there to show you it's just a guide it will not work like this every single time just right to the penny there might be some Wicks around it but but there it is and here you are um yeah well this turned out to be a really nice trade on this one we are 616 two trades that you saw based off of that vwap using first the separator trade with gold that worked out for a few hundred dollars but what was the core of that trade that trade was based off of a
bullish strong uptrending chart an aggressive move lower a pivot that was backed up by multiple candles multiple Wicks then it moves back into the vwap we take the money Tesla was the opposite side of that trade it was the kiss pivot you have moved up so when you see these High Flyers these really strong stock these these post earnings gaps these big Runners rather than getting fomo very early on and chasing that move try to sit back and allow it to come back to you to the vwap for another entry again I'm not I'm I'm
really surprised about that Tesla I know the system and strategy works but I did not expect to go at 55 or 60 bucks I'm not going to sit there and say that that happens every single day but you can generate consist I will say you can generate consistent cash flow from that that I have no doubt about so hopefully with those two trades you saw one of each how that can work and how you can start using that on a day-to-day basis to make much better trades for yourself so as you can see when used
correctly the vwap has incredible power we had incredible accuracy we made consistent money and it proves its point that you can rely on this indicator the rest rest of the money or how big that money gets solely depends on you as you get better you can scale up and you can trust that indicator more but just from one Trader to the next just a recommendation for all of you new Traders don't rush the process learn it practice it use as small position sizes as possible that's why I use the small position sizes on here because
I'm not sitting here trying to impress you with gains I know what I'm capable of my goal here is to share my knowledge with you so you can become better and I want to use the small sizes so you see they they do add up to some pretty big premiums and all you have to do from there is once you get the confidence and you understand it and you realize why it's going to work it's just a matter of scaling up it's like the Wall Street Rays your goal at this point in your career is
to learn is to develop confidence through that learning is to get something that you can depend on and have a focus and Direction every day that way you're efficient so I hope that you learned that with the vwap I hope you've learned that through the rest of the videos that I have produced and if you ever have any questions about anything guys make sure that you reach out to me either through the comment section or the emails and I'll take this one last piece here before I wrap up this video make sure you go to
the rumors.com we produce a watch list every week I'm now going to be uploading videos that will increase this education that I won't be publishing here on YouTube so it's important if you want to learn more it's free I'm not asking anything for it I'm just sharing my 25 years of trading experience with you guys so you can become better again I hope this this video had some value if you have any questions any recommendations or anything you'd like to say that's why we have a comment section and on that note take care trade well
guys until next time cheers