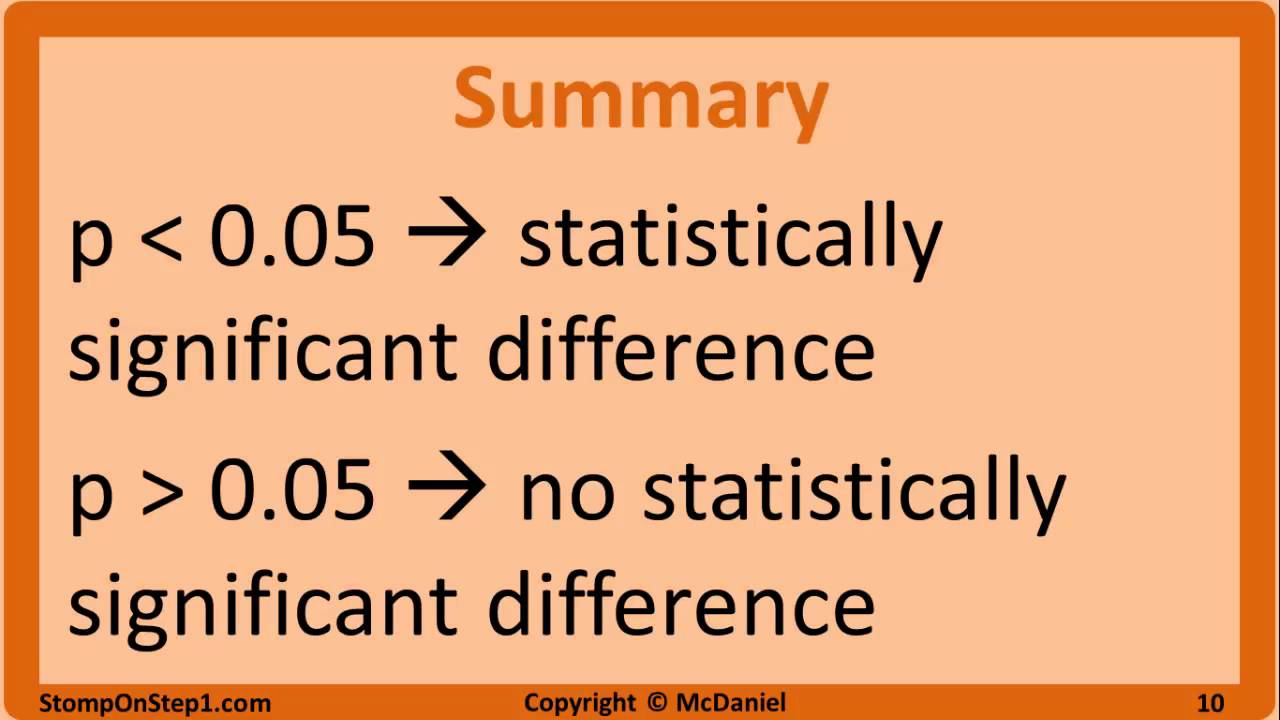
in this video I will explain the P value to you in order to explain the P value let's have a look at this example we want to investigate if there is a difference in the salary of men and women in order to understand the P value we first need the null hypothesis so we assume that there is no difference in the salary of men and women in the population okay so on the one side we have the population but it's certainly not possible to ask all women and men of the population for example of a whole country about their salary so therefore we need to draw a sample and in this sample we have a group of women and men and we ask them about their salary so although there is no difference in the salary of men and women in the population which is our Nile hypothesis we will for sure at least have a small salary difference in the sample so in our example several different results are possible the salary difference in the sample could be €50 it could be €50 or it could be €250 but remember the assumption is that in the population there is no salary difference now we will come to the P value in the first case the P value tells us How likely it is to draw a sample in which the salary of men and women differs by more than €50 in the second case the P value would tell us how likely it is to draw a sample in which the salary difference of men and women differs by more than €150 yes and in the third case the P value indicates How likely it is to draw a sample in which the salary of men and women differs by more than 250 our assumption for the population still is that there is no salary difference between men and women okay so what does that mean now let's say that you calculate the P value for a salary difference of 250 and you get the result that the P value is let's say 0. 03 the fastest way to calculate the P value is by using data Tab and I will show you how to do it in the following minutes so what does a P value of 0. 03 mean the result means that it's only 3% likely to draw a sample with a salary difference of €250 or more assuming that we have no salary difference in the population or to say the other way around it is only 3% likely that this sample is drawn from a population where the nalab hypothesis is true which means that there is really no difference between men and women okay so now the question is at what point can we reject the null hypothesis in order to answer this question we need to look at the alpha level also called significance level the significance level is always determined before the examination and it must not be changed afterwards for example in order to obtain the desire Ed results the significance level is usually set at 5% or it's set at 1% this is in order to ensure a certain degree of comparability so what does it mean now well an alpha level of 1% or below is called highly significant if we have an alpha level of 5% or below the result is called significant and if we have an alpha level of more than 5% % the result would be not significant finally we take a look at the definition of the P value generally the P value is the probability of The observed result plus even more extreme results if the null hypothesis is true so this might sound a bit complicated now so let's take a look at our example again what does it mean that the null hypothesis is true this means that we have no difference between men and women in the population regarding their salary and the P value now gives us the probability that we draw a sample where the salary of men and women differs by more than €250 although there is no difference in the population so let's say that the P value is 0.
03 this means that it is only 3% likely that we draw a sample where the salary of men and women differs by more than €250 if there is no difference in the sample and now I'd like to show you how you can calculate the P value with data tab for this example in order to do this please visit data. net and go to the statistics calculator in this table you can copy your own data now and I will use the example data now you can see your variable here and then you have to open the tab test and we want to analyze if the variable gender has an influence on the salary and so we simply click on gender and salary and now data tab will automatically calculate a t test for independent samples and in this table you can see the descriptive statistics and further below you will find the resulting P value if you like you can simply click on summary in wordss and data de will give you the interpretation of your results okay now you know everything about P value and how you can easily calculate it online with data tab if you don't know data tab yet just visit data.


![Confidence Interval [Simply explained]](https://img.youtube.com/vi/ENnlSlvQHO0/maxresdefault.jpg)


![One-Way ANOVA [Analysis of Variance] simply explained](https://img.youtube.com/vi/mOdYddj5IG8/maxresdefault.jpg)