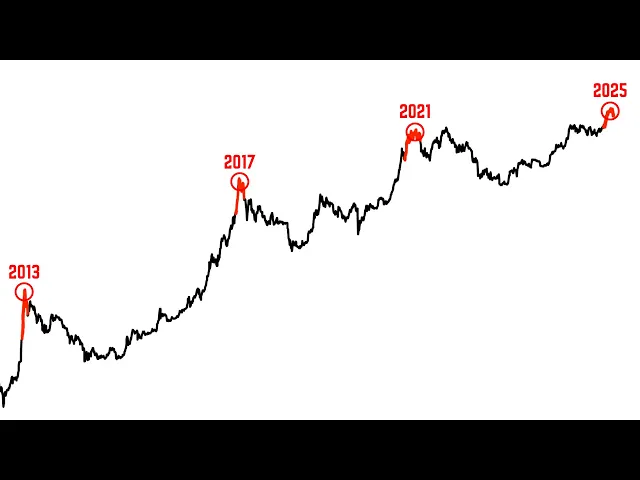
the total amount of money invested in Bitcoin ETFs has just crossed above $100 billion as major US asset managers are going on a buying spree of course as that's been happening bitcoin's price has surged above its previous all-time high and briefly going parabolic over the last few weeks we've seen this uptrend slow down a little bit but Bitcoin remains in a fiercely strong uptrend this is of course nothing new for Bitcoin rewind to February of 2017 Bitcoin crosses its previous all-time high at $11,000 and then proceeds to go parabolic going up by 200% over the
next 100 days again December of 2020 a new all-time high is made on bitcoin as it breaks above $19,000 and Bitcoin yet again goes parabolic yielding a 200% return over the next 100 days today Bitcoin has broken above its previous all-time high of $770,000 and it has already made a 40% move up within less than 50 days if Bitcoin were to make a 200% move move higher within 100 days that would make bitcoin's chart look a little bit like this so it is a good moment to be asking whether this is what's in front of
us now as a disclaimer we do currently have active trades on cryptocurrencies that we take our members through on our website we are proud to say that we've stayed exposed to cryptocurrency since August of 2024 we've now just closed all of the long crypto positions that we had on the website and we've actually shipped it to a net short position for near-term pullback on bitcoin we'll get into that later later in this video if you want to follow our exact moves when it comes to crypto make sure that you have a subscription to our website
when we take a look at a log scale version of Bitcoin we see a clear pattern price goes parabolic giving absolutely extraordinary returns that feel unsustainable and that's simply because they are the Bitcoin bubble then pops price declines aggressively retracing a big portion of the rally then Bitcoin begins to stabilize price then begins to base for an extended period of time eventually momentum picks back up again and price starts to go parabolic I think most people are very aware of this cycle that's repeating over and over and currently it's safe to say that we are
in the parabolic stage where Bitcoin is accelerating higher at new all-time highs the million-dollar question however is when and where this parabolic move in Bitcoin will end well bitcoin's rally today is being fueled by two key fundamental factors firstly the new US Administration has of course a lot more favorable stance on crypto currencies which can lead to a faster adoption of this technology and that leads us to the second fundamental factor which is the acceleration of wall Street's adoption of Bitcoin that is ultimately what is driving the price higher for example a recent report from
Black Rock the world's largest asset manager recommends a capital allocation of about 2% to bitcoin the total value of assets worldwide today stands at about $900 trillion compromising of real estate bonds boms stocks and a few other major asset classes like art and gold gold represents about 2% of the total value of global assets standing at a market capitalization of $18 trillion as of today bitcoin's current market cap on the other hand stands at about $1.4 trillion less than 10 times the size of Gold's market cap if the world were to adopt Bitcoin like Black
Rock recommends with a 2% allocation that would make bitcoin's market cap grow by a factor of 10 and an $18 trillion market cap for Bitcoin would roughly equal to a bitcoin price of about 1.3 million so yes there is a real bullish case behind the adoption of Bitcoin as a financial asset but that doesn't really help us understand if Bitcoin is going to be moving higher in the short term or whether we should be expecting a pullback right now by the way if you're looking to trade crypto make sure to check out buybit by clicking
on the link in the description down below they probably have the best trading platform in industry and it's the one that we recommend to our clients we also have an affiliate partnership with them so by trading on their platform you're also indirectly sponsoring our work to know what we can expect from Bitcoin today we can look at what happened to the price of gold when the first ETFs were launched the gold ETF GLD was launched in November of 2004 from that point on Wall Street institutional money could finally allocate a portion of their Capital to
Gold without necessarily needing to buy the physical medal of course of course we can see what happened looking forward for gold this marked the beginning of a major move up in this asset class with gold prices moving up by 300% over the 6 years that followed what's also interesting is that Gold's market cap was about $2 trillion when this ETF was launched in 201 2004 around the same size of bitcoin's market cap today so if Bitcoin experiences something similar to what gold experienced here which could mean that bitcoin's bull market can last multiple years with
many healthy pullbacks along the way up just like we saw with gold following the launch of its first ETF this is partly the reason why we think Bitcoin could be on the edge of pulling back a little bit here today Bitcoin ETFs own a total of 1.15 million Bitcoin and over the last couple of months that number has been steadily Rising by around 3,000 Bitcoin per day as we've had an acceleration of money flowing into these ETFs so if the number of Bitcoin being bought by these ETFs continues rising at the same Pace as they've
done over the last couple of months could be that Bitcoin makes another 50% move up over the next 50 days that is the good news for Bitcoin the bad news however is that a mere slowdown in the number of Bitcoin being bought by these ETFs could actually lead to a decline in bitcoin's price we saw that between March and August of this year ETFs were still buying Bitcoin but when we look at bitcoin's Price following March of 2024 it actually declined by about 30% March of 2024 was a great moment to actually be selling Bitcoin
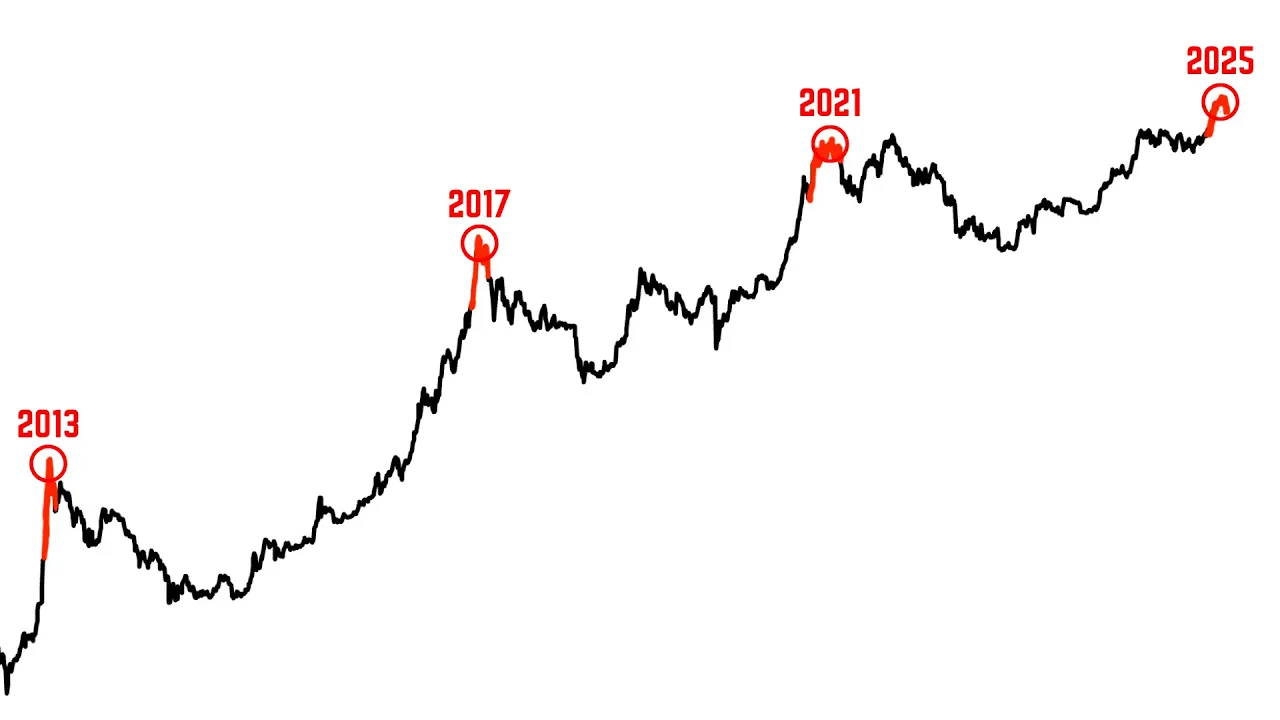
even though ETFs were accumulating them at a rapid Pace if you were a member on our service back in March you'll know that we closed all of our crypto positions or right here so why have we done this again in December of 2024 if we look at a short-term chart of Bitcoin we see that it's been forming something called a head and shoulder pattern this is a pattern that we often use to make trades on our website and it could be suggesting that Bitcoin is currently printing a local top in fact if we add an
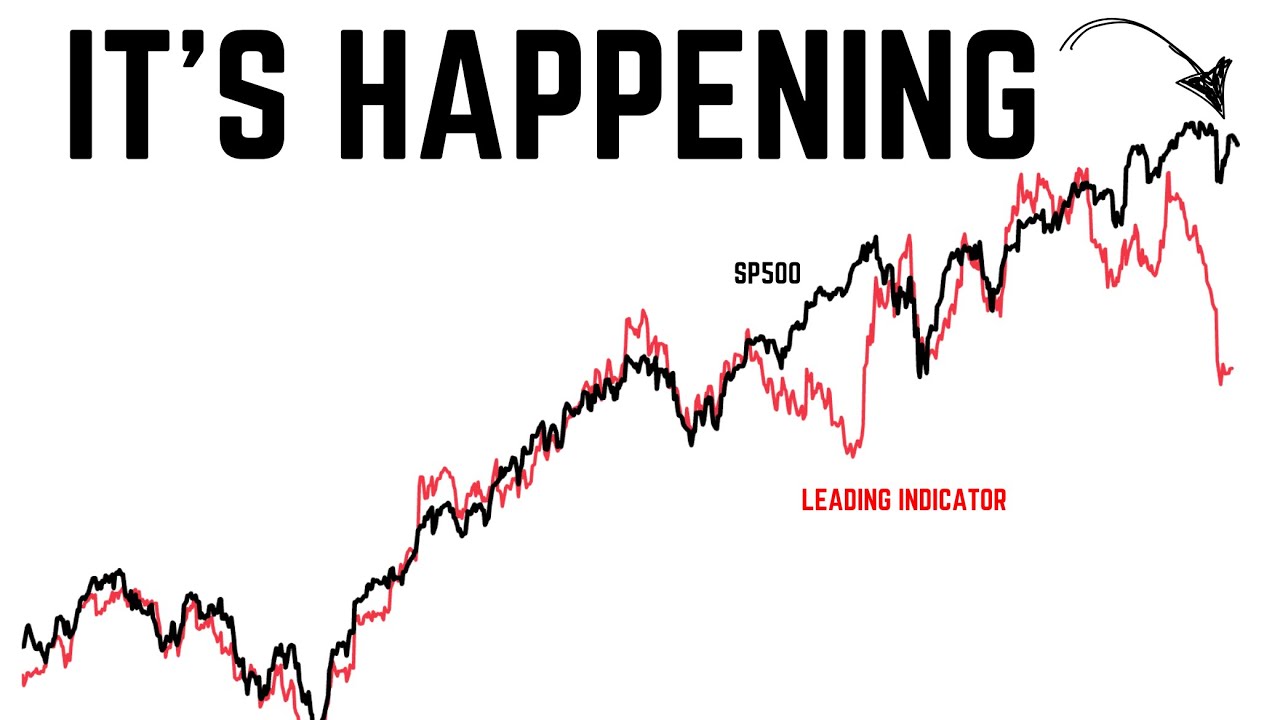
index that tracks the US Stock Market on top of Bitcoin we see that stocks have been in correction mode recently while Bitcoin has actually stayed quite resilient this is the opposite setup to the one that we were highlighting back in September of 2024 when the US Stock Market was making new all-time highs while Bitcoin was struggling eventually Bitcoin caught up to the stock market we think today it's possible that Bitcoin actually catches down to US stocks for a brief correction if it does we'd be looking to buy the dip at around $80,000 for the next
leg up on bitcoin's Bull Run just like with all of our trades we have a clear risk management strategy if price shows evidence of moving higher we may very well change our mind on the potential for a short-term correction that is the only way to trade crypto is to have a flexible and open mind that is why the trades that we've had on cryptocurrencies this year in some cases have yielded extraordinary profits but the losses in general remain quite small if you're not yet a member with us at Bravo research make sure to subscribe to
our website today