now this is the strategy that I use to become a consistently profitable Trader and it's the same strategy that the biggest hedge funds the biggest institutions Wall Street Traders firms Banks it's the same thing that all of them use and you think that this would be some extremely complicated strategy like there's almost some secret that they're hiding from you but the truth is the real secret is so dead simple that it's been hiding right in front of you this entire time okay so what is the strategy that I'm talking about well if you haven't guessed already it is the range and react strategy and this isn't going to be like most complicated YouTube videos that you watch on trading strategies in fact it's so simple that even a beginner could use it and it appears nearly every single day so let's go ahead and break down this strategy step by step I'm going to show you examples of Trades that I took using this strategy and that way you're going to be able to walk away from this video knowing exactly what to do the next time you sit down to trade okay so the first thing that you need to understand is that the market leaves Clues these Clues are specific levels that almost nobody pays attention to but once you see them you will never look at s the same way again for this strategy we're going to be using three ranges very simple this is all you need to focus on now those three ranges that we're going to be focusing on are going to be the previous day it's going to be the Asia session and then the London session now this is extremely important that you use the time windows that I'm about to give you you may have learned that Asia or London session are different times or you may look it up on Google and see different times but you need to use the exact ranges of time that I'm about to give you right now so for Asia you're going to go from 1,800 or 600 p. m. also by the way all of these are in New York time very important so for Asia you're going to go from 600 p.
m. the previous day to midnight and then for London session you're going to go from midnight to 6:00 a. m.
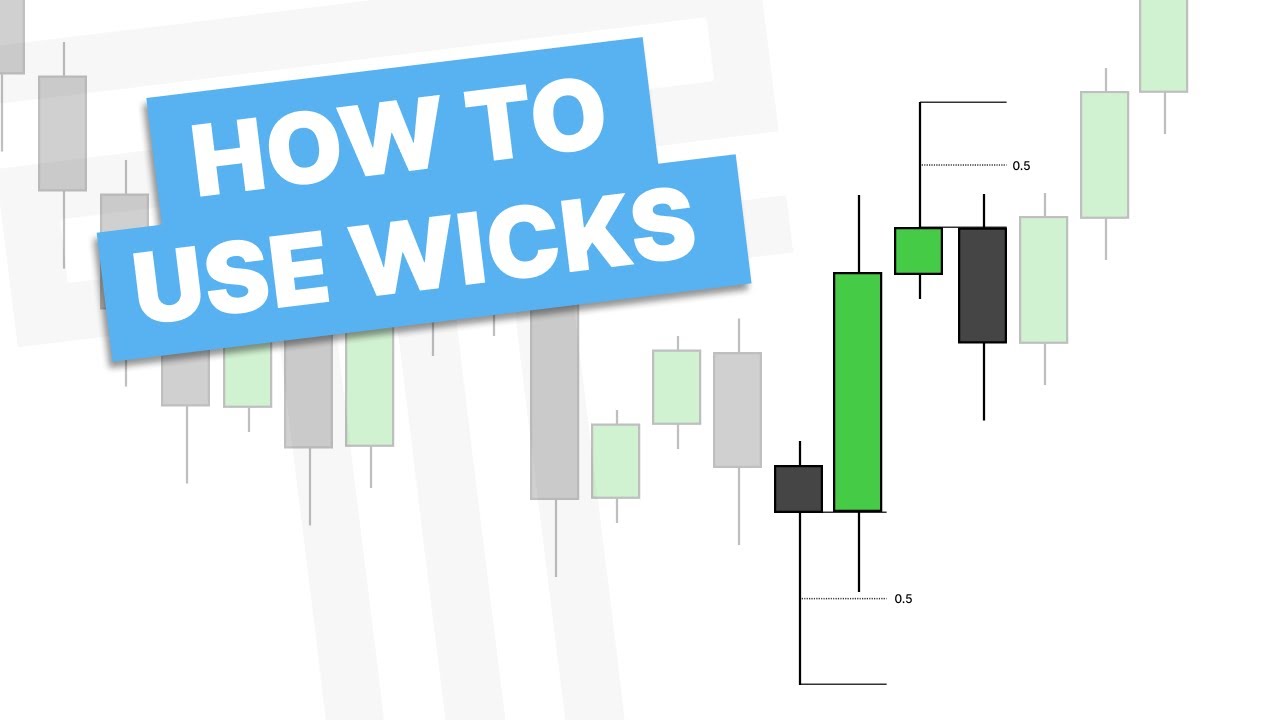
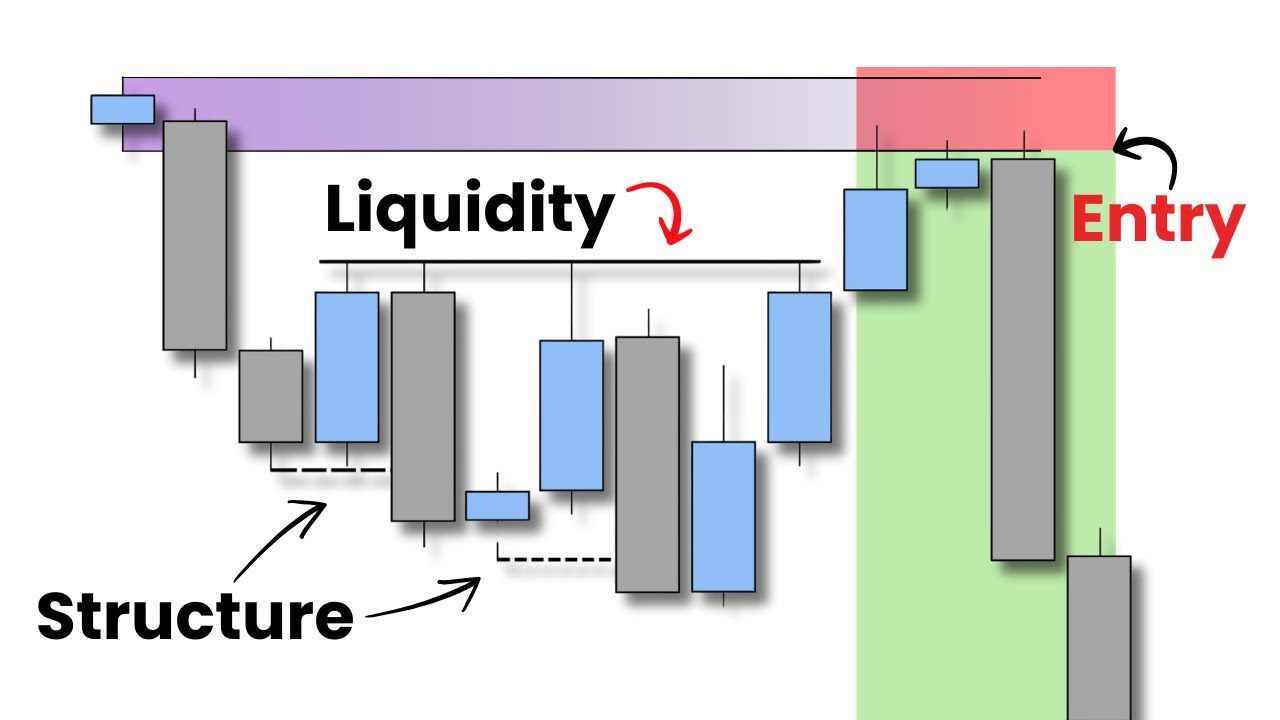
now the previous day is just the previous daily candle okay you don't need to use any specific times just go on the daily chart and Mark it out and we're going to break this down in a chart in just a second if you're not familiar with what I'm talking about now what you're going to do with these ranges is you're going to want to Mark out the highs and lows of these ranges so let's just say the market had been consolidating and price action was you know just moving back and forth and what you're going to do in the morning is you're going to Mark out you can use vertical tools or vertical lines on trading view um I'll show you how to use those in a second you're going to just put those vertical lines on the chart during those time windows so let's just say this was London this was Asia and then this was the previous day so what you would do at that time is you would take out lines and you would extend them for the highs and lows of each of these sessions so you would just want to Mark out the highest point and the lowest point during these time windows and the reason that we're using these levels is because the banks and very large Traders are going to be trading during these sessions and there's going to be a lot of liquidity on either side of the range what I mean by that is whenever people enter let's say during the previous day let's say the day was consolidating or Asia session or London session or whatever it is when they enter the market and the market was consolidating they're going to put their stops under or above those levels when the market hits into these levels a lot of people are going to get liquidated or their positions are going to be closed when the market hits any of these levels not every single time it's going to react but when it does we can have a very high level of confidence that that reversal will be a true reversal that's actually going to yield a trade opportunity I mean look at these levels in the way that the market reacted to them and know this isn't just a price example of some random chart this is actually a trade that I took on that day if you see right here November 12th and then if we go back to here this was on November 12th this is one of the strategies that we're going to be breaking down later in the video and that way you're going to be able to see exactly how this strategy works also guys I made this free downloadable board I'll leave the link down in the description this breaks down all of the rules to the strategy explains all of the Concepts and gives you even more examples that way whenever you're going to trade you don't have to keep coming back and rewatching this video you'll just have this whole guide right there at your fingertips so go ahead and download that using the link in the description all for free now if you haven't realized already what makes this strategy so powerful is that it removes the stress and the confusion and the guessing game of trying to pick which levels to trade from because you see at the end of the day all trading really is no matter what style of trading that you're doing is is picking the correct levels and then having a mechanical way to trade reactions from those levels that is literally all trading is what most Traders do wrong is they want to pick out every single level on a chart and their chart ends up looking like a laser show and then when the market hits into it every single thing that they see they think is a trade but with this strategy you're going to have a mechanical way of selecting which levels because no matter if you're a beginner or if you are new to this whenever you plot a range in time you say hey between midnight and 6:00 a. m. what was the highest price and what was the lowest price you can't argue that meanwhile if you say you know Mark a support level or you know Mark a specific liquidity level or all these different levels that people use in different kinds of trading that's where it becomes a guessing game and that's where most Traders stay on a hamster wheel forever just picking random levels on a chart but this strategy gets rid of all that for good and when you come sit at your desk you know exactly what you need to do this is going to be a game Cher for any Trader who is stressed or over welmed or feels like they just don't know what to do when it comes time to trade so we're going to eliminate the guessing game that most of you guys are stuck on what is making most of you guys unprofitable now the next thing that we're going to talk about is the timing and the timing is extremely important so we're only going to be trading this at one time of day and this also makes your trading mechanical it's also going to give you back a lot of your time because if you're anything like I was whenever I was learning to trade you probably sit in front of the screen all day long and know this is not what you should do in fact most of you guys started to learn how to trade because you wanted more freedom yet you end up being a slave to your charts and not only is this just not time efficient it also becomes very stressful you have this mental health bar so to speak that you know this health bar you only have so much in it and every time you sit there in front of your screens for hours and hours this health bar is getting depleted slowly but surely and eventually you're going to get to a point where it's empty and you can't just sit there all day and expect to have a clear mind and make good decisions so we're only going to trade this strategy for 90 minutes so this is going to be 9:30 a.
m. to 11:00 a. m.
and remember all of this is in New York or Eastern Standard Time so what you're going to want to do at this time is you're going to wait for one of the levels to be hit so once one of the levels meaning the highs or the lows of Asia London or the previous day once one of those is hit that is when you're going to go into the one minute chart or the M1 for short so the one minute chart this is the only time frame you're going to use to enter using this strategy it's super important you follow exactly what I'm about to teach you to a te before I show you how to enter these trades if you want to actually trade these live with me then go ahead and click the link in the description to become a funded Trader in 12 weeks guaranteed or I'll trade with you for free until you do again that link is down in the description all right so this is how you would Mark these times out so let's go ahead and go through and I'll actually do this with you so you can see it done live so you're going to use trading view for this now the tools I like to use you go up here to the top left go and click vertical line you can also hit a favorite here and this will give you this really cool bar maybe you already knew that but if you didn't it's pretty cool helps you save a lot of time so what you're going to do is you're going to get that vertical line and you're going to want to go ahead and Mark out the times we said so you would want to go to 1,800 which is 6: p. m. so you'd go right here 1800 then you'd go to midnight right here and then you would want to go to 6 a.
m. so remember midnight to 6:00 a. m.


![Intro To TTrades Fractal Model [Indicator & Settings]](https://img.youtube.com/vi/CqMIh-Vvhbg/maxresdefault.jpg)