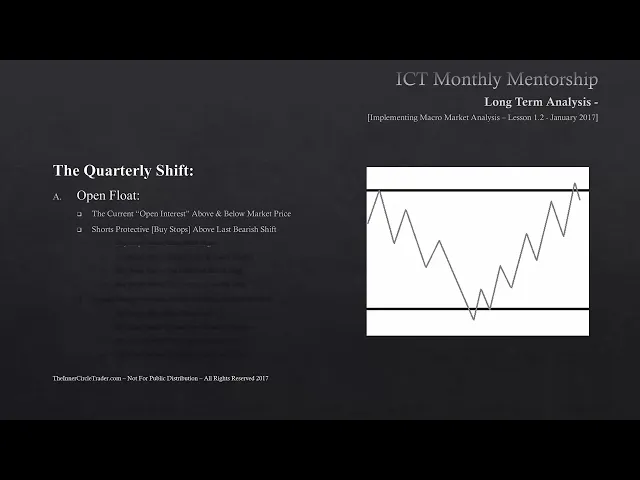
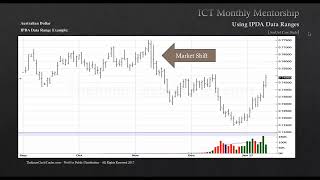
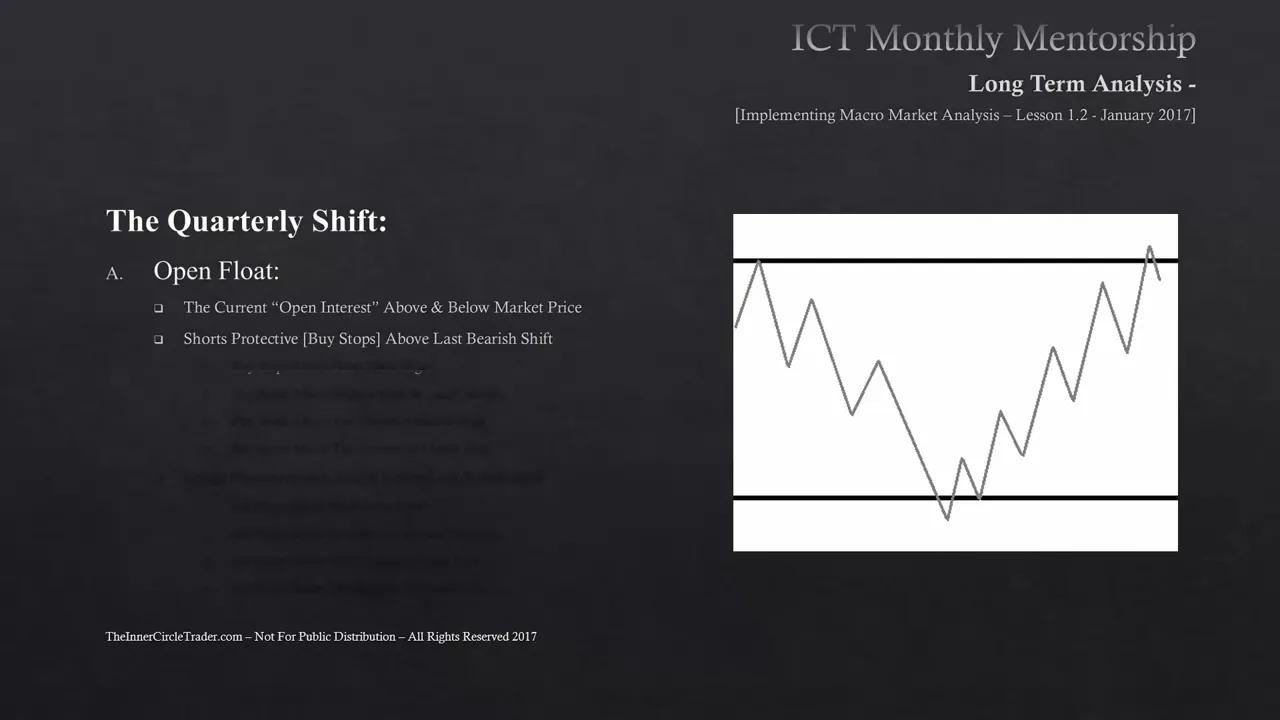
okay folks we are looking at lesson 1. 2 of the long-term analysis implementing macro analysis quarterly shifts and open float okay we're going to be talking about open float on this teaching okay the quarterly shift with open float and let's first start by defining what is open float the open float is the current open interest above and below current market price now this is going to be in the form of pending buy orders in other words buy stops that are resting above old highs or it could be just resting above market price doesn't have to be old highs and sell orders it could be below the market price by very little bit in terms of pips or could be below significant lows there are open interest in the form of sell stops for entry orders and sell stops for collapsing long positions and there are buy stops to get along and then buy stops to protect short positions all of those are equating to open float it's the total open interest of the players that are in the market now or hope to be depending on where price goes relative to those standing orders okay when open float is used to determine buy side liquidity shorts use protective buy stops above the last bearish shift buy stops above short-term highs that could be in the form of a weekly high or a monthly high five stops above the highest high in the last three months buy stops above the current six-month high and buy stops above the current 12-month high now don't be discouraged by hearing these numbers because you can be really close to the 12-month high for a long period of time and never really get to it um when i first remember reading about this type of idea the range for the 12-month high and low i thought to myself you know it takes 12 months to get back to that level and that just shows how myopic my viewpoint was when i first started trading the 12 month high and low you can be inside that range for a long time near the high or the low it doesn't take that long to get to it so some of the new traders that usually send me emails they ask me how often do i trade 12-month highs and lows well you could see a 12-month high or low pretty quickly yeah it depends on what the range is in your market the same thing is said for a six-month high the one we're going to focus on here primarily is the buy stops above the highest high in the last three months because we're looking at the quarterly shift that's going to be a very significant price level where buy stops will be resting so every three months you want to be noting where that high is and there's going to be buy stops definitely most likely getting targeted if we have a market structure shift bush and they're going to be aiming for those buy stops above the three-month highs any run buy stops above a short-term high which is a monthly high or a weekly high that's going to give us a strong prognostication for short-term volatility as well when we're looking at the sell side of the liquidity long to use protective cell stops under the last bullish shift cell stops below short-term lows that can be in the form of a weekly low or a monthly low sell slots below the lowest low in the last three months sell slots below the current six-month low and finally sell stops below the current 12-month low now one of the questions i get a lot and i get it actually sent to me by email even in the free members area from my website and on youtube when i talk about running stops or if i talk about turtle soup false breaks above old highs or false breaks below no low the question always comes up is how do i know if the market's going to stop just right above old high or below and low and then reverse or keep on going and i'm going to teach you the ideas that i use to get to that conclusion uh what what gives me the conviction that builds the confidence on believing that it's just going to punch above an old high and probably not continue going higher not by much in other words and then retrace and probably offer a shorting opportunity the same thing is re reverse for buying an old low once it's been violated okay this chart is basically outlining the same levels that we had for the quarterly shifts and every three months the intervals are shown here i kept the majority of the vertical lines off i just use those segments to delineate what those reference points would still be relative to date and i want you to take a look at this chart for a minute focus and study on it and if you can pause the video for a couple minutes and note significant price highs and lows obviously you can see the one that's here and the low down here so we have two pretty significant runs above an old high and below an old low i want you to draw your attention to this short-term low here when price traded below that low that was a break in market structure okay so we had a market shift below that low and the market continued trading all the way down until it got to the 105 30 level whenever we see the bearish shift lower in price your eyes need to go right to the high it just came from because on a daily chart that's going to have a lot of liquidity above it that liquidity is in the form of a liquidity pool for buy stops the folks that were fortunate enough to be short from that old high trading down into 105 34 their position would have a run on the buy stops that's residing holding on to a long term position now you're probably asking yourself what retail trader in their right mind would have a buy stop on a short held on that long just to see it kamali back up there and get knocked out well again the market's not trading against the retail traders it's trading against the large liquidity offered by the big funds because funds are traditionally long-term trend following traders these reference points on the daily time frame are going to be salient to understanding how open float has a big impact on where future price movements are going to take you as you can see here after creating a low of 1. 0534 market does in fact have one more market structure shift and sends price higher pay attention to the quarterly shift markers that we have here every three months there is a significant run on liquidity the move off of the 105 34 level has a break in market structure then you can see the subsequent retracement back to the short term high and then price rallies away fills in the liquidity void from october retraces back down into the 108 60 level then rallies again then ultimately making a run up for the buy stops above the 1 15 big figure that market structure break there bullishly is the catalyst that sends the market higher to make the stops above 115 big figure targeted below that low there's going to be a large liquidity pool on the daily time frame again it's not for retail traders it's going to be for the large funds because there was a significant displacement among many months about six months or so the market rallied from 105 34 to 1 115 70s or thereabout so it's a pretty significant move for the euro dollar there's going to be sell side liquidity or sell stops in the form of a liquidity pool below that low you see price did in fact sweep down there and grab that liquidity neutralizing all the cell stops so let's take a look at what takes place and how we can use open float and help answer some of the confusion you have about why the market should be expected to go a certain level and then retrace or reverse and how we can look forward to one side of the market being predominantly controlled and staving off any continuation after the move blows through an old high or below an old well as you see here we have a short-term high here rate before the market runs through that that retracement back down into the 107 50s the buy stops that would be resting above that high they're targeted and the market runs right through that and also fills in a liquidity void to the left from october then the market retraces deeper and then we have a short-term height that was created by that rally above taking the buy stops out that short-term high eventually gets ran out as well making a run on the buy stops that will be resting above that now what buy stocks will be wrestling about that people that want to sell short every time price makes a impulse price swing there's always invariably going to be orders that want to be selling there and they're going to be sometimes short positions funds will go in and start working their positions in early and sometimes they get knocked out and that's what's happening here many times you're seeing that same phenomenon you end up going through it's just going through a larger scope in terms of order size and finally making a run on that 115 big figure clearing out the buy stops above the previous october high now i'm going to draw your attention to how do you know when the market's going to reach for one side of the liquidity or the other notice while the market was trading from the low at 105.
34 all the way up to 115 big figure there wasn't any significant move on sell stops at all they were driving price up to take the liquidity out at 115. once that liquidity was taken out in the form of the buy stop raid at 115 big figure the market broke down and created a violation of a short-term low that short-term low had trailing cell stops resting below it those cell stops would now would be violated and canceled so any longs would be knocked out at this point now you need to be paying close attention because this is where the rubber meets the road this short-term low and that run on the cell stops right below that low here you want to draw special attention to that right now because this is your first clue that we are probably going to work the sell side of the liquidity we don't know it at the time when it first forms we have to start watching what price does we already know we have a strong rejection above the 115 big figure and we've came a long way from 105 34 with none of the cell stocks taken except for this one here now we have a short term height that's violated just briefly but my question is is that short-term little violation above an old high is that making new ground for new highs no it didn't even challenge the old high but look at the strong rejection right above that high it creates another lower low so this short term low right here also sees its liquidity in the form of the cell stops ran out as well my question to you is this at this moment right now it's at the midway point or equilibrium between the 105 34 and the 115 big figure the chances of this creating a higher high where we're at right now relative to the 115 big figure is not likely not because it's hindsight and it's right in front of me but because it's showing indications that it can't create new ground once the buy stop side of the liquidity is taken but it's creating new lower ground every single time a short-term low is violated it gathers up more momentum and gathers more distance between the range of 115 big figure and 105 34. so every time it drops it drops a little bit more but every time it rallies it fails to make a new high even if it takes a short-term high out it's not gaining any more ground on the upside every rally is being distributed we have a short-term high here as well and those buy stops are ran out as well same question does this rally above a short-term high create a new high no it can't even get above the previous failed attempt to make another higher high at the 114 big figure then once again we have a rally through an old high does it gain new ground no but it's quickly rejected and trades lower and then violates two times it goes below the 109 10 level once briefly before running up and taking that run on 112 95 and then rejecting that level after taking the buy stops out and making a run for another pass through the 108 50s this short from this high at 1 12 95 was on the heels of the u s elections we saw a strong dollar and the market quickly rejected all of the rallies in foreign currencies the movement below every short-term low and gaining more ground on the downside that's the indication you look for regardless of whatever time frame you're trading but on the daily chart you're looking for clues that it wants to gain more momentum on one side of the market or the other you're going to reference where the buy stops are available highs and where the sell stops are below old lows but what you're watching for is the tug of war that takes place between each new run on stops below the market and above the market if you notice where the intermediate term highs are if intermediate term highs keep creating lower intermediate term highs and enemy term lows and short-term lows keep going lower each time it's telling you that it wants the open float below the marketplace in other words it wants to seek to sell side liquidity it's going to draw lower so now think about what this has done for you it gives you a directional bias on the daily chart and it takes a long time for these moves to take place but once you're studying price and you look for these clues across many pairs and many asset classes you'll see that this is in fact what leads you to daily chart directional bias which also will serve you very well in other disciplines of trading whether it be day trading scalping short-term trading or swing this will give you what you're looking for in terms of how do i know what side of the market it's going to make the run on is it going to run the buy stops or it's going to run the cell stops think about what time frame you're looking at here this is a daily chart if the daily chart is indicating that it wants to run lower because it has no problem getting down below short term lows but every rally has a failure to make new ground and can't make a higher high when it does make a higher high it's punished immediately but the high that it makes is always just above a short-term insignificant high every time it does this it solidifies a intermediate term high that is now lower than the previous intermediate term high an intermediate term high is any high that has a short term high to the left of it and to the right of it think of it like a head and shoulders top formation every time you see a enemy term high that has a lower enemy term high to the left of it and enemy term high to the right of it that's actually a long term high in the middle again think like a head and shoulders pattern now invert that and you'll have the same thing that would be said for an immediate term low or a long term low once you see that in price you'll actually see the market structure that i actually learned from studying larry williams as a new trader you can see the market structure in this entire sample size of data it's multiple intermediate term highs and long term highs that are significantly signaling that the market in fact wanted to go lower there was a liquidity void around the 106.
80 level to 106. 35 it filled that in when all the way down to the short-term low at 105. 34 bounce a little bit there and then ultimately once breaking that low at 107 big figure it reached down below to take this outside liquidity out now when you study the daily charts like this you can look at a lot of examples but they require time and unfortunately they don't give you a lot of turnaround time for study but in hindsight you can go back and look at a plethora of really nice trading examples where you can see where liquidity was ran on one side the market was drawn up for three to six months okay look at the move from the december low of 2015 up to the high made in may of 2016.
it's about six months then the move from that high in the spring of 2016 it traded all the way down to a low made in december of 2016.