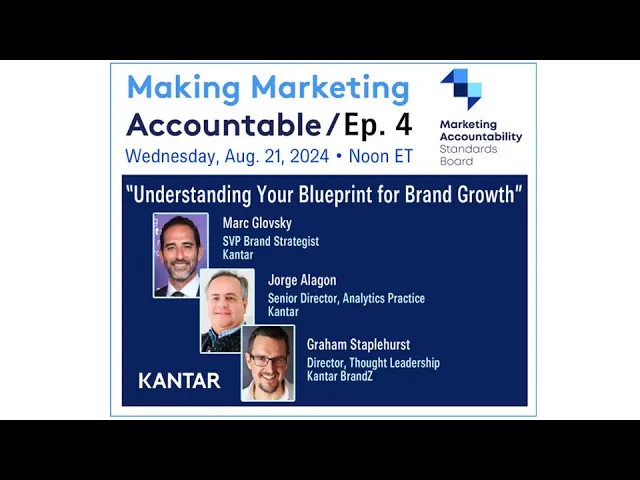
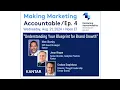
Hello everyone my name is Frank Finley I'm the executive director of maby I'd like to welcome you to our newest installment of our making marketing accountable webinar series we have a wonderful presentation for you today on uh understanding your blueprint for brand growth I am very happy today to have uh with us not one not two but three speakers So all three speakers are extremely talented marketing analytic experts from canar uh and they will be giving us both an overview of their new blueprint for brand growth and also providing a deeper dive into its empirical
underpinnings so please welcome from canar Mark glovsky senior brand strategist Jorge aligon Global head of data science Innovations and Graham staplehurst Global thought leadership director director so gentlemen the podium is Yours excellent thank you Frank uh thank you and welcome uh and thank you to the marketing accountability Standards Board for this great opportunity as Frank said my name is Mark glovsky I'm a senior brand strategist at canar based in the US and as he mentioned I'm here with Jorge alagon and who's a senior director in our Global analytics practice and Graham who's a senior thought
leader in our brand Z space practice today we're going To be talking about blueprint for brand growth which is an evidence-based framework that helps marketers focus on the key drivers and barriers of brand growth in a complex environment that we're all in the framework based on extensive research we've conducted across a wide array of categories markets Brands and time using attitudinal behavioral data at scale we'll present for approximately 40 minutes give or take we're going to Leave that 15 minutes as as Frank mentioned for a live Q&A at the end next slide please and here's
what we're going to cover today first I'm going to introduce you to what the blueprint is it's an extensive work that's been done to the extensive work that's been done to derive it the core principles that underpin it there's a primary growth driver and three growth accelerators that we're going to talk about and the Implications for CMOS and Brands who look to leverage it forand Graham are then going to present the key evidence that supports blueprints growth principles that emphasizes the need to have more of something beyond the size of your brand to deliver competitively
Superior GR growth then again we're going to wrap up with some Q&A all right so what is the blueprint well let's start by defining what we're looking to explain with a Blueprint and that is how Brands as malleable assets that companies curate and Steward help those firms capture more than their fair share of a given Market's available revenue and profit irrespective of the market conditions this growth matters to the Brand's Chief stakeholder ERS that's both Mo owners of the brands as well as investors who want to see a return on their investment for the first
time canar has Conducted a metaanalysis of the world's largest attitudinal database about what people think and feel about brands from our brand Z database with the largest behavioral database about what people actually buy from canar World panel all using our IP the meaningfully different in Salan framework specifically we took 5.4 billion attitudinal data points over 20 for over 20,000 brands in hundreds of categories across 54 markets and 1.1 billion purchase data points for over 20,000 brands in 100 categories across 25 markets in addition we utilize various other data assets including our world panel comtech usage
panels as well as brand Dynamics which provides us with daily brand signal and our extensive normative databases from our link and lift work in the creative and media spaces as well as incorporating publicly available sources to enrich our analyses even further and our analysis techniques varied widely Employing everything from Ai and machine learning to multivariant and time series analysis tailored to the specific data and research questions at hand and our data scientists and other canar experts analyze the results this comprehensive approach approach allowed us to analyze every category and sector imaginable from fast-moving consumer goods
to longer term purchases to services and even B2B markets most importantly these analyses Were longitudinal in nature over a period of 10 years in fact and this enabled us ultimately to deduce what drives true sustainable business growth and we spent all of that time and Mark Twain the learning from our analyses to write a short concise set of to to still it down to a set of short concise growth principles that we call the blueprint for brand growth and here it Is first and foremost to drive share you need to attract more people to build
penetration that's pretty simple how do you attract more people well by being meaningfully different to more people being meaningfully different to more people increases the probability of future growth and allows you to charge and maintain a price premium so being meaningfully different to more people is a growth driver it's your strategic growth driver CMOS can leverage and can Operationalize this strategic growth driver via three accelerators which are interconnected firstly predispose more people what does that mean that means increasing your probability of purchase by strengthening the predisposition everyone in a given Market has towards your brand
through their exposures to it and experience of it this is about being Salient and relevant in key decision moments secondly it's about being more present what does that mean that means Maximizing the conversion of the predisposition you've built toward your brand as well as capturing choices from those predisposed to other brands by optimizing marketing investment in the customer Journey your distribution your range your pack your pricing and activation and last but certainly not least is about finding new space as another accelerator future growth can't be left a chance depending on the category and Brand maturity
that your brand sits in redefining the business that you're in so you can optim optimally stretch into new motivations occasions categories and services so that you can keep growing next slide please so let's dive a little further into each of these growth principles to drive penetration you need more people we found that the best correlate with higher penetration was how meaningfully different your brand is these measures identify Stronger functional and emotively meaningful Connections in areas of perceived relative relative difference so why do we put this first well we found that if you have high meaningful
difference five times as many people will buy you in a given time period versus those brands that are least meaningfully different even more importantly it gives you a better chance of significant future penetration growth which we Define as more than 1.2% Gram's going to get more bit more into the evidence in a moment so driving penetration is not just a numbers game people's attitudes toward your brand matter category context and brand size are key starting points and using this framework can help you identify who you want to serve what their needs are and how many
people you need to recruit to reach your growth ambition to be meaningfully different to be sorry to be Meaningful to more people that you've identified a branch should be designed to meet the needs that matter most to those people this could mean embracing a range of consumer needs and the physical emotional functional and social Realms as well as other ways that Brands work in consumers minds and lives and there's no one way to be relatively different this can be achieved in many ways Bea product superiority Ownable distinctive assets demonstrated category leadership or just being seen
as a unique expression within the category so what do CMOS need to consider if they want to be meaningfully different to more people and embrace this strategic growth driver well first Factor difference into your brand positioning and strategy it is the fundamental reason that brands have value for business and means brands are strong and resilient two use meaningful Differ to convince your board to invest in brand brands with higher meaningful difference have many Financial advantages over competitors they justify brand choice and the price paid they mitigate the risk of substitutability this ensures that you're well
they're well connected to many usage occasions which increases the likelihood of future penetration growth third measure and optimize your sources And degrees of difference this is about maintaining a consistent relative Edge over Alternatives within the category you operate in four have a distinctive view of difference and distinctiveness they are two a holistic view rather they are two sides of the same coin physical points of distinctiveness trigger mental associations of how the brand differs from Competitors and Fifth and finally think strategically there are many routes to creating differentiation and you should explore all of them individually
and in combination to be as effective as possible and you can very simply operationalize the blueprint using what we call starter grids starting grids there's a very specific starting grid for each of the growth driver and the three growth accelerators which I'll get into a bit more in a moment the purpose Of a starting grid is to help build an understanding of the next big questions you should be asking for the be meaningfully different to more people strategic growth driver we just discussed we map a Brands meaningfulness against their relative difference to determine if we
need to further explore the meaning or the difference of the brand brands that are different but lack meaning need to break through that growth ceiling by broadening the scale Of their appeal and avoiding become to becoming too Niche or Specialists conversely brands that are meaningful but lack difference need to find ways to stand apart it's likely that today they're successful in meeting broad category needs but stronger predisposition can be built by cultivating perceived relative difference on the things that matter this will help insulate against the continual threat of disruption in the Category Graham's going to
show you some more examples of starting grids in practice shortly but do know that if you score highly on both of these metrics we would encourage your organization to apply their focus to the three growth accelerators first predispose more people as the first growth accelerator you need to increase the probability of purchase by strengthening the predisposition everyone has towards your brand this requires you to invest in Exposures and experiences that make your brand mentally available and meaningful meaningfully different to more people canar data shows that brands that people are strongly predisposed to have nine times
higher volume share command twice the price and have four times the likelihood of value share growth than brands with weaker predisposition predisposition predisposition should not be misconstrue as loyalty lots of data sources are out There including our own that show that loyalty doesn't really exist however canar data does show that you can stack the odds in your favor to give people a positive bias that gives you a your brand a head start that's predisposition and there are two types of predisposition there's predisposing more people to buy you and there's also predisposing a person to pay
more for you than Alternatives in the category think about your own buying Behavior There's some Brands you consider and others that you don't and you don't always buy the cheapest brand in the category the way Brands build predisposition is through all the interactions and touch points that they have with consumers these interactions can be summarized as exposures and experiences so invest in your brand value highquality creative that's consistent over time and allocates your Me and allocate your media effectively across your markets and categories assess Effectiveness across touch points for both shorter and long-term objectives also
your pricing Strate strategy needs to capture the full value of your Equity promotions can destroy value so use with caution to drive trial and volume expansion only when needed instead use pricing architecture to create the right choices for your consumers and last but not least Experience is an underutilized predisposition Builder meaningfully different experiences which are aligned to a clear brand positioning create consistency and connectivity that helps reduce churn and Exel accelerate acquisition next be more present be more present is all about optimizing your marketing investment in distribution product range pack pricing promotions and the other
activities that ensure that you have the right Availability and visibility to convert all that predisposition that you've built and capture choices from other brands it's more than just bottom of funnel or physical availability in fact we found that brands that are always present attract seven times more buyers compared to those present on just one half of buying occasions and there's always room for improvement in fact only 5% of brands have a category presence of over 80% and being more present can come in many forms from the streaming service that benefits from being on top of
your menu list your phone's home screen and as a prominent button on your new TV remote the bank that offers service hours that fit your needs the distribution shelf space and optimal r for your daily daily food and beverage choices and all at the right price that can be justified by your brand associations as the landscape becomes Ever more diverse it's increasingly critical for Brands to be present where the choices are being made big Brands grow by offering more choices than their closest Rivals the right range is an essential component of their presence additional SKS
and varieties will help reach different buyers and occasions it also helps them to stand out smaller Brands usually gain more from focusing on availability of the existing range and irrespective of brand size your Brand needs to trigger the right mental associations that connect the buyer of their to their predis predisposition toward your brand so strong distinctive brand assets Aid in that endeavor finally make it easy to complete the sale by removing as much friction points in all channels as possible manage your transactional customer experience online or offline across the whole purchase cycle so you can
anticipate and predict consumer needs preventing your cons Customers from spending with your competitors and finding new space our third growth accelerator is all about finding incrementality the motivations the occasions the categories the services for your brand to stretch into wi in these new spaces through meent meaningfully different Innovation expanded distribution and communic we found that brands that stretch into more incremental usage or consumption occasions have doubled the chance of Growth versus those that don't in fact stretching a brand to cover 10% more of a categories available needs and consumption moments leads to over 17% brand
growth think of travel apps offering bookings on of onlocation experiences or easy access to Mobility Solutions or garden centers offering services around Plant care for those without green fingers or a beer brand that offers Non-alcoholic and low carb options or a digital taxi service that expands into grocery delivery challenge the definition of the category you're in most category definitions are product based meaning Brands fail to understand the emerging needs and occasions you could serve and are unaware of alternate Solutions people use to satisfy their needs today knowing which demand moments exist and their in anticipated
future growth Will help you find new space so understand category context to see if new space really is the best growth opportunity for your brand immature categories allow your brand to benefit from category penetration increases and the development of new habits while mature categories have reached their potential and habits are fully formed so leading brands have to find new space to maintain growth your brand size today determines where you can most easily Find new space those smaller brands s need to disrupt default buying behaviors in order to steal existing buyers from bigger Brands and bigger
competitors in fact our Shopper data shows that smaller Brands get about 80% of their incremental growth through this uh stealing of existing buyers conversely bigger Brands only get about 10% of their sales that way and are much more reliant on existing buyers buying more frequently and getting new People to shop the category altoe so for them bigger Brands growth necessitates breaking boundaries pushing the definition of the category spotting the peripheral and future needs and stepping up to address them this is the blueprint for brand growth I'm now going to hand it over to Graham and
Jorge to walk us through even more of the evidence behind the framework Graham thank you Mark well Mark has Presented you with a lot of facts to support the statements and metrics that we've built into the blueprint for brand growth Jorge and I are here to explain a little bit more about how we arrived at these facts and the evidence behind them now Mark's already mentioned how we took our data from a wide variety of internal sources our brand e Global brand Equity studies that are based on a wide range of attitudinal measures our world
panel consumer Behavior data uh that covers Actual purchases and consumption and more all our analysis has been about matching up attitudes and behavior for the same brands in some cases we're fortunate to have single Source data where we can s survey the attitudes of individual consumers and also observe their behavior afterwards in other cases we've matched the data sets for the relevant time periods now we can't show you everything that we found less useful or unhelpful in this short presentation But we will try to illustrate how we've arrived at our key conclusions through analysis and
at the heart of the blueprint for brand growth that Mark has described is the meaningful different and Salient framework that was developed by canar from work in 2011 to to 2012 across hundreds of Brands and we used a reanalysis of existing s survey data and a whole heap of experimentation and piloting and it's certified by mb's marketing metric accountability protocol Now there are three elements to the framework empirically derived through an exploratory and rigorous R&D process to understand which brand associations drove Behavior the blueprint emphasizes meaningful and different first the orange and blue segments here
because they're the foundations of your brand perceptions they are what exists in the consumer's Minds salience is there to amplify extend to remind consumers and ensure that those perceptions are Readily available in mind at the point where a brand Choice has to be made the intersection of these three elements and that can be with or without significant conscious mental effort so how did we get to those things well we used five survey questions as inputs to create three orthogonal factors meaningful different and S ient the math behind this ensures that each factor describes its own
quality of those brand perceptions with as little Overlap as possible and what's most important is the context every question that we ask is relative to competing brands in the categories so we present people with the brands that they would have as choices and we ask them to to rate or rank um each of the brands on these attributes in turn because this model is all about those choices it's trying to explain and describe why people choose one brand over another now putting those meaningful Different and Salient metrics together gives us four powerful value based metrics
all these different forms of value are connected and the value can flow from one aspect to another if I start on the left demand power that's a measure of consumer demand for the brand which gives us a prediction of the Brand's volume share based purely on perceptions it correlates with market share although it doesn't have activation factors built into it pricing Power at the top is the ability of the brand to justify a price premium relative to the category average again based purely on those perceptions so on average brands with higher pricing power can charge
more as we'll soon come to activation power on the right is the strength of the brand at converting that predisposition into actual choices because Brands not only need to be easy to mind they need to be easy to find and the right connections between the brands Mental associations and the context when consumers are making decisions those things Mark talked about price availability appearance and so on ensure a positive flow of value to the brand and future power at the bottom is the probability that the brand will grow its value share in the next 12 months
based on current perceptions and brands with high future power are of course more likely to grow than low future power Brands so here's an example of one of These um I'm going to show you an example for Walmart um so Walmart's demand power index I'm getting a time lag on this I'm hoping here we go right Walmart's demand power index of 289 means it should command about three times or 300 index points the market share in grocery of the average usj and it's driven by being meaningful different and Salient but the importance of each component
in creating demand power will vary across categories And in each country here we can see the proportionate impact of each factor meaning for contributing 35% difference 15% and salience the remaining F the 50% but in another country we'd see that the impact uh on um growing your demand power will vary finally the last set of bars shows Walmart's performance as an index relative to the average brand in the category and we can see how strong it is On the most important Dimension here of s salience because you can hardly go down a Town Center or
a shopping center in the US without encountering a Walmart and now over to Jorge hey so I'm going to get a little bit deeper on the DAT data that um or or on the evidence that supports the blueprint so the first uh slide that I'm going to show you it talks about 5x that we uh that we mentioned earlier for this we were able to match um 1,62 brands in And in a lot of projects in categories and basically uh in a good cross-section of countries across the world and these uh include you know from
F fmcs to services to long-term purchases and when we analyze these behavior and perceptual data and we group those U brands that have high demand power at the top tertile and compare that to low demand power you know in the bottom Turtle so in the bottom 33% versus the top 33% we see uh At this 5x where it's coming from so we see that uh brands with high demand power capture 15 points of penetration on average versus those that have only uh low demand power they only have 3% so that's the 5x where it's coming
from right so this is just uh a quick proof of how Equity drives or it's related to actual penetration going Beyond this uh we can also do the same thing but uh with market share so what you see here is the Market share in terms of volume for those same PA tiles and you can see that in this case the multiple is nine times right so brands with higher meaningful difference and sence with high demand power capture a lot more volume share today so as all of this is uh related to to to choosing the
brand but the other aspect is does your brand sustain uh a a price the price that you're wanting to pay or do you wanted To charge for so um what we are showing here is how much people when we group them into tertiles of pricing power relates to the actual price paid by those uh for those brands in the market and the multiple is twice right so those Brands who have high pricing power power can charge double the the the price of those brands with low pricing power and this is coming from the same um
number of Brands and and studies in the world right so this is the other route or Route to grow right uh it's not just about volume it's about uh CH uh charging uh the right price for your product and beyond that this is a one of those evidence points that uh that we're collecting or that we have collected very recently and in this is a case study right for which this is an fmcg brand uh where we are comparing the actual price elasticity model by market mix models to the pricing power of those Brands and
and Here we have six Brands and this is an average over more than 10 markets right and what you can see is when a brand has higher pricing power it has lower price elasticity right and this is very important for uh your margins right because if you can charge um a higher price without losing that many um um consumers then you know you can uh potentially increase your um revenue and your profitability right so for this is a a very important route for growth that Sometimes is overlooked by uh by other uh yeah uh approaches
on on how marketing works right so beyond um beyond the metrics that we've shown that simply or mostly describe the Brand's current market share or penetration or or or price paid we need to go beyond that and see what actually drives growth right so what is driving that and we for that we need to embrace deviations deviations from the expected Value uh you know so which brands are bucking the trend those that have more of something than their brand size would suggest and handing over to gram now so this analysis is based on over 14,000
cases from the canar brzi database uh that I helped to manage and what we did was that we identified from across all the different metrics that we have available to us the ones that best matched were behavioral measure of share and the uh behavioral meas of share Turned out to be a very simple question we just ask people which brand did you buy or choose or use last time so we get a single answer out of that and we get a a percent share and we look to see whether for cases where we had the
brand measured in year not and then two years afterwards so across a whole time period from 2014 up to the present day we look to see the same brand same category same aret which brands grew on that metric of of of choice um so the last usage and Which brands declined on that and we found that the most discriminating metric the best predictor was the brand Equity measure relative to the expected level for a brand of that size so what I'm showing you here is the relative strength or the deviation of the Brand's Equity um
at the starting point and we're looking to see which of our met metrics had more or less in the growing group of Brands compared to the declining group of Brands and in fact What we found was really very very clear the brands that grew tended to have a significant advantage on being more different than expected the brands that declined actually had more salens um and you know that that really was was quite a staggering point to us because we assumed that saliens would have just as much impact but actually we found growth was being driven
most often by being different now got an example of that for You here if we uh go on and we look at Tik Tock so we all know how much that Tik Tok has has has grown in recent years it's a phenomenal brand and it's gained momentum primarily by delivering a great different experience look even back in 202 20 here it was well over the average for being different and if you compare its differ score here um with 2023 it sustains that difference but it gains a meaningful and Salient connection with more and more and
more Consumers so like Mark said you want to be meaningfully different to more people it's exactly what Tik Tok has been able to do and it's delivered that through the brand experience now let's look at sorry yes we'll look at now very quickly A Tale of Two Mexican themed fast food chains in Australia Guzman Gomez had the advantage over zambrero in that extra difference look 114 compared to 100 and it grew at a much faster rate it over indexed on difference and it benefited As a result the meaningful and Sali scores for the two brands
are very similar it's the difference that makes the difference in June 2024 they were the best IPO in Australia for the last three years and actually they're planning to match the number of McDonald's stores in Australia orbe it over the next 20 years I'm going to stay in Australia for my next example because what about these two beers we have Castle M 4X on the Left and we have great nor Northern Brewing Company on the right they're both from Queensland they're both a similar size in 2019 in terms of volume sold in fact Forex has
a slight Advantage who do you think is going to grow more over the next five years well in fact um if we go on to the next chart Jorge we can see that advantage that great nor Northern had in meaningful difference propelled a headyy growth for it and it's actually up 51% in volume terms and Forex slowly declining deviations from expected values are insightful in all of our data if we go on we can see here um the streaming Market in the US and obviously we we're all very familiar with Amazon Prime with Netflix and
the rest of the brands that have been crowding into the market in the last few years we know that demand power and penetration are positively Associated but penetration isn't the only relevant Metric Brands need to retain customers as well as winning them that's not just a function of penetration in this case we see Amazon Prime and Netflix have similar penetration but very different levels of demand power does that mean that demand power doesn't work in this market well no because we see that actually the deviation to the right or to the left of this line
um relates exactly to the churn rate that these two stre streaming Services have in fact Netflix has half the churn rate that Amazon Prime does as more and more new entrance launched into the category Prime is more easily substituted or it's supported only because of its promotional connection to shopping so the eff of difference is really important and it's the effect of difference on pricing power where typically as the ring on the left shows it's 49% of the um uh of the weight when we calculate our pricing Power electric that is is supporting your margin
and your margin growth and actually I just had a very simple exploration on the right hand side here we saw earlier demand power had a high contribution from salience not pricing power difference is what's important we ask another question on our study how much of each of these Brands worth paying for and the percent that the brand is worth Paying for um systemically increases as we look at brands from the lowest to the highest difference index the higher the difference index the more consumers the more consumers agree that the brand is worth it and you
know we've had repeated bits of evidence here even a study in 2022 by side business school at the University of Oxford found that difference was the bre best brand metric to improve existing models of abnormal Stock market returns they looked at 328 us companies over about 10-year period and they showed from throwing everything into uh their models difference was the one brand Equity that trick that really helped to improve the prediction of which brand was going to beat the stock market it can also be a negative indicator in the sense of it helps you to
understand uh what's going wrong with your brand and to do that I'm illustrating it with Bed Bath and Beyond Opened in 1971 and it's a Superstore that became famous is a category killer in the US but the company's decline was marked by a series of missteps supply chain issues poor man management decisions and finally an inability to compete on price with online retailers and discount stores and we can see here pricing power declines were its biggest problem it originally if you go back 10 years it had a plus six deviation so it was a positive
for it ends up in 2021 uh Just a year or two before um it files for bankruptcy with a negative uh de de deviation and we can see how it it grew less meaningful less different and less Salient over that period fact I don't have the data from 2023 because it becomes so weak we didn't bother to measure it anymore after 2021 so um we can see that you know if we had seen the data back in 2015 16 17 the weakening of that pricing PA deviation we would have been more Worried about um the
future of this brand Jorge how can we look to the Future yes so let's go on to predict the future prospects of a brand of course there are many many factors that are going to affect a brand actual success or otherwise um for example it's race rate of investment competitive activity Nothing in life is guaranteed but we can look at the extra Equity a brand has relative to its size how much extra meaningfulness difference and salience And combine that into a single score which we call Future power brands with high future power have four Times
Higher probability of gaining value share so Revenue share in the future compare to brands with low future power it is a massive notch in the right direction this uh comes from another data source where we matched um uh data sources right so in in as mentioned before we are not using a single database we're using many different Databases uh for which we uh we had data now this final um data point here well next to final data point comes from 14,000 brands that for which we matched actual um uh data points two years apart right
for which we had um uh the equity measures plus the bast the surrogate of uh penetration in Brand C and what we learned from these across the world is that actually brand size is not the best predictor of penetration growth in the future actually it has the opposite Effect so um low brand size Brands so smaller Brands actually tend to increase penetration right whereas big Brands tend to decrease right so brand size is not the best predictor of actual growth yes big Brands will tend to be big two years apart and small Brands will tend
to be small uh still two years apart but the movement is going into into the center and the Dynamics are changing right so uh what is what is it what is it that Predicts grow in penetration so we we're seeing that in the bottom there the future power future power is a metric that we comb uh when we combine meaningful different and Salient and mostly it uses meaningful and difference not so much much salience and what we see is yes this measure actually has h a lot of predicting power of growth as we saw in
the previous slide and how much of that growth is you know so brands have a higher probability of growth but Also they tend to grow more and when you amplify your meaningful difference during those two years you know after the first measurement of your um future power and you work on your sence on your being present on extending into into new spaces uh what you see here is you know after those two years when you achieve that growth in sence those brands that start with high future power grow faster right and uh and have always
an Advantage right so what we're say uh saying here is that the most important ingredient today to prime your brand for growth is being meaningfully different right and that's something that uh sometimes gets not so much stressed and we think that we only need to work on mental availability yes you do you know uh uh but also you need to start from somewhere and you need to retain that meaningful difference R so to conclude um we have taken a huge amount of dat data from multiple soures we've looked at it over time and we have
um analyzed it using the most sophisticated techniques that we can bring to bear on it today we've shown you some of the simplest evidence because we want the evidence to be understandable by all but it's not a theoretical model it's a practical one and as Mark showed we've got practical tools to apply it and implement it um Day in day out around the world and that to me is the the biggest bit of evidence that we have to support the blueprint for brand growth it's been useful to canar and to can's clients for the last
10 years and more so if the meaningful different and Salient frame framework didn't prove useful we'd soon be out of business but fortunately we are still here today and we're more than happy to share the blueprint with you all so if you want to know more there are two Versions of the blueprint an executive summary and a um a full book which is I I can't remember now but it's about 60 pages long I think um which contains all the analysis the Met analysis The crucial supporting data points The Narrative for each of them and
all of the detail that Mark went through more for the uh Strat iic D is included also for each of the growth accelerators so hop on to can.com search for blueprint and you'll be able to download that um But I'm sure you have more questions I'm already seeing some come through um but I think I'm handing back to Frank to help to moderate uh a final Q&A with us yes well thank you very much for that that I'd like to start one one from Nick he asked uh do uh did you identify any Regional variations
in the blueprint for growth uh well I'll go first on that one and uh in simply put I would say no um there are obviously strong Regional V variations in the mechanisms that you Might use um you know in order to to to leverage uh the strength of your brand or to remedy uh gaps in its brand equity and so on so we know that you know roots to Market and so on might well be different in China or India than they would be in the UK or the us but you know that doesn't change
the fundamentals we see that meaningfully different brands uh gain more brand Choice more penetration more share in all markets around the World okay yes beyond that we've seen more variation between Brands within a certain category on how on what they need to do than necessarily uh you know across regions yeah I wonder on the meaningfully different I wonder how consistent it is across geography for Brands I don't know if you've ever looked into that to say um you know uh what is meaningfully different in in region a may be different from region B though they
may both be strong uh have You ever have you ever looked at at that aspect as to what drives the meaningfully different uh uh sentiments among the among the individuals for a brand uh yeah we have I mean the database we've got of brand Z Brands allows us to do that um and you know broadly speaking um you know it's it's actually having a great range of well-designed products and services um that are convenient um and easy to to access that drives brands in any sort of A category almost anywhere right so those are the
fundamental um beyond that yes there are deviations and for example you know the degree to which um uh uh the sustainability uh of a brand is is positively perceived or not that will vary from one market to another but actually everywhere for the vast majority of Brands that's still at the moment a secondary Factor it might be a good way to differentiate your brand but As as uh Mark said earlier on there are so many ways to differentiate a brand and you know that will be down to your circumstances what your brand can say uh
uh you know the competitors it's against and so on rather than any particular cultural difference around the world that oh real quick where hey so Frank you know yes it to Graham's Point what's meaningfully different to consumers in various markets is different but also we'll even see that Phenomenon within a given market and I was using as an example within the chat earlier Disney is a very it's a mega brand and it it operates and and yields revenue and profit for itself across a multitude of different categories and if you put yourself into that category
context which we always encourage doing you'll see the brand show up in terms of its strength and what's meaningful and relevant to them differently in these different Categories when they operate in cruise ships when they operate in streaming services and when they operate in theme parks those are a completely different set of needs now the overall equities that the brand carries will will translate across those but also they have to uh help satiate the needs of that individual category buyer somebody who's looking to entertain in a streaming context is going to be very different than
someone that's looking to Have a travel experience um and the brand the Disney brand needs to show up and be relevant and differentiate itself within the category but differentiations might look a little different and meaning will look a little different depending on what they're trying to do in each of those categories yes and I actually have a follow for that I actually received a text message because some people have my uh phone and uh we're texting me that way too uh and and It actually uh goes to what you were saying earlier Mark uh regarding
uh new spaces uh which we we in a mby term we call those real options the brand extensions if you will and the question that came up with is there a way to test those using the mean meaningfully different framework like how would you go about and and test if if an expansion a new space was as this person say you know a a a a good investment uh well yes canar works with Lots of our clients I'll let Graham and Jorge talk about what was done in the the R&D laboratory to sort of Define
new spaces and and such but we obviously um there's Innovation and finding new space there's the finding new space then there's developing solutions for those new spaces whether or not that's going to meet the needs of the consumer and oftentimes we see companies struggle with the translate they might find a dig site they have a hard time sort of Creating the solution that will so there's a multitude of things that need to happen in order to have an an effective Innovation the first stage is just to identify do you have the equity and the strength
to innovate and then when and uh do you need to stretch in order to to to find in incremental growth and then what where where are those spaces that's sort of step two so you innovate in the right places and then third is having the right Innovation to succeed and to satiate that set of needs that you've identified as you as you said it can have a different name in different ways but we chose the word space quite specifically because it's actually you know you might not need to innovate the product at all it's about
identifying and often this can come from observation oh look this group of consumers they're using this product to do you know exact this this product to do something that we didn't Expect them to do let's actually amplify that and tell everybody that I don't know you can um you can use this for breakfast as well as for dinner or you can use it in your car as well as um in your uh lounge or whatever you know I mean it's it it's like a a lot of small Brands finding new space means actually telling people
how to use your product and them not just assuming oh I used it this once or this friend you know gave it to me on this occasion that's what It's for it's actually no it's much more than that and and and that can be particularly for small Brands as important in fact often much better return on on on company investment than trying to invest in a new product that might need a new production line a new tool a new training for your service providers whatever it is that's a lot more of an investment to develop
a new product or a new s Service than it is simply to take what you've got and use It and and tell people how to use it in new and different ways yeah I very much uh um resonate with that I uh um I remember the rice krispy snack uh Trend if you remember coming in you talk about breakfast uh being cereal going into a a different time period um and so that you know those that that's a leap that you know is sometimes hard to even see uh on on that front but when it
when it happens it's Magic um so we have a Joanna has asked a few uh uh a couple questions actually here instead of reading them Joanna do you just want to uh um for me to unmute you and you can ask them directly okay can you hear me oh we can hear you yes first of all first of all Graeme and jge it is such a pleasure to see you Mark we don't have the same you know past history um I don't think uh but it's but and it's great to see you guys doing such
you know good things with the Brand Z data and really starting to leverage it you know M mine is more of an idea because and you can guess where I'm coming from knowing what I and mby specialize in uh which is you started to do that in one of the Australian examples which is where it suddenly became three times more powerful which is when you showed the revenue growth that was achieved you could I think you have the data in brane from the Valuation history which goes back if I remember rightly to 2006 um so
you could show how much sales and margin growth so both pricing power as well as you know share and and all the rest of it then you could present the actions you take as something to take to CFOs CEOs and boards and a way to get the right level of investment in brand and marketing and to get them to improve it so that's that's that's what um I would you know one thing I would Say also the taking products into new spaces I'll tell you a great example um which you may be familiar with is
eos you know started out just being lip balve and then they expanded into new categories and one of them was shaving cream for men and then they discovered from Tik Tok videos uh that women were using it to shave themselves not just under their arms but in other more private places uh because they demonstrated this on Tik Tok and so they Completely changed their marketing and boosted their sales without changing the product one I owa yeah exactly and I'm sure there are many many more examples of that oh he no no I think that you
are going to mention the work we're doing with say s business school right yeah so the the first thing is yes as I mentioned very briefly uh we didn't have the time to show any of it but yeah we're we're looking at um you know Showing a connection between um brand and Company results uh through work with side business school um but look we've actually tried a lot of things so we have the connection between brand equity and brand as an asset so in fact this year um uh we showed that um brands as assets
for the top 100 brands in the world have now risen to be uh represent 32% of company van value so 32% on average across all the brands from Apple to Coke to um uh uh HSBC I think was the The the bottom of the ranking all of those Brands um if you look at them on average 32% of their company Val value lies in the brand so if that isn't in itself uh you know enough of a motivator yeah can see that you can see that from um some of the some of the data which
is great even you can show what it is for brands that aren't in the top 100 and how that compares well yeah um yes that that would be another yeah absolutely a good comparator to have um and to have It for a variety and of course yeah we do we have it for uh hundreds of brands around the world because we also uh value brands in 15 different countries obviously individually we do top 30 or 50 or 75 in in lots of places around the world now um but look I've also tried La in the
last couple of years uh looking at is there a direct correlation between our meaningful different s Salient metrics and Company profitability now that is a hell of a lot harder to Directly establish um and you know I I have to say it took us 18 months anyway to get all of the um blueprint uh for brand growth all those analytics that Jorge and I sure through it took 18 months and the biggest problem is just matching up the data sets you know and and and this is a real challenge for us all the time however
yes our initial attempt to connect directly to profitability founded and then we've realized it's because of course the Relative Prof profitability of oil and gas companies against investment Banks against a cpg business is completely different so what we have to do is to actually now uh start drilling down and look at relative profitability in each sector and show how our brand Equity electrics connect to that so yes you know it's all stuff that we're working on and I think in the end even that wouldn't necessarily convince the board what we need to do of course
is develop That unified model for a given brand to show how investment relates to Brand Equity how brand Equity relates to profit how profit then obviously will drive uh their their um uh business Val value overall that would be great but typically you're only going to be able to do that on an individual brand basis and that that sort of project typically doesn't get publicized because it's very private and and specific to the business so we may struggle uh to have it on a Big basis but yes we are putting together in in answer to
your other question um we're putting together an extra 250 individual brand case studies and we will be looking to tie as many of those uh to monetary outcomes as we possibly can just to help convince by sheer weight of numbers um uh that that were on to the right thing here that would would be great and you know it might be easier not to look at profit which is impacted by all sorts of other Things as well but to look at margins and pricing which you can look at because pricing is publicly available yeah and
that's actually you know to the questions earlier in the in the chat about uh pricing power that would get at that yeah yeah all right well thank you believe it or not we've actually already met our time that really flew by and we we expect many good things to come from uh from your future uh analyses and we look Forward so always please reach out to MBI and uh um we have our Summits we have our webinars for for further extension of this and and learning so I just like to on behalf of maby thank
you all for participating and and bringing this forward it it really is an amazing piece of work so thank you all thank you for listening thank you everyone for