Okay folks welcome to the inner circle traders scout sniper field guide episode 4 we're gonna be discussing basic infantry in this module and what specifically will be be covering in this presentation well we're gonna be looking at a review of the previous episode assignment stalking in the kill zone we're gonna be looking at specific ICT kill zone examples since the time of our last presentation it was released on the 9th of September 2013 we looking at some examples from that point on - most recently and we're looking at directional bias and high probability trade framework
we're going to be revisiting the concept of why do markets move specifically dealing with the players and the game and we're gonna be looking at what makes trade setups strategically quote-unquote high probability we're gonna be looking at ICT no-brainer directional bias concepts We're gonna be returning to higher time frame analysis we're gonna be looking at high odds by framework and we're gonna be looking at high odds sell framework we're gonna be looking at market structure and order flow conceptualized bring me discussing and unveiling institutional orders and smart money fingerprints and we're gonna be looking at
how consolidations breed opportunity and what we look for and why it matters inside those consolidations We're gonna be looking at institutional order blocks we're going to be looking at the concept of institutional sponsorship and what effects it has on your trading and we're gonna be looking at a premise I refer to as returning to the point of origin which is basically inside the ICT optimal trade entry concept a like a nuts and bolt presentation of why it's so effective and we're giving you more homework yes this time it'll be tracking Institutional price action okay so
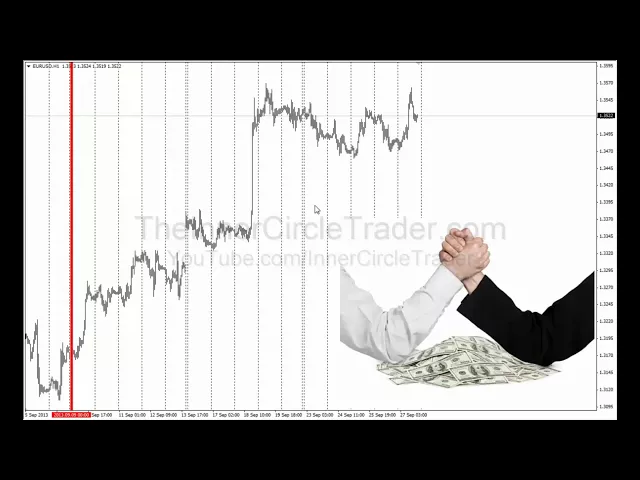
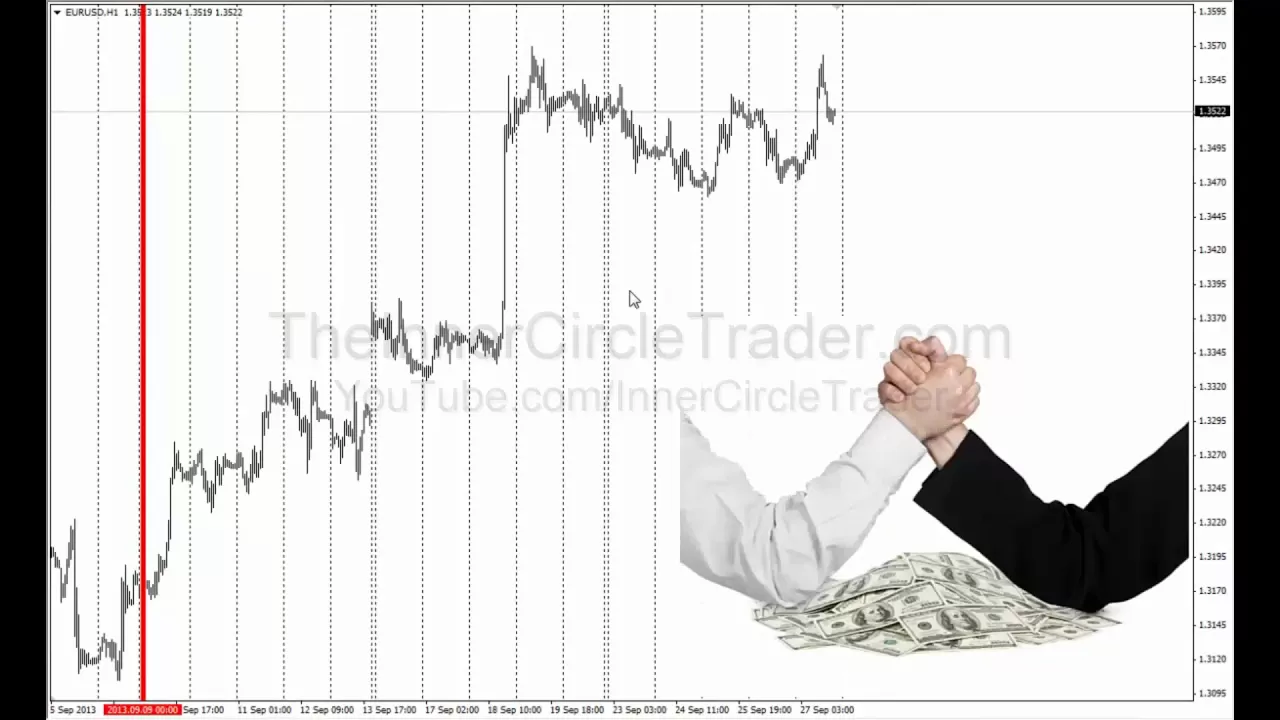
let's get going okay folks we're looking at a daily chart of the euro/usd the last episode we released was September 9th 2013 in this continuing series and we discussed the likely impact that the rising yields would have on the foreign currency markets and we discussed that it would have a continued upward pressure one the fiber which is the eur/usd again real quick let's just reflect back upon the Yields and what it was doing in graphic form and you can see that here okay you see the rising yields okay and when that happens price will unveil
II tried to chase or quote-unquote seek yield and it'll be moving up and trying to close the gap between the the yields and the actual underlying price of the currency now because this candle here delineates the actual time that recording was made there's been a significant amount of pips moved from that date until now and We're just going to use the highest point okay we're not gonna use the best scenario too low we're just gonna use the highest point of that that candle on the 9th okay we're gonna discuss briefly the amount of pips that
were available that's two hundred and ninety one pips so basically almost three hundred pips were made available in advance in advance in form of discussion as upward likely price movement now we had a homework assignment from episode three And it was trading in the zone okay or stalking in the kill zone and we're gonna discuss that here okay and what we're gonna do is we're going to move down into an hourly chart and I'm gonna delineate the ninth of September okay so everything right of this vertical line basically is referencing where we are in terms
of the last recording and posting in this video series and what we're going to discuss okay and as an example of the ICT kill zones we we already had A premise in mind based on the analysis of the interest rate market and how it would have a magnetic pull on price upward okay and what that understanding we're gonna add okay we're gonna add the ICT kill zones and we're gonna add the vertical de delineation okay again the double bar here on mt4 delineates weekends what we're gonna be basically focusing on is the fact that we
were expecting now I'm gonna save this word please don't take it out of context Because I am NOT a fundamental trader okay as fundamental as it gets from me his interest rates okay but fundamentally the driver for the euro to be going up like it was was that the yields were moving higher okay and contrast that with the fact that we know that is the case when we see technically the ten-year yields declining okay so if we go to commodity market and we were referred to the 10-year futures market okay when that market is moving
lower That's actually an increase in yields okay and an increase in yield is gonna be diametrically opposed and there's going to be a basically an inverse relationship between the futures price of tenure notes and its yield okay so if the futures chart1 bonds or tea notes are dropping that is an increase in yields okay and that's gonna be bullish for foreign currencies in bearish for the US dollar okay and then conversely review if you've reversed that Phenomenon and you look at when you ten-year notes on the futures basis or bond market is rallying on the
futures market that's gonna be a decline one yields which will be bullish for the US dollar and bearish for foreign currencies okay so that's a very quick and dirty way of understanding what risk-on risk-off is how I define it okay so if you're looking for any fundamental drivers okay that's about as fundamental as it gets from me okay outside of you Know CT data and and premiums on the front and nearby mom months and the futures markets which we'll discuss at another time it's too vast of a subject for me to cover in this module
but there's other resources made available in the internet that I've discussed either my own work or by Larry Williams in that regard so with all that again we were looking for bullish movement on the euro USD and other foreign currencies With a bearish tone in the US dollar now when we have that that backdrop on price okay as a technical trader we would be focusing on one side of the market more than the other okay now that does not mean that we completely throw out every bare sell signal it just means that we should be
focusing more in our equity allocation rather one the long side of trading okay in other words your get more bang for your buck being a bull than you would be Being a bear so if you are gonna be doing a trade that's counter this fundamental again quote-unquote driver in the marketplace understand that number one you're you're resisting the overall market pinnings okay in other words there's there's gonna be a tug of war between you being a bear okay and the smart money that is really perpetuating this market higher so understand that I mean there are
times where you can be right and profitable Okay in doing that being contrary but just don't wear out your welcome okay and marry the vein and just get blown out of the water even you know the best traders in the world you know understand there's a simple premise you just don't fight you know you just don't fight the tide okay because if you're swimming against the tide you're gonna tie yourself out and ultimately kill yourself but if we understand that being a bull in this environment okay we could Have much more relaxation much more calm
as we engage the market because we know what it is specifically that we're looking for again that gets back to differ cheating yourself from the neophyte or the street money okay we are not simply sitting down at the computer and saying well I feel like it's going to go up today okay but the last five minutes it's been going down so let me sell it okay that's not sound trading okay That's not a plan that's reactionary trading this whole series is delving into the importance of having number one a predetermined plan of attack and a
predetermined method of attack and then a procedure in place that's clearly defined comprehensive and you know specifically what you're doing when you're doing it why you're doing it and when you won't do it and the reasons why you won't be doing it as well so with that rant Okay let's delve deeper into what specifically took place from this point one and how we can use the ICT kill zones to ferret out the lows in this up move that we were looking for to unfold how we could time scenarios where we could be a bullish buyer
in this and possibly have made money we're gonna be moving into a 15-minute chart okay and again we're gonna be introducing the ICT kill zones and we're gonna be losing our vertical line here that's okay and here Is the September 9th timeframe okay and we're just gonna be tracing this whole period on the upside and we're going to zoom in okay and what we're looking at again are the red dashed lines here okay this basically is encapsulating the whole London session okay and the green in here is basically encapsulating the New York open or New
York session okay and what you're looking at is how by focusing on catching a decline or pullback within that specific time Window each day with a premise in mind where we most recently moved away from and where we're gonna retrace back into in other words we had a range initially during the London session here we saw it rally up in here then it retraced within that range the range between this high and this low okay that retracement in here was an opportunity to be as long as the market moved higher and expanded its london session
range okay we had another Minor pullback it pulled back to a dealing range high in here and then moves on out and then we entered into the new york kill zone rallied up the retracement in here while there was nothing sufficient over here in terms of support resistance we will talk about these pauses in this video module and how it's useful to you but very smooth up eventually moved and made a high outside of the New York session and or at least in New York kill zone it's not The session itself - it was outside
of but the time winner did I clearly defined now when you see me moving them cursor across the chart don't be discouraged okay or confused because this says ICT Asian range what I'm using is the empty for indicator ok that's usually used for my Asian range barriers like we're seeing here the upward and lower for New York all I did was change the time parameters to encapsulate the specific New York and London sessions ok So if I do pass over and you see these little boxes popping up and you're wondering what it's saying or if
you catch it and says that don't be confused simply because I'm using the indicator itself did I named ice at the Asian range is this it's multi it's a multi useful ok you can use use it for different things as we're sorry showing here now this day here's Monday on the 9th okay now that was the date that we released the previous installment in This series this is the Tuesday ok and now what we're gonna talk about is how we use these sessions ok with the understanding of expectancy moving higher in price okay there's highs
and lows within these time windows ok we have the low we have a high and in between there okay any swing higher low is useful this one here this one here okay inside the New York session okay we have a low here and we have a high here okay and on the following day On this Tuesday this was September 10th we have the range from here to here for the London session and the New York session is here okay so inside of that you can see that their swing highs and swing lows that are useful
as well by understanding that okay and understanding the concept of the range or previous day's range or session ranges okay that being here's the previous New York session range this is a low in here okay and what we'll do Is we're gonna highlight an opportunity that could have presented itself to you as a trader some that low to the high okay and I'm gonna move over here you can see how price move down into the optimal trade entry area here which is between the sixty two and seventy nine seven trades and levels respectively it went
right down to the sweet spot which is essentially the 70.5 dibban achi level okay seven zero point five you'll have to set your platform up if It's not empty for your own way I don't know how to do what platform you're using and I really would rather avoid going through a long list of possible emails saying what can you help me do it with this platform I'm pretty much limited to just using you know what we have here okay mp4 because I don't want to get into you know a long when did you know explanation
of what possible platforms you could be using and then we get into conversation of which one I Advised over that so I use a very generic one mt4 okay that way everybody's readily accessible it's free it doesn't cost you anything and it's pretty much Universal and then you can delve into other platforms where you see it's you honest so we have we did deviate outside of that that range here okay by the defined terms of the ice-t kill zones for this series now I stand there's small variances in the times that I'm Using for this
one and the ones that I use for my own trading so please don't take that comment and say well look at this he's not even teaching what he uses I'm I took a lot of time to eliminate a lot of the stumbling blocks that I see in email form okay because over the last three and a half years I have been inundated with reoccurring questions about what time window is this and what would that be in my time frame over my global position around the you know Planet and I readily admit it's a very confusing
topic for me okay so I understand it's it's confusing for other people and as a mentor that's one of my weak points communicating that effectively okay and to eliminate that I just simply gave you a very generic time window for London and New York sessions and if you hunt during those time windows you'll find more than enough opportunities okay and none of my tools are gonna give you every single trade Okay you could probably go back in hindsight and find where it was useful to you okay but don't have such high demand on these tools
expecting you to get every single high and low every single movement in the marketplace okay that's not what I'm teaching that's not what I'm promising you I'm promising you an edge that's it okay so how you tweak that edge and how you use that edge is completely and utterly up to how you employ and work at It okay so on Tuesday we saw the market make a significant low here and then rally up okay and going into that Wednesday of that week we saw a price move down making a low in London okay in the
London kills them when it would be reasonably expected to form okay and you could take the low from the previous day up to the highest high prior to it moving into the London session okay because you're what you're doing is You're looking for that retracement back inside of the range okay and again we see the low to the highest high here prior to it moving into the London session okay price comes right down into again the optimal trade entry region and price rallies up okay if you initially miss that opportunity it gives you another opportunity
to catch a ride on this move up in the form of this pullback here so you could use this swing low and again Let me take this off because we're already getting busy you could use this swing low to just swing high in London and you'll get this right in here as a retracement okay and don't be thrown off also with the breaks between again let me show you here the time between the London kill zone here and here there's an overlapping between these two sessions that it's very busy okay there's a small little period
around 5:00 a.m. New York time or 10:00 GMT Where you may catch a little bit of a pause or a breather that's you know not guaranteed to happen always many times you'll see prices continuing blow through at that time pocket of you know 10:00 a.m. to 11:00 GMT it would be foolish of me to advise you you're always expected to be a little pause in here but you can reasonably expect it treat it like you know I'm lunch okay where there's a small little consolidation and all of a sudden little Take off in the trend
direction that's established by the London session okay so we have a low forming here one this day again looking for retracements to buy off of this was one this one in here and then you have one in the New York session here as well you can take this swing low and to this high here okay and the 62% recent low and it may be a little difficult to see so I'll do my best to draw a little bit tighter to see that did 62% trace my lays right on top Of that line that would delineate
the New York session beginning the least of the boundary about time and then price rallied on I actually took this trade okay so it's not like it's something that's purely hindsight and if I'm questioned or whatever I can show you documentation about the trade and the actual real results not a demo trade and the unity the opportunity to continue moving higher in intraday and here also was Available and you could have caught some further upside as well but that's outside the scope of this teaching and this is presentation again moving in to let's go out
one more ok this was that move we were discussing and here we have the range from the previous day's low up to the highest high okay right here prior to moving into London and New York okay here's New York down here you can see how price move due to sudden onset tracing level okay and we're gonna talk About why this may not have been a good idea to trade okay looking for a long because of something going on over here okay but that's later on in the video guys I know teaser teaser price rallies up
in here okay nice opportunity okay just to be a buyer specifically looking to catch longs okay the range available with 68 pips you could reasonably expect to get 30 pips out of that there's absolutely no reason why one couldn't have you Taken 20 the 30 pips comfortably out of that move even with it retracing and returning back into this this range here we have a low here okay we have a low in here formed and using that to the high formed rate here okay price comes down deviates the 7x7 tracing briefly just briefly okay and
then gave you a tradable rally in here to the tune of about 25 pips there's nothing wrong with that and if you consider the overall Range of this price swing from here up to the high and as it retraces we had the center on here and the 70.5 level here respectively and then look what come down one more time found the sudden high saturation level as well one more time bouncing off it like we did here just violated this load just by a little bit you see that if price does that it's usually a precursor
there's something pretty significant and you can see how clean These highs up here were so you can imagine what was resting above that you can see that was the case here they took out all the stops with that huge weekend gap blowing out all these highs that were way too clean and that's classic ICT work there you can see the results of why I say when levels are too clean that you can expect a pocket of stop see sitting up there and they will gun those bad boys out and they did a handsome job of
it that week okay and trice moved Again on Monday small little rally here in the London session going into New York okay before a retracement deeper okay now let's look at something okay and it's a very cool technique and I dubbed it in hidden optimal trade entry and for those that aren't real you know fans of my work they find it rather silly to suggest that something might be hidden and therefore be useful but it's really nothing more than simply looking at an idea of support resistance okay Which is what we have here I think
it would be hard-pressed to find anyone that would really fight this as being a discernible level of resistance okay we saw it bounce up here here here okay and if price was to get back above it as we see here we would expect it to be what support right so we would have a role-reversal if you will okay but simply because it's an expected level of resistance here it may not come back down to that level anytime soon but It's still is useful to us as a point of reference because between that level and where
price opened up and rallied up to here okay that is a range this just right here at this point here from this candles low to this candles close here this is a gap now while there was no trading there okay you have to understand that this is still a range okay that's a range this is simply no trading between this price point of the close of the previous Friday and the opening on Sunday there's no trading in there it's all you know liquidities there's none zero okay but because price is trading here you still have
to consider that as range okay it just means that there's gaps in between these two price points and usually the market finds a way to fill those gaps but not right away sometimes okay so what that understanding is with this gap or without this gap if you ever see a discernible level like this okay We're clear resistance and support resides if you take your fib and anchor it rate from that price point and you rally it off that take it up up to the highest high okay when price retraces basically what you're saying is it's
retracing into this range gaps don't have to fill also okay I've seen many times where gaps stayed unfulfilled you know for years that was in commodity markets that was in stock indices okay just simply because the gap doesn't mean Necessarily that it's gonna fill that's not a it doesn't mean this is a common gap if you will okay common gaps usually get filled relatively quick this could be a breakaway gap where it necessarily isn't always gonna be filled you know you especially have you have a long term monthly yearly trend underway who says it's gonna
have to go away back down to that gap okay this just shows that there's a huge influx of buying Okay on an institutional level so therefore we still have to consider this as a range and in price comes right down to the seventy point five and then we rallies off of it and gives you what an opportunity to trade to where you know what high okay so just simply looking at support resistance and using Fibonacci alone is useful okay and there's 40 pips made available to someone that would simply understand that concept and work with
it okay It doesn't mean you'd hold on to it and expect the moon it just gives you an opportunity trade okay and there's a trading pattern in this that we're not having discussed it's been previously released by me on internet but that's for another time another topic but again you know we have this low in here okay that was an opportunity to catch a short-term little pop in the market again focusing only being a bull we have price moving into a larger consolidation Okay we do have an opportunity to see like this low here to
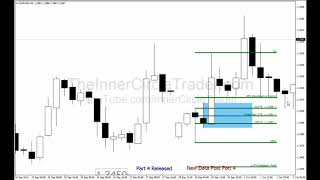
this high this is an opportunity here where you could potentially look to be a buyer in here okay but with this gap like it is here it's just it's a lot of uncertainty where it may try to reach that you could be a buyer here and let's assuming that was the case you know price was able to move up strongly in this case here with FM FOMC release in here but this this stay here okay if we use the same Premise that we had that same support line okay let's go back just a little bit
you can see a bit clearer we're gonna use the same premise this set support line and we're using the kill zones again as guides and this is the range the highest high prior to going into the London and New York sessions now again we had FOMC coming out this day so you'd have to expect price to just more or less than Holle prior to going into that specific Release but price makes the low in New York session rate on D move past before you guys can see it I apologize go back price comes right down
to that 62% at recent level and then takes off and in clay and custard your you're wondering I was long in here and I am going to tweet the actual entry point and you can see that I was not outside of this move it was rather exciting because it was one of those times where we had everything in alignment we had Yields suggesting the price is going to move higher we had a huge weekend gap that was unfilled it just was unable to breach that 130 325 123 I'm sorry 130 323 level in this area
here as support never even came down to it never needed to and it just launched vertically on the upside again keying off of the London open and New York open kill zones was useful here because the law actually formed a during the New York session and price moved on higher Then went to another consolidation going into the close of the week again our previous understandings in the previous videos that we see price when it rallies large like this this is a big daily range so what he thinks on a half of when the average Joe
he's gonna get in the market say well I'm gonna be a bar now and I'm gonna be expecting this the thing did you repeat this same similar move not always and certainly not off of an economic report because what'll Happen is there's gonna be some rebalancing okay and what they'll do is they'll consolidate and more or less pause for a minute and reflect on whether or not this was really needed okay and this is very illiquid a lot of gaps in here okay so it was in a rush to get somewhere and it held this
one 35 31 35 50 range okay and price again moving in a consolidation looking at how price move like this we are in a wait and see mood when this happens even Though we are bullish traders when price moves so aggressively like this short-term ok and we're talking about and move in toward a one-day moving 212 pips in one day I mean that's a big that's a huge range for one day when you see that ok expect small ranges and this is what you see here small range is small range small ranges and then what
you're going to wait for is discernable signs that we have an opportunity to trade okay and let's drop out because I'm a little close here is that FOMC release consolidation a small little retracement small no retrace of small little retracement and then finally we get some market structure shifting to the bullish side and then you can see that what I'm referring to is this break here this high it made it very convincing rally which we're gonna talk about this type of price action and what is so useful about it you have an opportunity to see
this Range price comes down that a sudden I said Jason small little violation not much but this is an opportunity to be a buyer again focusing on the time window and the kill zones we have price for a layup on out of here so again we have this small little range in here that is outside of our kill zone so even though this could be a trade taken during the asian session again outside of the scope of this teaching if we see this rally up here like this this is the area of where You would
be expected to be a long based on what we're teaching and that looks like this this is the low during the london kill zone and the high made during the london kill zone so we have a price swing within that time frame right in here this is a tradesmen level okay let me zoom in okay you can see price comes down it gives you more or less like railroad tracks if you're a candlestick student what that is is you have a big range Down then they range up immediately and that was a precursor to absorb
pressure again that's just using the low here if you use the low forum during the asian session over here you can see we didn't have anything in terms of OTE to support that except for some 50% fib which is not significant in my repertoire so again with that understanding you have it here and we have this market making the high during the actual New York session okay and the high closing on the Candle 1400 GMT so that's one hour earlier than we would expect to see profit-taking which is the 1500 GMT candle and that happens
right there so right in here is when you recently expected see the high had formed and it was a little early on that day here so basically what we just discussed was an overview of how important understanding the kill zones role in trading okay and again just focusing on one side of the marketplace And that's not necessarily a weakness okay I get a lot of email flack about you know well you know you're missing all these opportunities just doing this well look man show me a trader that's catching every move with documentation and results that
show an upward equity climb because I'm gonna tell you right now if they exist they're not talking to you they're working for some bigwig operation somewhere okay and they could care less you who own the internet Believes what okay what we're discussing here is an opportunity to learn how to approach and engage the marketplace with a plan of attack a trading plan if you will one that is repeatable one that is usable in all market conditions okay but simply because it's usable in every market condition does not mean it's going to be a trade in
every market condition okay a lot of folks are struggling with directional bias we're gonna talk about That in this video module we're gonna talk about the importance of not doing anything okay because a lot of times folks who'll just you know soon that just simply because the market moved I betcha ICT was involved in that trade not necessarily my trade frequency is very small I used to trade a lot you don't have to trade a lot okay the tools I'm sharing in this video series will allow you to cherry-pick these concepts it's being divulged in
this this Specific trading plan series is designed for you to catch those one shot one kill weekly hauls where you're just waiting for that really good setup for the week make your weekly objective don't care if it goes anything beyond your normal expected in terms of you know if it's fifty did 100 pips for the week whatever this approach will help you do that it'll help you get in that direction of being consistently hauling that type of that game if you are expecting this to Give you every single day trades you're looking outside the scope
of what its intended purposes now I have approaches and techniques and concepts that are applicable for those types of environments and those styles of trading but I don't think it's a good fit for new traders I think it builds confidence if one can number one learn to anticipate learn to engage with an understanding of why you're doing it when you're doing it and when not to do It which is more important to you taking a trade because there's more time in the market for you to lose money than there are for you actually in line
with the market and then make money okay and we're gonna discuss that later on in this video but understand that the the likelihood and the odds and time window for you to lose money is far great later than the short small little pockets of opportunities that present themselves as trade setups that are Profitable look if you take a thousand traders pull them from all corners of the earth put them in a room and you tell them look at the same chart every single one of those guys are gonna have something different and what they see
and what they expect this is a framework for you to build upon it's not a complete be-all end-all okay it's not a panacea but what you're gonna get from this is going to give you a procedure to apply and if it's applied correctly Within the defined terms from video 1 to video 8 you're gonna see a big picture panoramic view of when you should be engaging when you should not be engaging and when you are engaging what specifically you're doing when why how ok there's gonna be no ambiguity when it comes to that but it's
important for you to get through all this boring dry stuff because that's what gives you the understanding to make you effective once you start applying these tools because Every time you watch these videos it doesn't mean simply go out the next day and expect those things unfold exactly as you saw in that previous video you learn by expecting to see similarities to what you see in these videos and you gain a understanding okay and you activate your reticular activating system where you start seeing the same pattern unfolding all the time always there always there and
there's gonna be slight deviations from what you expect To see and what actually is there and that's the fine art and trading that you aren't going to learn from a textbook you're not gonna learn from a $2,000 webinar seminar going across the planet you could go see somebody that promises you he's been doing it for you know 25 years and he said he's so much better than everybody else look there is gonna be a growing period for you and it's gonna come with being in from the charts I learned something New every single month I'll
go back over my turn and I will discuss about how to keep a journal in the last portions of these videos and what's a real good way of referring to it and reflecting on it and what you should be gleaning from every time you do it I learned something new and a lot of it's about myself not necessarily about the marketplace but I learned a lot and I journal those types of things so when you see these kill Zones learn to anticipate specific types of price action and behavior you are not at the point at
which you are expecting to do trades yet okay you're still in an observatory State okay what you're doing is you're spectating or paper trading okay you're just looking to see how these markets gyrate and move within these specific time windows with a higher time frame panoramic quote-unquote fundamental perspective and I'm hoping that you're Gleaning that there is a few cherries hanging on the monthly tree of Forex okay that you can calmly and gingerly walk up to it reach out and pluck those cherries when you know it's applicable for you to do so not simply because
it's an opportunity to trade because therefore it's Monday the markets are trading I got home from work early or I'm going to bed early I'm gonna get up and yep London therefore I'm making time to be in the market so I'm gonna take That tree there's no necessarily a guarantee anywhere that you're trading an opportunity in terms of time and freedom isn't gonna line up with the market dynamics debt you know propel the market up or down in your favor so it's it's important you understand that okay and these kill zones while they are absolutely
dynamite in the right hands with someone that understands what should be transpiring and a combination Of all these components together by themselves they're absolutely gonna be useless to you okay there this highlighting a window of time where things generally happen okay so don't expect them to do anything more than that but go back it when looking when that the one in the windows of the killzone of London and New York present these tremendous opportunities for you to be involved with being in that marketplace with that dynamic in Mind like we had from September 9th we
expected the market to move higher we expected the dollar to move lower we understood that fundamentally quote-unquote based on interest rates okay and that magnetic pool it will have on prices in the currency market and you saw that unfold here not necessarily just simply in the Euro it happened in the cable okay it happened in the Australian dollar okay it happened in all of the foreign currency markets in Contrast to the US dollar okay folks we're gonna be looking at directional bias framework and before we get into the specifics I want to ask you a
question okay and we kind of visited this earlier on in the video series but why do markets move you know what propels markets higher and lower is that the average retail traders like you and I or is it going to be the large institutional banks and investment firms those entities on the larger scale Obviously be on the show without are the catalysts for markets moving higher and lower because their sheer volume you know requires price to move based on just some supply and demand factors that they create by their mere presence in a specific asset
class and it goes without saying that if if a currency is undervalued for whatever reason that a large institution seems to believe that it's undervalued and it's going to appreciate In value with you here without that they will try to accumulate that currency but because their their volume level is sudden so it's a great contrast to what we see in a retail outside they leave a very big footprint okay and I used the analogy in this video series it's like the elephant you know getting in this children's pool okay just the displacement of water it
can't be missed it's obvious it's when they enter you can see there's a there's a Major shift in price okay they don't sneak in they don't you know all of a sudden hey look at that you know this 500 pip rally just took off out of nowhere where did this come from if you understand what an elephant track looks like you'll know what happens in the future when you see them start to materialize and price action okay and it's a rather simplistic way of looking at it but the main thing you need to understand as
a trader is that you are Not going to muscle this market okay you're not going to be the catalyst for it to move up and down okay it's a collection of us the retail universe in trading will not move this market now we may cause little minor blips okay on a very very short term okay but by far and large the currents in the marketplace are always going to be dictated by the larger predators okay and those entities are what we considered quote unquote smart money And because they have the sheer volume behind their their
trades you know they can manipulate the marketplace on a certain certain timeframe now the long-term trends obviously are a result of these larger institutional smart money investors and trading banks they keep momentum moving in one particular direction or the other until something changes it either fundamentally or technically that permit prevents them from one to participate in that existing Trend and then that's what will happen is you'll see a market shift there'll be a pause maybe or an abrupt reversal altogether and a change in market tide your job as a trader is simply just get involved
with what those smart money traders are doing okay and we're gonna be dealing specifically with that type of mindset in this section and the next section after this we're going to be dealing with a lot more specifics in terms of how to trade with the insights That's gleaned with smart money action and in the candlesticks and the new overall price action of whatever asset class that you trade and because this is an ICT concept its universal it's applicable to commodities it's applicable to stocks energies crude oil metals gold silver palladium platinum copper you know and
as well as debt instruments like the bond and t know markets so don't think this is only going to work in forex it's a measure of Understanding how to read institutional ordering and the order flow that's apparent in price action and it does not require a dependency on indicators okay so it's a leading indicator if you will it does not lag okay so in other words you're gonna see the future in what I'm sharing with this concepts versus what you would glean if you were just using a stochastic or a MACD or whatever it indicated
you like to use okay so it's a Forward-looking approach versus looking at old data and crunching it mathematically to arrive at whatever you know you come to believe it's beneficial with indicators all right so what makes a trade high probability okay no it's strategically speaking when you hear mentors or traders or authors or whatever it is that you you pay attention to or even me when I say this is high probability what deems that setup high probability well the simple Fact is it's generally in sync with what the higher time frame market charts are telling
us and also with the current market environment in other words there's a risk on risk off is it moving in a in a general tide of what the higher time frame markets are doing because again we understand that these large animal predator you know these elephants if you will when they enter the marketplace they're gonna push price around and again think Of that analogy the the price of the asset class and we're going to stick with Forex in this example assuming for in this example we're looking at the the fiber or eur/usd pair for the
market to rally as we see here in the early part of July up to this point here okay that's not coming by way of retail traders okay now that does not mean that retail traders cannot be a part of this move okay but the catalyst was certainly not you know originated by the retail Universe okay that was clearly the large dominant players in the marketplace but there are certain clues that are left in the chart that's very clear if you understand what you're looking for and how you can use those moving forward if we understand
that our trading is in sync with that mindset that's what causes us to qualify or quantify the trade as high probability why is a high probability is because it's moving in the journal tide that's Been established by the larger dominant institutional trading so if we are in sync with that tide or if we're in sync with that market momentum okay we are not trying to be contrary in in regards to fighting the strong-armed Smart Money traders okay they're gonna take the market where they want it to go regardless of how many indicators you have on
your chart whether it be your you know your electronic little trading programs that you created and typed up And maybe you bought it on the internet and it's made a lot of money in the past those absolutely are worthless unless they're in sync with what the large institutional traders are doing okay and the only way you understand what they're doing is by price action and leading indicators such as we're gonna discuss in these next two sections and I promise you you're going to jump about 20 light-years ahead in terms of what your understanding in price
action and Prognostication in terms of technical analysis okay that's a promise guarantee in it okay so now let's take a look at the ICT no-brainer directional bias concepts okay and I say that with tongue-in-cheek because I've been asked so many times about directional bias and you know how how do I get it right more times than wrong in terms of where the direction of the market is going to go either be short term intermediate term or even long term and it's simply a Matter of understanding higher level charts support/resistance price action and the overall tendency
that the market will continue to move in one direction or another until something of equal or greater that may cause a break and shift the tidal in the higher-level dog charts so if you have that understanding every little minor move on the intraday charts okay are meaningless in regards to our time frame unless you understand how to Apply them and what do I mean by that it will use this rally from here in July okay from the lows made here in the fiber again your est is the daily chart as the market moves from this
point here okay and we're just gonna quickly identify the the ranges here okay this point here and I'm just roughly just dropping in it doesn't have to be the exact we're just talking about a specific move in price okay from around the 127 57 low to 134 50 level okay That's a pretty significant means of movement between one point to another now in terms of pips we're talking approximately almost seven hundred pips rally from there okay and we were talking about the cabling fiber making the low back in here both this point and this point
here so this says no surprise to us in terms of ICT concepts if you go back and on YouTube I actually talked about the cable acts I'm making the very low well in advance based around that Some of the principles were going to talk about here and also I'm gonna build upon what's already been released in my previous works so now if we understand this has been established okay this price moves been established by the large institutional Smart Money traders okay those that have huge blocks of trading that will push the market all over the
place it does not mean that there's not short-term selling opportunities in here okay I'm not I'm Not negating the effectiveness of short-term or day trading contrary into the larger time frame I'm not saying that but this series is really designed to get you focused in one only trading with this tide okay and when you start trading with that it's same thing here from this high to this low if you were looking for shorts in that environment your trades number one are gonna be quote unquote high probability because you're trading In sync with the higher time
frame macro perspective okay because we're looking at a daily chart and this flow okay of orders moving lower okay it's gonna drive pricing lower even though you'll see these minor little blips going higher intraday okay those are rallies that you sell in too much in the you know sync capacity on the flip side of that all during this point here any decline just sets up a retracement in a up move okay so you're gonna be trading Retracements lower into a upswing in price okay so you're basically buying dips in a rally and you're selling rallies
in a decline okay so it's the markets moving lower you're gonna be looking for rallies to sell into that flies in the face of what generally neophyte traders anticipate or expect to do rather okay or react to okay because generally retail neophytes don't have skills to anticipate they simply react you know an economic report come out you Know five minutes ago that they had no idea was coming because they never pay attention to the economic calendar something that a seasoned professional will always consult prior to the week beginning in fact I know what's coming you
know for the entire month and I have certain dates that I circle where there's going to be high probability volatility okay because I view market economic indicators and reports that come out you know you methodically out Throughout the entire month these reports okay are injections of volatility and I look for them to set up or can confirm a continuation of an existing move I may either be a part of or looking to be a part of so I'm anticipating versus what the neophyte traders do and majority of the folks that populate these online forums that
you know where they appear as if they may be convincing other people that they're Smart or or they're intelligent or they have a service that's you know useful so therefore I'm going to sell for $25 a month or $120 a month or whatever okay those individuals okay they are nowhere near the degree of trader that you are looking for you want to go beyond that okay and to get in the realm of what we consider on underground traders like myself or folks that are just really out there killing it and they don't we don't really
care who believes what we're Making we don't we don't care about that you want to get to that same line set as well okay and the concepts that we're going to be learning in this this particular video itself it's going to be hugely impactful to your trading if you apply it correctly and it's very very simple procedures so I'm pretty confident that it won't be taken out of you know - intended context of how to apply it because it's rather simple but my advice to you is is try not to build On this and add
more things to it because we're gonna be talking about candlestick patterns okay but it's not a whole slew of them like you see if you pick up you know a Candlestick charting book you know and I are so many candlestick patterns how do you do how do you arrive at what what to use okay and it's just it's just too much okay it's information overload prior to this video series I presented a whole plethora of general market insight Because it was meant to get you focused in on what specifically is useful when you're digesting price
as it's moving intraday daily weekly you want to be seeing certain things and till you identify the repeating reoccurrence of certain phenomenon that takes place in price you can't get deeper into price action study okay imagine how many of you can speak Russian I can't so for me to learn it I got to go through this long daunting task of Understanding how to use simple terms and you know maybe you're in some mannerisms to commute to communicate that that language in the initial stages it's almost like new when we were in kindergarten as American you
know when we learned English you start with these picture forms this is an apple you start with a very very you know limited scope in terms of understanding and you build upon that well the the original onset of my information being released it went Over a lot of people's heads because they were looking for the get me and get me out and I need to do this every single day and they didn't want to take the learning approach to understanding the market completely okay there's got to be a macro perspective in your understanding otherwise the
things that we're gonna be discussing here okay you're gonna know if you got a full grasp on the general principles that I've released because if this goes over Your head you had no idea what you missed go back over all the previous information that release on the Internet okay and then you'll be able to understand what I'm about to share here because it's simply not looking for a particular white or black candle and therefore it's gonna do this every time it does that don't don't think that okay but if you understand the parameters that we're
gonna cover and why it's designed to do what we're anticipating You'll you'll see that it's no it's not surprise you'll know going into every week of them of the months that you know exactly specifically what you're looking for you know what days of the week you're gonna be looking for you know what time of that day you're looking for it to occur now does that sound like someone that's rolling the dice does that sound like somebody that really doesn't know what they're doing okay the skills that you're gonna learn okay Are gonna give you the
ability to remove all of any emotions that's always plagued you okay and I know some of your beating your your fists on that on the cows probably or your computer desk at work with her come on ICT get to it's a whole lot of ramble here okay but I really want you to understand that it's it's important it's crucial that you understand that this is not needed to be rocket science okay if there's a lot of tools that I've I've shared I've tweaked that other people have created I had my own little spin on it
but some of these things that are just simply there that are very very generic okay they elude all of us and when I first started looking at charts it eluded me as well okay but I'm gonna strip all this stuff back I'm gonna open the curtain if you will okay and you're gonna look through the the eyes of ICT and you're gonna have ICT vision okay Starting now I'm gonna give you the perspective that you need it's a professional trader I'm gonna give you the perspective that you need to see price through the lens of
a price action trader this is what you want to be looking at and what you're hunting and what you're stalking and why you're doing it okay so let's go on and start working on the directional bias concepts and hopefully you guys are all frothing at the mouth ready to devour what is Going to be shared here now there's going to be a very similar appearance to a few of these concepts because I've released videos in the past where they I discovered you know by simply applying a moving average or two it gives me a perspective
to stay with a momentum idea okay and that's generally how the funds and the institutional traders you know keep the momentum going and it keeps you from trying to pick a top and pick a bottom when there's really no need for You to be doing that yet okay what you want to do is you want to start with your daily chart again this is an intermediate term trading strategy where it really is focusing on one really strong set up per week and again if you're a new trader that's my advice is to start there with
your demo account trading don't try to be in there every single day trading but still study on an intraday basis daily after the fact so you can get an idea What price action is doing generally but your your daily chart is your higher time frame okay and again we're not negating the importance of monthly and weekly support resistance but we're just gonna be going to the daily chart as our go-to high in a higher time frame chart okay and go over to videos previously this one where it discloses what timeframe charts you would use for
what's a particular type of trading that you may be comfortable with alright so Again with the daily chart what you're going to do is again using mt4 platform use go up to insert go to indicators you get a guy on the trend you're gonna go to moving average and you're gonna be using the 18 period moving average and it doesn't matter really what colors you use we're just gonna go with this and then you're gonna go and add another one moving average okay and make sure it's exponential it's just To me it just gives you
a better smooth factor in terms of the moving average in the next period you're gonna be using a nine and you want to have this color a little bit different so we're just gonna go with red okay and again that the colors are not important you just you want to know for instance the red one here the nine you want to know with that let that color is in contrast to the slower eighteen period exponential moving average okay Now the importance of having a moving average set like this it what it gives you is it
gives you insight in terms of where the institutional flow is okay if you can't see the price swings for what they are naked this will give you the again quote unquote no-brainer now again it's not to promise that you're never gonna have a losing trade that's not I am promised that no one ever can but what I'm giving you here you will not miss the two to four really handsome Setups per month okay and if you just do the simple math on that that works out to be about a one shot one kill per week
that's all you need to make a career and I'm talking a wildly successful trading career and I know that flies in the face of what you're expecting or which you currently understand but I'm promising you if someone consistently draws 50 pips every single week out of the marketplace if you know how to do that and you can Control your equity and know how to apply it you know systematically you have absolutely no idea where that can take you and it's crazy amount of money crazy crazy insane amount of money if you understand how to do
that but the problem is you made them you made a simple trade last week or yesterday and you love that feeling okay you get addicted that to that moment of astonishment okay so you want to go back in there and do it again because you Like that feeling you need your fix that was the hardest thing for me to overcome and I'm promising you that's gonna be the hardest thing that you're gonna have to deal with because you know when we first get involved we connect we can expect to lose money okay and for whatever
reason we'd like to block the losers out and only focus on the winners but you need to be able to look at them you know the same way their trades and you need to learn from them but more Importantly when you make money okay you need to act slow when you're trying to make money and then act fast okay or react fast is your only time you get permission from ICT to be a reactionary trader you react quickly to preserve or protect your equity or capital you move slowly to attempt to make money okay fools
rush in where wise man shreds softly and slowly okay we don't plunge in there trying to just go in and try to make the next dollar I want to know what I have is lined up with the higher time frames there's a nice support resistance level momentum is moving higher order flows moving higher then be looking for our long okay inner kill zone based on you know to retracements back in an existing price swing and we're going to talk about that as we go along but for now the building block starts with having the two
moving averages right here okay when the nine period moving average is below the 18 What that establishes that's your framework for when the nine period or in this case red moving averages below the blue with 18 period okay that establishes a bearish framework okay in other words or I like to call a sell model okay our sell program rather and what that does is it gives you the green light go to look for selling opportunities to be a bear okay or you want to be sung in two rallies okay and When the nine period is
above the 18 period what you're looking for is buying opportunities where you want to be buying a dip okay intraday or over the course of a few days if you're a short-term trader as we make a retracement lower okay all that's doing is it's creating a new buying opportunity okay and that's what keeps you on the right side of the marketplace and you arrive at what was discussed a few moments ago what classifies a trade As high probability this is high probability okay and what I want to draw your attention to and here is again
avoid the notion of having to feel like you have to pick the tops and the bottoms in the marketplace okay there's tools that I have that helps you do that on a higher time frame macro perspective but we're looking at more dynamic trading they saw how you get into the trenches immediately start applying the tools okay on a weekly basis and then Hopefully in your demo account you'll see the fruits of your Labor's but also I've just I specifically chose this time frame because it will it will force you to not over trade which is
one of the biggest huge barrier for new traders day trading is not every day trading okay and I'm not teaching you day trading here I'm teaching you high probability one shot one kill kill them hard I mean just knock them dead type setups where if you just sit back and you wait for These types of setups and you're demonstrating you'll see a huge increase of your your confidence your understanding the marketplace you will hone your patience you may not have patience now but using the concepts in this series you are forced to hone your patience
okay a lot of folks that I have been contact with over the last few years because of my presence on a particular market form they have struggled with patience they Have struggled with these you know these demons if you will internally so I'm forcing you go back to this type of perspective okay and then when it's gonna limit your excess trading it'll take it down a huge knotch okay because you're only gonna be trading at maximum you know a few times a week okay dependent upon the kills and and the setup and you're forced to
have a larger perspective in terms of your Analysis so really the worst case scenario I think that a trader would have would be maybe you know 12 to 14 trades the entire month and that's still might in my opinion that's a busy trader I know some of you guys get in here and you five or ten minutes and you catch a five or six pips and you and that's wonderful if that's what you do that's that's wonderful I just think that's just crazy but I used to do it and it doesn't pay off the Amount
of time you put in if you have this perspective you're gonna see it wasn't out of water and I'm not saying a whole lot of time in front of my computers okay and which is what you want to be doing to professional traders don't don't live in front of monitors okay they don't do it junkies do okay action hounds do and they may do a trading for a living okay but I'm I'm promising you their own edge all the time they're probably dumping Gallons of caffeinated drinks in their body okay inch high sugars and and
just their health probably really really stinks in terms of not being a part of the real world outs away from these charts so this is going to give you that ability to do that so I mean we already identified when the parameters are in place for a selling framework okay when the nines below the 18 and then when the nine is above the 18 that's the framework to be a buyer Okay again do not do not worry about catching these turning points okay don't worry about that because what I'm allowing you to do is you're
gonna run to where your trading stops being profitable and you'll have to number one adjust your equity you'll have to calibrate your risk to reward you'll have to calibrate your leverage based on your equity decline okay too many folks overlook that okay and this is gonna force you to do those very things okay Professional traders and money managers we do that always on a daily basis we're always looking at what we're risking what we stand to make and how are we going to remove that risk to zero and in lock in a profit that's where
the majority of my analysis is it's not looking at charts I'm waiting for the by says the five signals and the sell signals that's that's the easy stuff the hard part is knowing that the markets predisposed to go higher and in fighting That urge to risk eight percent of my account you know twenty percent of my account because I see this stuff happen all the time you a reasonably expected and anticipated to how unfold but there's no guarantee it's going to okay so I'm giving you these these skills okay to work with and give you
a mindset that you know hopefully will guide you to inconsistency so let's look at a just a brief sample set of how this is Applicable we're just gonna go and scroll through just briefly okay and we'll start here again I'll just I don't want to go back too far because we could make a huge you know treat us over this whole thing and really not get to the other things that I want to cover but we have the the nine period break below here now price can stab through both of these moving averages okay that's
not important in here the important fact is is that if the nines below the eighteen Your mindset is I'm looking for sell scenarios and looking for rallies to sell into okay and you can expect the blue line or the eighteen period okay to act as like a dynamic support resistance level okay I don't like trend lines I don't have faith in them okay but when you have a moving average like this it just it allows me to anticipate price reacting it's very nice example of it here okay a nice example of it years well and
the bodies of the candles Remained below the 18 here here so even though we did have some wick stab through it the body itself was unable to close above and then remain lower and you can see that the result of the market action was going to the downside so when you have that in place okay you have that in place it allows you to number one view the market with a higher level institutional momentum perspective okay and that's a whole lot of words there and I'm not trying to be wordy or Sound intellectual I'm trying
to communicate the understanding that I have in the marketplace because I can't if there was a resource for me to say hey good in this book and this is what it teaches you I would have saved myself a lot of trouble but there's no books I said I'm aware of and I have a huge library of it so I this is the way for me to create it like a language or vocabulary for us to interact so you can understand the concepts okay so when we Have the nine period above it above the 18 we're
buying and when the nine periods below the 18 we're selling okay that by itself will get you into a whole lot of wonderful sweet little sweet spots in the market we can just take these opportunities and be happy with that but because I'm ICT that's not enough okay I got to take it to the nth degree and we're going to be looking at how we can further amplify the effectiveness of Directional bias understanding with now we're gonna look at a series okay of we'll just use this low area to okay in here that was a
bi area from this point in here to here was a buying area and right in here became a selling framework where you're really just focusing on being a bear and we'll just use that because that's a nice little price swing in here we can work with them and what I'm gonna do now is I'm going to take the moving averages Off because of our we've already established where the averages have communicated the bullishness or bearishness that we should be focusing on okay so now with those moving averages away we're gonna apply now market structure and
order flow okay and or market flow whatever you want to call it but the premise of where swing highs are taken out to the upside okay that is momentum on the upside in addition to when you have these little Areas where market is generally looking to move higher or lower based on these two components blend it together and what I mean by that well we're gonna go up to the indicator thing here at one mt4 and again i do not require a five-day or five candle pattern to create a fractal okay and when I say
fractal it's this little thing of a bob that's on mt4 and I probably said use a different color which what I'm going to do now and then we're just gonna use we Use red that will pop off pretty good all right in here we have a fractal high or basically a swing high you know it's it's a candle with two lower hide candles on both sides of it for me am i treating I simply use this candle with the higher low here I'm sorry with the lower high here and a lower high here okay between
this pattern in started this candle this angle in this candle that alone would have presented a swing high to me and if that was violate On the upside you know that would been enough for me okay we have a swing high here we have a swing low here we have a sling swing here as well now as price moved above this swing high here right there now we have both swing high broken out or market structure has shifted upwards Wow we're in an area where those two moving averages are implied momentum is bullish okay so
from this point on here we are looking to be a buyer we're gonna be Looking for a retracement of some sorts okay to be a buyer in okay now you see a minor little retracement in here and then it rallies off now even though we have a bearish candle here okay we did move higher just in terms of pips from the time it broke this the swing high here we're gonna use that range to the high up here that's a hundred and seventy nine pips okay one hundred and seventy nine pips that's inside of one
week do you think you can get 50 pips Out of that is it reasonable to think that one would be able to I hope I hope do you think that at least okay again we have price still above this swing high and the only recent swing low prior to that point is here so as long as the price doesn't break that swing low we are still bullish we have a swing low form here but notice that that's the only one since this one was formed so mark structure and order flow suggest that we are still
go for buying Opportunities okay now price retraces again okay inside of this range and we broke this swing high here so when that breaks this is the range right here this is that little price move here if we looked at just that range alone again we're working on a daily chart guys this is not an intraday chart if I look at using the fib Johnna draw as you guys can see here's the seventh race in it level right in here okay now true it violated Just a little bit but ultimately it spent very little time
okay blowing through it going on downside and then we moved higher again that by itself is insightful because number one it allows you to understand where these fractals are forming okay and I'm saying fractal in sense of the price pattern not these little errors okay that's probably confusing I wish they would have named this indicator for DISA swing highs and swing lows is Something different but bill blames for whatever reason felt he needed to call it that and it's not a fractal by my definition or many others I feel if he really looked around but
we have a price rally from in here up here now we're going to talk about how this could been viewed in advance before this happening where over here something goes on that's useful to tell when there would be an opportunity to be a buyer but before we get to that here's another opportunity Just by using the range that's a hundred and 30 pips from that point to here again within a week's time so there's plenty of opportunity to be profitable okay and catch your 50 pips or so a week and again I'm trying to give
you a realistic low-end objective that flies against everybody else teaching that you got to make 2,000 pips a month okay because you don't need to do that and my question is this if these guys are making 2,000 pips a month okay or 20,000 Pips a year why aren't they billionaires think about that there everybody selling courses why is it there a billionaire out there okay because it's crap okay look yeah you can have a million pips all you want it's how much you manage your money behind those pips okay and I guarantee you 99% of
them don't do right things with their equity and their money so just something because you're showing me a spreadsheet or you have a video on YouTube saying you made you know X amount of pips it means absolutely nothing to me and it shouldn't mean nothing to you okay so again think you don't need a whole lot so if we're gonna focus on just on 50 pips a week that's a realistic obtainable goal and it's something that could be duplicated over and over and over again it's like a dude like a cookie cutter approach you keep
doing the same thing over and over and over again sometimes you run out of Dough okay and what you gotta do you gotta follow it up and work it out again spread of thin spread a thinner it means risk less okay cut back your equity okay and then you keep doing that same thing milk it for all it's worth doing the same thing don't deviate don't change the parameters and then Y approaching the market like that number one you're not gonna be surprised when you lose money because you need to know that okay that didn't
work and I'm not gonna be Jumping back in again because my system or method or parameter says that I can't so I'm limiting my exposure in my engagement to the marketplace to just this okay which is hugely important because 90% of traders don't do that okay now even in here now this is why I don't like candlesticks because it's very deceiving if you are looking at price action on a specific manner and then what I mean by that is this we have a low here okay and if you look at the Range between this low
of this candle to this candle here we have a price swing okay if you looked on a lower intraday price model you'll see that this is a very nice price swing okay it's disguised many times because many I think you folks don't even look at a daily chart but this here is a range okay this is a tradable range if you look at what was available from that retracement okay again cancel the idea of this being a bearish candle This account bearish candle this a bearish candle price moves from this low to this candles high
here it's a hundred and twenty three pips again that was made during bearish candles okay even though the market did come down here I'm not I'm not you know ignoring the elephant in the room here if you will on this two or three day down move I'm not suggesting that didn't hurt or wasn't significant what I'm saying to you is if you stick To the model of looking at the low to high and then a retracement during an ideal time frame okay notice we didn't break this swing low that formed here we came down into
the range between that candles low and this candles high if we use our fib pull that up okay we have a reasonable idea where to anticipate again where the low should form okay and if you looked at and I'm probably splitting hairs but I really want to communicate this well we're only talking About 11 pips from where the Senate I said chasing level is and where the actual low that candle formed okay so again when we get to stop loss placement and you know overall risk controls you're gonna see that there's simply no reason to
fear where you should be placing your stop at okay there's no there's no reason to to guess as to you know am I gonna get stopped out and fearing it also because if you get stopped out where we're gonna teach you You need to be getting out of the market there okay because it's probably much more will move in against you then if you were to stay in it okay so we have an opportunity to be a buyer here as well the market comes down creates another consolidation and then moves out of the consolidation okay
and the market structure and order flow shifts bearish here when we trade lower right there because we broke that swing low now when this broke down okay we have to wait for Another shift in market momentum okay and this is the reason why I do not like this little fractal indicator okay because memorize told you earlier that all I requires three bars or three candles to create a swing high that's occurring right here notice there's an absence of fractal arrow like it does here that's because this big ol candle here okay it's high it was
above this candles high which would negate the formation of this arrow or an error like There's a fractal up arrow because the the parameters required this candle to be a lower high than this one but is this not a swing high yes because that has a lower high on both sides of it okay so this is a swing high as soon as this candle broke here we're back on the bullish momentum okay and then we entered this range here okay we started another series of days where there's two moving averages have the nine above the
18 moving average so that we're in a Bullish framework when the market structure is bullish okay because I'm again we see this swing high here when it broke to the upside now we have to wait okay and expect to see the nine be above the 18 again we're looking at a daily chart during this time period what you're going to be looking for is opportunities where price again finds support pulls back within a range okay either on a 4-hour chart or a one-hour chart and When you see what we're going to be talking about later
on in this video what you're specifically looking for and hunting 90% of time it's there and there's no reason for you to rush to chase price if it doesn't do these types of things you don't take a trade okay so again we're looking to be a buyer here and all of the ranges in here again with all these candlestick patterns you could have all kinds of articles and such oh these are the the spinning tops These are the you know doji's and and you know whatever you want to call it the boxcar willies I don't
I'm not a subscriber of you know a plethora of candlestick patterns really I like the the doji's long-legged oh geez two hammers and I like railroad tracks and that's about it I don't have any other faith in any other pattern so you can kind of like leave that in your notebook don't ever ask me about candlestick patterns outside of those Because I don't subscribe to the views that they're useful okay now on a daily chart we have the highs in here okay and look at the bodies of these candles you see that this is where
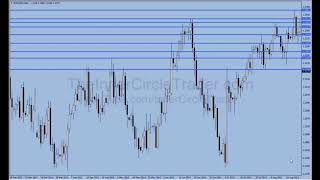
I'd like candles okay these are these are the ideas that I think are beneficial to using candlesticks do you see how this dealing range level okay if we take that out see how the bodies account here the opening was at that level to close of that candle was At that same level the opening was just a pit below that level here and the close of that candle was I'm sorry to um I've been saying that wrong sorry the close of this candle is on that and the open on this candle is at that same level
and the close of that candle is just a pit below it and the open on this candle is right at that same level do you see this candle here okay after we had a little minor retracement in here okay we got a retracement this is the Range because we have this dealing range here when price it broke through it okay see how this is a swing high and see how this is a swing high when price broke through it market structure confirms once again that it's on the upside okay but we also have this dealing
range support so we broke through this now just because this would be classified as support level an old resistance turn support it does not mean that price needs to get ugly back down there okay So what would you how do we use that information well if you pulled your fib from that level up to the range high which is here okay that can't look as we pulled down into intraday okay inside of that range you come right down to that 17.5 level okay you see how that's useful to you we traced within that so having
that that gives you an idea again where to anticipate price action to retrace into that's not that's not all of the Characteristics we'd look for but we will be looking at other things that you know allow us to break down on a four-hour chart where we can also look for you know institutional order flow that to support the idea and the notion that we should be expecting higher prices and again we move higher and higher the higher swing lows here okay again are higher in each successive move higher okay and then we see market structure
breakdown in here okay and we Did rally off again in here a little bit okay while we're in this screen by framework where we overall would still be looking for opportunities to be a long trader I want you to see the the low here or this low here either one they're very close and in proximity but we're doesn't use this one here if you look at that low up to this high you see that I'm gonna move to fit over here so you can see the lines what I did was I used the range of
this low to this high Again this is a daily chart price comes right down into what level does 79 percent recent level look how many opportunities where price stayed within that optimal range okay and right up if you look at where we were in regards to that price movement again using these bodies of the candles up to the high of this candle right here that's 156 pips again 156 pips within a few days that's inside of one week's range there should be no reason why you Can't capture at least you know 50 pips out of
that okay the opportunity here okay the bottom line is is there's opportunity for you to make money and still quote-unquote be wrong because all the market did move lower outside of this area here okay and then we moved into a selling framework okay you have the market break it down making lower lows okay and lower highs so we have the swing high here with a fractal now I got To change this fractal to a different color because it will not be seen against the red so we have this fractal low here price breaks down through
it again confirming that we are in both concepts agreeing with lower prices we have the two moving averages the nine is going to be below the 18 remember when we marked out this box that was given you the bearish framework to expect lower prices momentum wise institutional edict gonna be looking for order flows Lower okay and you see technically they are moving lower because we see those swing low here break down okay so when you see that happen you were to be doing is you're gonna be looking for the ranges okay deform you're gonna be
looking for rallies you're gonna sell into those rallies see this low here and we see the price actually move up here this high down to that low talk to the 62% chase minute level okay and again we're going to discuss a concept that is Useful in terms of institutional order flow where we can again identify areas on a lower timeframe where this is again one more area where water flow and short term market structure shifting and where institutional order blocks re traded in to to get a another piece of the pie if you will before
they start to move lower you can see when the market moved up into that range it did not spend a whole lot of time there and that's why you had this very thin wick okay The market opened here rallied up and then traded lower and closed low and that's creates that black bar okay the close is near the low of the day you can see the clothes on this candle is 130 64 with the low at 130 47 gas price moves lower it breaks each new successive lower swing lows and each swing high is lower
as well now we have again an opportunity where the market creates a swing low here trades lower okay and comes back here and takes out This this swing high okay that's gonna happen a few different times while we are in training environments because again you're going to come back and take the stops and search for liquidity whenever you see swing highs like this on a daily chart naturally that's where support resistance is going to be implied by traders and they're gonna think that their stop-loss orders or protecting above that and you'll see the market rally
operates just above it take It out and then break lower it still does not change the fact that we still working within a range okay and that being this high to the low and if you look it up in here you'll see opportunities to be a seller on the lower timeframe again when we break the lower here we have everything in an agreement as well okay and I'm going to subscribe to the notion that you probably may have lost money here or missed opportunities we're just gonna Call this a dead opportunity area where we didn't
get any kind of reasonable positive equity increase there was nothing that we profited from in here everything gets back in sync here when this candle breaks below this swing low here okay and then we have the high here is penetrated here so now on this candle everything is bullish okay inside of this overall sell framework so what we doing is what we've to sit on our hands until when here okay we expect what See this low here what is that that is a swing low again the fractal indicator arrow is useful to communicate general support
sorry its swing highs and lows but again this is the reason why I don't like it by itself because it will avoid printing an era where I would classify that as a swing low so when market opened up down here market structure and order flow has shifted to bearishness again okay and this being the most recent swing High soon as this candle closes and this one opens up this one would be explained high to me this is a swing low and everything would be bearish here okay and until that high is taken out on the
upside okay or any newer swing high forming it's taking out I would be looking for lower prices okay and the same thing happens here we have this swing high because we have a candle with a lower high here and lower high here so this is a swing high to me okay price Breaks through it here so now we have on a very short term market structure being bearish okay I'm sorry bullish again inside of a bearish framework so we're looking to do what we're selling in two rallies we're selling in to it okay so this
is where you're going to be applying the what we commonly refer to as market flower order flow you you will see on a daily chart many times rallies going against what would be considered market flow being bullish in other words This we have this swing high here it's a candle with two lower highs on either side of it when this candle blew up through it we would be considered bullish daily market flow or order flow but you have that range here that you got to work within okay and that looks like this you see how
we went right up into that area here both candles stopped dead on the 79 cent tracing level and then boom it moves lower okay now we have Everything back and sync again we have this low taken out we have both the framework on the moving averages suggesting lower prices and the order flow and mark flow is bearish because we took out the swing low so everything's moving lower again we be continually looking for selling opportunities okay and inside this area here now again we have the market creating a nice rally and reversal again we are
not trying to call the lows we are not looking for the You know the tops and the bottoms in the marketplace so even if we were to take a trade in here somewhere okay something lent to our analysis that we should just suggest taking a short trade and we got stopped out what do we do we accept the loss and we move on okay right in our journal keep it you know as a learning process and continuously looking for the next opportunity all this right here okay would be the same information this Applied going forward
now this we only had these two examples in our analysis and study again we had two that red area area in the two green areas inside of these pockets of price action there's more than enough opportunities for you to take trades just using the daily chart okay but if you use the 4-hour chart you'll be able to glean a better understanding of what it is that you're not going to be hunting but before we do that let's strip the chart again And we're gonna take these fractal things off here okay and what I'm going to
discuss now is what specifically is inside the candles that's useful to us okay and why consolidations breed opportunity we have an area of consolidation right here and I probably should take these rectangles off because there you go and we have this consolidation right here okay inside this I'm gonna make it blue in this little area here Okay smart money is accumulating now how do I know it's a um accumulating well because number one prices already moved off of a an area where it caused a reaction okay inside this reaction this price move a higher okay
we're talking about a daily chart moving four days to the tune of about four hundred sixty five pips okay retail traders can't do that so institutional funds and institutional traders will smart money will this is The elephant putting into foot in the water okay then we go into a consolidation its pausing in here traders chase it thinking okay what's been going up I'm going to keep buying it and they get pounded here to get pounded here get pounded here and at this point they say well it's probably not gonna keep going up so I'm gonna
be a seller and what do they do they sell a breakout okay or they so you know whatever pattern they think is Beneficial to them and ended up getting caught on the other side of the market again we as traders okay here's what we're gonna take a huge step right now okay you need institutional sponsorship in your traits institutional sponsorship is when you start seeing things like this this market moves up moved into the consolidation this is where pairing of orders is taking place okay institutional trading is building up positions all in these areas here
okay And what you're looking for is where areas of where the market has moved with a great level of conviction okay if they can move the market almost five hundred pips here and it starts pausing chances are it's probably another leg up and what do i mean by that well if you take this low to the high in here if you see that range here it's probably gonna look to make a move equal to that same thing okay and here's a low we're gonna use basically use this because usually the Same just here and here
is basically the same price and you take this out in time you can see the market did move in the fact to that same price level again it's just like a measured move taking the swing and then consolidation and expect another move higher what I want to draw your attention to is again on the daily chart how I like to view the market is its see this candle here ok if we look at that just can lit right here here the body of that candle okay is to me The most useful portion of it okay
when price rallied up okay and consolidated and moves out of it and King right back down into it but what's unable to break this low we are in a consolidation okay in this area in here okay something's going on institutionally speaking I don't know exactly what it is but I said I know that there's something that traders on a large institutional basis want this price for whatever reason they think there's value to it Okay and what we're going to do is we're going to be looking at this whole area here and I really should be
using the highs of candle not just the body but this whole area here is important because this is going to be an institutional order block okay when price rallied out of that and came back one more time okay they did they dipped it below this area here to clear out any kind of stops that would be interesting there okay and it's a stop run one of The most important things you can have in your notes are is if the price can come back to a key level support resistance sweep through it one more time okay
and then fail to keep going that's generally a sign that was a stop rate and they're going to ready to do a major repricing going the opposite direction in other words contrary to the direction to stop was ring on summers they drove it lower here to engineered it lower to send it higher okay why do They do that because they want the orders that are in existence down here okay so what do I mean by that well we had one little or block in here between this candles Hyannis candles low okay when price rallied out
they couldn't get all their trade on so what do they do they stop their buying okay and with they're not buying price will be permitted to trade lower and then they'll support the market again because why they're buying comes back into the Marketplace in here okay and they're buying it up again that's going to control this decline and keep from going back into this area here because they already have established positions back here they don't want those violated they don't want to see a net loss in there so they're gonna add more positions in here
supporting the market again don't think like a retail trader think like the bank's the institutional guys they want To keep this thing they have a vested interest in keeping this market up so if they wanted to move higher they're gonna be buying it at a level where they consider it valuable okay or a viewing perspective on the marketplace edits it has a worth of some sort or undervalued if you will now as price moved out of this area here again this is that consolidation area we just had it blocked off as price move out of
that area here we have market structure shift Here again to the bullishness to this high was taken out here so let's draw that out okay we are bullish market structure here price rallies up again and then we had this decline okay now remember earlier I was discussing the just yes it was three days where it was bears I'm not ignoring that okay the reason why I was going to come back to this example here because this is exactly what I used to get in these types of trades if you look At this area of where
the institutional order block was okay and again how am i defining that because we went into a consolidation we rallied up okay and you want to see a conviction a very strong conviction in the marketplace and when you see something like this where it moves several hundred pips retail traders can't do that so that's the elephant putting his foot in the water and when the price comes back down okay and it gets back in the same area we can Reasonably expect to see it to do what we expect it to rally and when it rallies
up and breaks these highs we know that they are really putting an effort to keep this thing going moving higher now watch we're going to take a huge leap forward okay this area here because we use this first candle it's the bearish candle okay prior to the first rally if we took this down to a lower timeframe what do you think this is going to be there's going to be a Market structure or a market flow or order flow reference point where if it breaks to the higher side we would expect to see what bullish
prices okay but also it's during down candles okay or down moves is when the smart money accumulates positions let me say that one more time because it went right over your head I'm sure smart money or professional traders do their buying on down moves they do not chase price they buy it when it's going down Okay when the market strong harms or struck Smart Money traders want to sell they sell when the market is rallying up they don't sell it when it's dropping down okay so have that in your little notebook you want to be
doing the same thing which is one of the strongest components that makes up my trading because I'm a buyer when that markets moving lower if you were watching this series of two days here on an intraday basis this is probably like it was like A bat out of hell okay screaming lower and it's probably gonna keep on trading lower and lower lower you have to understand on this higher timeframe daily chart what was taking place see this whole area here we do blocked out we have two areas of where they have created two large institutional
order blocks I'm going to show you the second one that took place see the rally it took off here the the bearish candle right before it taken off Is where you would have your expectancy of market structure shifting on the bull's eye rate in here okay now let's price rallies off this low here okay and again I think this is a consolidation in here so with this consolidation there's opportunity being bred okay and as the market moves higher okay it moves up in a rally and again you can de trade in these moves following that
consensus a daily chart so moving within this price Swing we can recently expect you know intraday trading opportunities which is beyond the scope of this teaching again but as price moves up and makes this price swing here it starts to retrace back in we have to order block areas that may be utilized as retracement opportunities okay you have this one here with this candle here which is the first-down candle prior to the rally up in here okay so above this high here would be The indication of a market structure shift on a lower timeframe so
when it breaks above that if it comes back down to that same point of origin this will be a likely candidate for a buy now I want to draw your attention to here is the the fact that we didn't get lower than these lows here really doesn't negate the the validity of this potential area it just means that they had enough of their orders established in this area here on this front and Prior to this candle making this here in other words this down move here all these candles moving up breaking the swing high here
okay this is the first down candle the high above this candle here when it broke here market structure in the lower timeframes was bullish okay so when we see that price comes right back down dips into the same order block here now I went a little bit lower again but if we extend this in time I'm going to illustrate what it is specifically That's going on an institutional level that you need to be aware of to help you with your trading and I'm gonna take these lines off cuz they no longer are serving a purpose
okay so price comes down again member at least these days here we're talking about earlier if you know as price ran up here we were in that bullish environment where the averages were indicating that we're likely to see upward pressure when price came down Like this we can sit back and wait for price to enter back into an area of potential institutional order so when we have price moving back into that this is where we start understanding the mechanics behind the ICT optimal trade entry pattern and let's take a look at that now we have
the swing here from this low up to this range high here okay so we have the low here and the high here price comes down and slams right Into that 70.5 level or sweet spot like I like to call it that means you could be buying anywhere around that 130 big figure not factoring in the spread obviously about 3 pips as the best is a safe bet in this case one 3006 or one 3005 is that's a good number that you try to get long in the the low prior to that this swing low here
would be a possible scenario to had you were expecting this candle here if it dipped down lower we could have cost to 62% There okay so I get a lot of questions so why I move my fib to certain swings and such and now you're understanding really the mechanics behind it all so let's look at the optimal trade entry a little bit closer and understand some some central tenants to it and what's specifically that pattern really capitalizes on when we have a market take out a swing high like this okay we have institutional sponsorship that
takes the market above okay and when it Returns back into an area of previous consolidation we expect that to reposition or assume more Long's okay so in other words they're pairing orders in here they're allowing the market participants okay to see this quick drop down okay and that's one of the things I find kind of interesting when when the markets are predisposed to go higher they have these really wanted to quick down dynamic days okay and it kind of gets you all Fluster didn't thinking you know hey look this markets probably gonna go lower in
it if you're really sensitive to the lower timeframes like you know one five 15-minute and even less than hourly in any capacity it's very easy to swing your daily bias based on that and if you learn to start looking at these daily and for our charts it helps you hold on to a longer term perspective and you're less likely to be lulled in the swinging back and forth on a daily basis You know your daily basis being bullish one day embarrass the next you can see really when when these moves really take off there are
several days that they move ok then you have a retrace and there are several days where it moves then you retrace then there's really dynamic you know several dynamic days on the upside once it really starts to move out when you find that it's fulfilled its order block ok you'll see that there's many times a Very little time for you to catch the entry point so you got to know these things in advance and that's why reacting to a price is not really the best-case scenario but as price moved down into this range here ok
you can actually see in this smaller consolidation ok I see this right here little area right here let's use this rectangle to highlight that and we'll do it so I actually go down into a smaller time frame for our chart and we'll study That little consolidation as well so we're going to assume for a moment that you were not privy to knowing this order block or institutional or area here ok as we moved into a consolidation in here ok what we'll do is we're going to drop down into a 4-hour okay and you're going to
see that same underlying pattern we have a swing high in here which is broken ok I'm gonna recap the pattern what you're looking for this is how Institute Institutional trading can be mimicked okay you have an area of potential support which we've already identified on the daily chart market ran up no need to swing high came back me trace now you can trade this with the pure understanding that's a support level and this could be your retracement here okay now again that's a four-hour basis you could do that and the reason why is because you're
using the same underlying premise that prior to this move up the First down candle prior to it which is here if price returns back to that range as it does here okay and drop a fib one as you can see there's a mechanics behind it okay you can see the 79 cent recent level stops it dead to rights boom right there okay and then price rallies up in here when we have this break here on a four hour this is much more dynamic when you see this take place okay flip this in your notepad if
you see the overall pattern on a Four-hour chart break like this and your overall bullish still on the higher time frame daily man get ready because it's going to have a dynamic price surged higher once we have a return back to the point of origin the point of origin is what we discussed right here and then when price moved up here again the first candle that's down prior to do the rally up once price rallies up away and breaks to swing high like we just discussed right here we have this rally up we wait And
when price returns back to this point of origin right in here okay this is where they dip back into that order block okay so they had their orders here they came back they want to get an average fill around here that one thirty twenty maybe one thirty thirty level if you look over here you see that's the case price comes down dips back into that order block again okay they spend about a day or so in Their acquiring more long positions okay now what we'll do is we're gonna use this swing low here up to
the high here okay using that same range and you can see the center Center a certain level right in here is containing the bodies of the candle and there's only been two little wicks okay we're talking about maybe 3 pips that it violated the second I sent racin level so if you were using just a 10 pip stop below this low here and I don't want to get into stop-loss Plate its placement yeah but I just wanna give you a little hint as to what's going on if you were you're buying in here to 7i
Senate race on level I modes be fair and say you're buying it to 70 and 70 point five at the low here's 37 pips and your stop to be 10 pips below that would be at 130 oh four okay and that means you'll be risking fewer trading just on the four hour basis you'd have to have a stop of 47 pips and that's still very close to What my average standard 30 pips stop-loss is so you can see how by understanding this we've already trimmed down a huge amount of the risk on a four hour
time frame not to mention what we could do if we drop down to an hourly basis and or 15-minute basis which we'll do in a few moments but just stuff for the moment let's just look at this again in greater detail price moves down into this order block price based on this candle here you can see it does not Really dad down here and stab very aggressively it just holds that the sudden high saturation level as we just noted earlier so once price does this in a bikini lace whatever it is that institutionally traders are
trying to acquire I don't have the insight as to what it is specifically they're trying to acquire how much of the position they're assuming I just understand the footprint that they leave in the marketplace so When that takes place okay we know that it's most likely going to have an aggressive move up okay because we had the first run up here and then if for our market structure break here and then you wait for it to come back where it's gonna come back to this is your point of origin right here okay and it could
very well easily come back into this one as well and create less like a double bottom it really does that and reason why is because once it goes down It doesn't want to usually come down much lower than that because other institutional traders may get on board and drive much lower than that and throw off their their targeted average entry price so as they move up here you can see you literally can see it there so there's a buying opportunity here they acquired okay it starts to move too much so to settle down relax let
price come back down again dips back into this little area here okay they buy more of It and it rallies up you can see there's much more aggressive buying pressure on this candle here because it took three four-hour candles to make this range here and then one four hour basis boom they took out of here then come back retrace three traced retrace where's that retracing to the point of origin right here and then all of a sudden they're remaining a block of trace that they want to assume for a long position was acquired here and
then they're off To the races now just trading back to an old high like this let's note that and you can see okay looking for upward targets as like that we're going to use this one first as a as an objective as an example there's 200 70 pips late at your feet and this one here again we're going to assume you traded at around there on the sweet spot and again there's 240 pips so you're really would you be willing to risk roughly 50 pips just trading on a Four-hour basis risk 50 pips to make
240 pips just sound like a good reward to risk hmm I'll leave that up for you to decide as price moved up you can see it easily could quite easily hit this objective and it moved on beyond that as well so with this example here you can see how just please waiting for these scenarios to set up you can trade really a good number of pairs if you're trading on a Hard time frame bases like us because number one think about how much time it takes to set these trades up it takes a good bit
of time also it gives you a an area where to anticipate in the hunt these specific patterns okay so it allows you to the freedom to sit on your hands and wait and not feel rushed to get in here and just take a trade simply because it's something to do so now what we're gonna do is they're going to actually drill in tighter Okay and what I'm doing is I'm actually moving into this little pocket of price action okay so this fractal here we're gonna look at in regards to a 15-minute next go until one
hour basis and see what that does first okay now you can see price rallies up out of here and right in here you can actually see how we're actually starting to fine-tune here's the bearish candle the first one right before you go to move up so if you bracket that out okay You can see that's the the order block in here now again it's anywhere in here specifically okay but what I like to see is like a Fibonacci level and or pivot level in this area that suggests where price may be going also I like
round numbers and in this case the 13040 level is really ideal and you can see that's also roughly the same price point to swing highest now also remember what we talked about when we look at swing highs we like to look at the three bar pattern Okay here's the here's the highest candle in this pattern then the right candle to the right of it with the lower high it's open and closed and high low is important to open high low and close on the high candle or the highest most of the three bar pattern on
the swing high pattern and then this high here the open high low and close as well so when we when we factor those individual price levels you can actually take that out and extend it Across in terms of like a horizontal lines and really specifically wait for price to move down to those levels one eight one I'm sorry are on a five-minute or 15-minute basis and really fine-tune your entry in regards to what may be possible for trimming down the stop-loss orders so now what we're going to do is we're going to take this same
price level here okay and I'm going to look at this small little section in price right here And I'll make sure I'm not getting more than I want okay right in here's well looking for right there and again that's January 9th and we're going to drop down to a 15-minute time frame okay and now watch we have price action okay in here moving up on a very short-term basis okay and comes back down see this candle here that's your point of origin or the rally ensues right in here you Move at out in time right
in here price comes back down into it and then runs up okay same thing here okay we have this rally here here's the candle prior to do rally up it's bearish and if you take that area here you can see it enters that order block again right here and again if you rubbing your fibs on that okay you can get the opportunities where you can take intraday trades and get in sync with the Hard time frame trades as well but assuming that you took that as your entry point based on the hard time frame trade
okay you could trade this here okay maybe get in at 1:30 see what is that price is 1:30 45 let's say 1:30 47s fair and you're using a 10 pip stop below here actually gotta crunch this up just a little bit so you can see where the stop will also be and you can trim back the risk again assuming you're getting long I want to limit at 1:30 47 and we're gonna use this low here as your primary reference point for stop location if you go down 10 pips below that your or your stop-loss order
we get 1 30 27 okay and what we'll do is this we're gonna put that in here 1:30 27 and price comes down but neither comes close to it okay I mean just front so you can see it so you can get yourself positioned here okay and again this is a 15-minute chart so you're waiting for these positions to Unwind remember we're looking at a 4-hour and daily time frame set up so you're not trading it on a 15-minute basis so when you start seeing these Wiggles lower where's your stop-loss down here so you just
simply let it do its thing and price rallies on up and you get excited and everything's you know as you'd hoped it would be okay you can see the point of entry back here and in the ultimate unwinding of That position here all right let's take a look at another example and we see this price rally up off of a daily chart key support level around here and why not draw your attention to in here is obviously this quick rally up and then a bull fight formation in here we have this level and here if
you were following any my market reviews we talked about this level being a possible area of support and prior to the move out okay we had a couple different areas That could have lent to probable areas of support and institutional dealing ranges where order blocks may reside for the institutional level trading and that comes in the form here we have this candle here prior to it to move up okay no where's this move higher and this candle here okay and you see that's the first bearish candle prior to the move higher first bearish candle pardon
was higher and we see also you know just likely support And resistance level based on this enemy it term high on the daily chart we did get an opportunity to see a bounce here okay and that's seen with this move here this was the bearish candle prior to its rally up so if you take the range in here you can see out this retracement would have been a very decent handsome opportunity to get along on price came back down to that same institutional order block in here and rallied up higher and eventually started to break
Down okay and let's take a look at what's transpired here we lost this level here we try to start trading lower okay and this would be the next area to expect some support okay and you can see price trades right down into that right there okay now what I'm going to do is I'm just going to take a horizontal level draw it across the chart like that okay and when you see this this is in the area where to reasonably expect prices to bounce if you notice also the Low here to this high this is
your your price when you see that okay we're retracing inside that price swing so if you take the range and highlight that with your Fibonacci tool you can see the sweet spot ladies directly right on top of that same point of origin right in here price does not move much lower than that again this is a daily chart and price for a lisanna price rallies on out as you can see that there's a definite advantage in knowing where the Institutional level trading is going to come in to the marketplace and I having an understanding of
where that's going to take place you can also expect it on a time basis with the kill zones okay so we have an understanding of support resistance we have an understanding of a time of day we understand where the big moves should ensue and where it took more or less wait for them to you know take place in form based on a higher time frame charts if we if we look at The market on a shorter time frame okay and we're going to apply our tools we learned for the directional bias okay and 18 .
okay and what we're gonna do is we're gonna look at a time frame when price was moving up in here okay and I'm going to highlight that with Oh rectangle in here and what that's going to help me do is show you how to use this for a trade entry and what we're Going to do is we're going to break down to a 15-minute time frame to do that okay what I did was zoom down into a 15-minute time frame and I added the Asian range for each daily intraday action and I'm going to draw
your attention to here is as market moves and this is a Monday okay it's very hard to see here but it's just a double line delineating a Sunday okay I'm just gonna scroll through and here is a Monday and going into Tuesday Here's Tuesday's trading here okay now looking at this you can see how price moved up here and created a range here see this down candle prior to the move up okay we had this rally up here if you take your fib and you pull it from a swing low here up to this range
high price comes down to the 62% of tradesmen level and this is 9 GMT this is the London open ok so there's an opportunity we're being long ok and now with the background being blue like this again What that's highlighting is a time period when on the daily basis we have a 9 period exponential moving average above the 18 period so we have institutional momentum on the upward side of the market in other words we're looking for just buys the framework is established as a bullish scenario so we would be looking for opportunities to be
a buyer here and that's one example here using what we just discussed with point of origin here and when price rise up And trades back down into it we see price move up into its high for the day and now we have another right here ok we have this range here and trades down we're going to use this is the first down bearish candle prior to move higher so we're gonna use that as its basis ok right in here and we have this candle here prior to this move up so we could use that one
as well what you're looking for is clear points of where price moves with conviction okay where it's really Clearly trying to move away you have it here okay and then you have it here is again this is a 15-minute time frame and then price makes its price Ling and trades the lower this candle on the very low here is 1515 GMT so that's like like 15 minutes past the the killzone dat this was established for this trini trading series this here is 15 GMT and this is 14 fit 45 GMT so this is still a
capable trade setup for the New York open session light late for New York but still nonetheless it's something you can take a trade on let's go out one here we have just a marker structure alone here this is nice where you have a low lower low two of them in here and a higher low here so we have an intermediate term low just in market structure alone so that's death bullish by itself without anything else added to it that's that's very good and then we have price rally up away here This is our first bullish
candle prior to the move up okay you can see how we rise up this is your range put your fib on that range right in here this candle here comes in at 9:00 GMT this candle here is 9:30 GMT that's London open okay we also have this rally here and then it comes right back into here's the first bearish candle prior to the move up so this is where the market structure would shift okay and without Having to draw a line you can see we've moved back into that range right here here is the smaller
reference point here's where you would be buying and again 10 pip risk below here let's give you an idea what that will look like in terms of and we're gonna say we bought at the 70 points 5 level at 130 107 here's the low and if we go down 10 pips below that your stop would be at 130 86 okay so approximately 30 pips stop well within the range of probable in trading Back to an old high you could take profits here or take profits here or just look for it at the Canadian moving on
a higher basis okay you can see price moving up here now just let's zoom in here and I want you to see using the ideas that we just covered okay look at every time when the market moves up breaks a swing high okay then comes back down and comes right back into that previous point of origin in other words this is where they move starts and trays Right back into it this is what you pull your fiddling okay I get a lot of questions just you know where what am I looking for why do I
put my fib where why would I use those those reference points like you do on your videos well if you go back over all of the videos you ever see me doing it you'll see me doing this very thing okay and here you go we have price moving up here okay this is a Mondays trading we have the First bearish candle prior to the move going up okay take your range Joey over here okay when you see that here this this candle forms at 6:30 GMT any 6:30 GMT it's about a half an hour right
before the very very beginning of what I like to see in terms of the the meet of London starting you can see how it comes right down to that sweet spot in here okay and also note and I shot I probably should have said this I'm jumping ahead of myself when you're looking to be a Buyer you want to be doing what we mentioned earlier in a previous video using the Asian range high as your filter so now what you're going to be buying definitely anything below this level okay it's an ideal position entry point
again here we have the Asian trains hi this is below the asian range low so that's even better okay and here is the new york session by and again here is the bearish candle prior to the move up okay and if you Look over here you can see we move right back into that point of origin okay so they move right back into that that dealing range and order block and if you use too low in here up to here you can see how we went right down the descending ice I'm tracing the level and
rather handsomely even if you used the low formed in London you're still getting almost a sweet spot here but certainly this 63% of tradesmen level and getting in sync with the daily trend You can see how that's rather handsome in terms of a trade opportunity okay and again we have this point here where we have a New York session low remember we're looking at session highs and lows not just previous day's highs and lows and here is your bearish candle prior to the rally out so you're gonna see market structure shift on this candle draw
that out in time okay because this is at the point of origin where this rally took place so the range that was created here Originated right here on this bearish candle so when the market structure broke here this is where the order block resides okay within this candle this is where the institutional order block resides okay someone market meanders and trades lower or is it good back into that same order block and then you did acquire more the original position they were trying to acquire here that they couldn't get on because the market started to
take off and if you take that And you add that to your fifth okay you can see how here's the sign that said chase unlevel deviated just a little bit and we're gonna give you actually how much it moved below it give you an idea how much and we're talking about six pips I think that's livable guys you guys can certainly tolerate that if you were to use the lower low here you still end up with the sweet spot okay so you can see how using session lows and highs you know with the directional bias
Defined as we just covered in this video it really helps you ferret out opportunities and certainly being a bar down here below the Asia range high okay think of the daily range remember we were talking about the likelihood of big range days if we have the opening price in here okay it doesn't really work both sides of the opening price very much and certainly doesn't work the lower end making the low very much in other words what am I mean by that there's not much Range on the daily bar from the opening to the low
okay and let's see what that does here okay we're just going to eyeball it and we're talking about 27 pips okay 27 pips so it worked lower 27 but moved off of the lows for the day to the tune of 76 pips so it's basically three to one almost okay the the reoccurring principle is simply looking for retracements in an uptrend okay so you're buying dips in an uptrend And if you look at here we go here here's one where it was not able to get down into that price point in here but using just
the optimal trade entry you can see how we got a sweet spot here and I'm sure if you pulled the pivots up which we're not going to do here because I'm trying to keep this video around three hours at maximum which is a lot by itself but nonetheless it's you know certainly it's certainly a long video and here's you know if you see Opportunity in here where you could have even intraday you know price when this rallied up like this your first bearish candle went right down into it with a block right here and then
gave you a tradable rally okay and let's just look at that range it's 44 pips so that's certainly something you can get 20 pips 25 30 pips out of okay and let's drop out one more here's a nice double bottom where it comes right back down to this original Order block prior to it rallying up market moves into consolidation here and really don't have anything that's really discernible so you may be sitting on your hands in here there's one that was this was all right you got this candle here draw it out in time it
moves right back into that same order block didn't move higher again all we're doing is focusing on the buying not anything else just simply looking for buying opportunities okay we have prior to the Move up we have this bearish candle here draw that out in time okay and pour fib on the range here's the set and I set trace on level in here deviate just a little bit below it and this is where you would have encountered a just a trade that would have been a losing trade okay and it's fair for me to show
you this because I don't want to just go through and appear to be just cherry-picking looking at opportunities where it worked out favorably every Single time I don't want to law you into thinking this is going to be perfect and it's not going to give you any losses is certainly would have happened here here's one where it moves deeper below and runs the stops on the Asian range low before running higher we have the same scenario here where the previous day's low which on this in this case is 14 gmt which is a session low
new york session here's your low to hide the range price Drops down into 262 almost a sweet spot returning back to this dealing range and institutional level point of origin where everything when price dropped lower it allowed them to accumulate more of their long positions and you saw the price move on up and profit release portion of the trade unfolded they have another little opportunity here where price moves up first bearish candle on here draw it out in time this is a return to the point of origin back into The order block here and price
rallies up and this candle here comes in at 1600 GMT nice little opportunity to be able to catch a scalper intraday and I'm only tossing this in that's about 40 pips or so in terms of range I'm adding these these these intraday setups to show you how you can use it to be a trader on an intraday basis or a scalper but really what you want to be focusing on is the ideal days of the week which are Monday I'm sorry you have Monday Tuesday and Wednesday being the higher low of the week and again
because we're looking at this area price action we're gonna look for again just the significant lows the farm for the week one let's go back and at the beginning portion of that and just for clarity because I want make sure that this is easy to see I'm just gonna change the color to a little lightly it's a little bit easier to see here's Monday's trading and that's the low the week during the time when we're Looking for buying opportunities only okay so on Monday this week we have a the Monday making the low on this
week here the low the week is on Monday as well nice opportunity to be buying on Tuesday even gives you an opportunity which doesn't fit the model but still everything working towards making a higher close on Friday is the general idea we have a shift in market tone in here where it went lower and retraced much deeper but there was certainly Buying opportunities on Monday Tuesday in even on Wednesday still catching some opportunity to be a buyer the the low on this week comes in on Monday very nice opportunity to be a buyer here as
well and you can actually see this same result of years of down candle prior to move up and it retraces back into that order block and there's your optimal trade entry moving higher and tuesday opportunity a buyer when it's a nice opportunity a buyer okay those are Those one one shot one kill type scenarios that you would be looking for to not trade a whole lot but catch very handsome pips and not I have to do a whole lot of work really the low actually forms here on Thursday for this particular week and again I'm
using the double lines here designing the marker of Sunday to Sunday so the action between those two is the intro week price action nice buying opportunity here on a Monday this week nice one on Tuesday okay does retrace trade or the Mondays low but again still opportunities to be a buyer moving up rather handsomely and we move into an area where and we no longer have the daily bias and force where now we would be expecting to see lower prices come into effect and that's what you see here and really if you just reverse the
scenario and look at everything like we just did on the buy side reversing it For the downside it's much in the same capacity the same thing just reversed okay and let's take a look at the breakdown of what you're looking for with the support resistance notion and the time of day and the optimal trade entry and what specifically that sets up your trade that deems it as high probability okay the ICT optimal trade entry pattern the premise really builds upon the understanding of support resistance and We're gonna use this example here to illustrate the example
of an optimal trade entry that's used for a buy entry and assuming that a support level has been arrived at we have this support level which is ideally a higher level daily for our one hour time frame support line this high here okay this swing high breaking this previous high is good that's what you want to see okay and then when you have price break it again here you have another continent in - a conviction by the traders that are in control of price which are smart money they are indicating to us that they are
wanting to see this market not trade lower okay so if it's not going to go lower chances are it's probably gonna go up and go up sharply now if we see the star here that's delineating a break in market structure okay on both points the previous little short-term high that we just showed and now when the price ran up aggressively through that what we Would be waiting for is price to return back to the point of origin that's seen here where price comes right back down into the first bearish candle prior that aralia okay breaking
market structure here so we now we have a range from here to here okay so we're looking for price really to stay above support not necessarily trading back down to that same price level this is the swing that you should be identifying with your eye this is what You train your eye to see this particular price swing is what's necessary for you to pull your fit 1 by doing that and again noting where the market structure has shifted when price moves back down into this area here it's between the 62 and southern I'm setting tradesmen
level the 17.5 level is what I deem the sweet spot that's generally what I try to aim at for my entry point I may add the pip spread from that point or I'll use the 62% tracing level on Depend upon the type of pet frames between the two if it's not a whole lot you know I'll just simply use the 62 so just to make sure I get the trade as long as it doesn't deviate my overall price parameters in terms of allowing that my stop-loss order to be within my maximum risk per trade and
obviously you can see there's a results of taking this type of pattern with the understanding everything that we've talked about in this video series up to this point in That little gray I'm sorry in that little green box ideally that should be a kill zone be it the lung and open or the New York session open okay those are the ideal trading scenarios for you to be finding trading opportunities to get long in and again with the assumption that the nine day exponential moving average is above the 18 day and when you have that and
also order flow and market flow and market structure on that timeframe daily in four-hour or Suggesting higher prices it's all but a green light just to get in here and start hunting buying opportunities using this [Music] [Music] [Music] [Applause] [Music] [Applause] [Music]