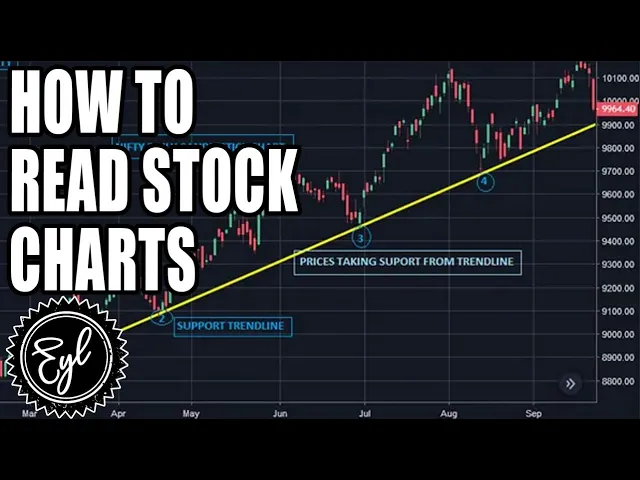
so you guys have been asking me forever to go through charts so i want to save all the cute slides and let's get right to it tonight about how to chart so but first before we do that homework time type yes in chat if you actually went over the last week and studied what happened in the last 47 recessions type yes if you did know if you didn't if you did type in chat what correlations did you find because now in 2020 2021 we are in a very similar time from the 1980s to give you a heads up so please go look and see what happened in that era so you can understand what to do now i know everybody was tripping about interest rates and you thought tech was going to fall to the floor and then it shot up today just do not get tricked out of your spot because of interest rates being high interest rates have been high before and stocks have went up it's not necessarily a bad thing and homework item number three please type in chat youtube and zoom what stocks have you bought this month we are here to actually buy not just sound like we know about the market right so type in chat what stocks have you bought so troy uh called me like man you didn't any trainers on the chart in a while so you should probably should get to it so this is what i want to do i want to walk you guys through how to actually read a chart um and i want to start off here so i had an amazing call earlier with some of the members in red panda and stock club and the brother came on i won't tell you information brother um type write this one down nci nci let me move this out the way i'll come back to it i'll come back to them and say that's not the right one i'm gonna come back to it but um the thing that i uh i want to to ask is like if you are not willing to hold a stock for a generation then how can you expect to have generational wealth i think i'mma say that one for the end for those of you who are on you know but um lennar so the first thing i want you to do write this down i always want you to go to the five year month i always want you to go to the five year month because it tells you the true direction of that stock so this is the company here type and chat is the stock going up or is it going down because a lot of times when i'm looking online i'm seeing people say hey i can't really tell if the stock is good or it's falling down for seven years straight but i think it's going to bounce this direction that you see here is a stock that is going up but even if you're unsure write this down and i haven't talked about this too often the second time frame you can look at is 10 years you hit okay and zoom out you want your stocks to go up and to the right so back here 10 years ago was at 12 14 and it's been going up this orange line is a 72 moving average which i told you guys about before so if we drop down to this price of 55 20 that's what you want to buy put 72 moving average and 52 55 20 in chat please now let's look at home depot quiz time you know i love my damn quizzes what price based on the 72 moving average would you buy home depot at the lesson that i want you to gather from this is please write this down you have to obey where you're going to get in you have to obey where you're going to get in you need one method so whether you use a 200 price channel which i've told you guys ad nauseam to use please 50 20 double crossover a golden cross of black cross you have to obey your signals that you have so guess what the market right here is too high so once we get to these highs it is too high for us to buy so let's go back down right to the five year month and we talked about that it's crazy uh almost a year ago i think it was the fourth episode that we did we talked about fibonacci retracements so if you do this you put the high and literally go to low you can see where the 50 level is on the chart you don't have to guess so 206 37 will be 50 off okay the all-time high is 292 is currently at 288. 94 is home depot a good buy right now for those of you in real estate if a house is worth 250 should you buy it at 247. here's the funny thing real estate is tied directly to wall street and vice versa in 2007 and eight they were chopping up all of these derivatives and selling them right to wall street but they made every real estate investor feel like they did not know what they were talking about when it came to the market it's the same damn thing so at the 75 line if it drops 25 there is some value there we don't want to buy when it's two percent off of its highs because you have no edge there let's look at square one of my babies square it's square up or down type up or down in chat 168.
42 is not a bad place to potentially buy square trading has considerable risk so does investing please consult your advisor or actual shot when we go to questions but 168. 42 is not bad if you've been following me for a while um square is going up so then if you look at this let's go back and look at same thing let's go look at 10 year you can see the direction of the market has been up it's been up i got you brother great so then you can see you want to buy assets that have been going up consistently not slowing down right there's a reason why jay-z decided to partner with square when he launches his find his fintech company do not be surprised let's go look at visa visa is visa up or down on this chart then our entry point will potentially be 1 39 30. now here's a cool thing if you go to a weekly chart you have another entry 194.
90 so if you use one instrument you can go to different time frames and get different potential entries i just don't call these prices out of thin air right so you go month week then day now let's look at the daily chart if we go to the daily chart we're under that moving average so right now you have a little bit of a deal and what you can get and take full advantage of that let's go to jp morgan i did say square's a new jp morgan but there's still some value left in banks if you believe in value kind of stocks they had a rough year last year but they are back to the upside and you can see right here the entry price will be 99. 53 we don't want to buy these highs up here we do not want to buy up there and then once again so write this down go month week then day for entries so okay great now we see we hit a high of 161 69 and it's slowly gonna fall down then we want to wait right here to 119. and when it kisses 119 we want to get in and the great part is over time if we give it two years three years five years we definitely will clear 161.
69 again and then i want to go to one of the safest stocks of all time here's the crazy part about microsoft at this current moment it only has one percent chance of causing distress in your portfolio if you like safety stocks type yes and chat please microsoft ever since the new ceo has come in has been taking off to the upside he's done a fantastic job better than balmer right now so the direction is up on the five-year step two go to the weak chart type and chat what the entry would be and even to know under all this guess what happens people will get their entry and will not follow where they should get in you'll have one bad day and people like ah i don't know if i should buy and guess what it slides down to this point and it bounces back up and then two weeks later you come on mark on mondays and say listen rashad i know ian has said getting that 197. 38 but my point i missed it it's at 245. 13 there's no value to the upside should i buy it now tell them don't worry you get just wait another four years it'll be hard and just wait here's the thing please write this down it's very important and it's a great lesson the bottom one has shared with me there is no such thing as emotion in trading it's all math medical calculations that's it going back to my real estate developers and those in construction if this house is worth 246 if i can get it to you on sale for 197 would you buy that property if it's in a good area most people in construction are going to say yeah because guess what you can build the equity back into it here's a great lesson that investors can learn from real estate owners the deal is made based on the price that you pay you can be in a great stock and get in at the shittiest price and it won't matter it's going to take you almost double the time to reap the rewards of it let's look at teledoc real quick teledoc lo and behold ain't that something there it is everyone kept chasing so this once again is a 72 period moving average is not the best indicator it's not you know what we're using red panda but it's a good secondary method of entry here please write this down you have to obey one way to get in you can't use rsi and stochastic and macd and histograms so ian let me just let me just um jump in here real quick just for the novice that's watching out there all right this is because a lot of people was asking like when should i get in was so looking at this stock right here teledoc it's about to hit the moving average it looks like this looks like this might be a good entry point in in a few days or a couple weeks is that safe to say yes and you can set a pendant order there so first i'm going to go look at the five year month the direction has been up great we go to the week chart we can see here it's been down this will be the entry 181 17 and if you're looking to hold for a year six months two years you guys will be safe the biggest issue that i'm seeing across the board is like you guys get great entries and you're looking to get in profit in two weeks and then you sell it like i know people last year that sold tesla in april um i'm like why well i thought it was going i'm like you think elon after all the stuff that he's been through and literally ford and exxon trying to ruin his career and he made it through that you think the coronavirus is going to knock tesla apart that's the same people that's the same people that um had the cousin that worked at the pentagon that was telling them that there was going to be tanks in the streets and get all the toilet paper because remember that happens uh hey it happens and then aliens will come and we'll i mean they'll be here but they haven't walked over though so until then right be smart about where you want to get in because even with news the purpose of news is to get ratings during times like this it was a ratings bonanza for most financial institutions and most financial programs so you have to be very careful of that and i'll go over one last one let's look at p a c b and i'll tell you the story same thing let's go five your month what is the direction is the direction predominantly up or down look at this it was two dollars and two cents at the low and 2018 it's it hit a high of 53.
so we want to wait see the direction is up now go to the week i want to wait for it at 16. i don't want to buy up here and gamble definitely want to don't want to buy the high if we fall back down to 1663 that is a place in which i can fire that's it you need one indicator on your screen you need direction and that's it you're putting the boat signal out right there huh this would be an advantageous spot to probably put a few shares in because even from a mass standpoint like if we look at it let's do this and look at the five year month and we just do high to low and we do a calculation of where to get in please write this down i know you guys been seeing me put my little jay electronic esoteric tweets up right and post you guys need to go study everything that you can about fibonacci retracements and sequences it will change your life for the better and you'll have a more accurate uh representation of when to get in hold on come on do i have crazy you know what what platform we're using here this is this is the train this is take a swim right i think this one okay yeah that's td ameritrade yeah so some people yeah think of swim y'all so if you go high to low it'll literally tell you when to get in so look at this it went to this high and slipped back down to 50 percent of its value right here at 28 16. it went a little bit under the 25 and it's back to the upside for those of you that are in real estate same thing if the market is at a high what if you can get a property that was a hundred thousand dollars at 25 000.
this is that zone right here so if it ever came back that came back down to 1440 you can buy it hold it for a year and now you have all your equity on the upside the biggest mistake i see everybody make is you guys are buying too damn high and hoping even in crypto a lot of you would do a hell of a lot better and probably would eke out maybe two or three hundred more percent if you bought on the days when it slid down a hell of a lot higher so once again to wrap up step one five year month then go to the week pick one signal to get in the 72 is great for those that are using price channel your entries are even better and i want to wrap up with this a brother on a stock club call said his mom had got him into um got stocks for them and around like three bucks in 1999 and i was like damn that's amazing the stock is now 116.