in this video we're going to talk about how we can use the market close to predict or trying to predict the higher probability setups because the general consensus is that the trader should not be trading like an hour or two hour before the close and that is a good rule i recommend traders not to be trading like the two hours before the close at least because a lot of traders are just trying to get rid of these orders volatility is slowing down tremendously and traders just want to get rid of all their contracts because they
don't want to hold the market overnight and hope uh that you know mark is going to go in their favor because it may go in the opposite direction but just because the market closed that doesn't mean that we cannot use this piece of information to our advantage so here you can see the vertical line for those of you guys who are not familiar with this ninjatrader software you use something else this is the vertical line that separates the trading session this is the today's trading session this was the yesterday trading session this was the market
close you guys can see that the market close can serve for us trying to find the key level and you guys can see it came into play with this nice bounce and i normally don't talk about this and i completely forgot to mention this so i decided to make a video about how important is to pay attention to market closes because they can serve as the key levels that will you know try to give you the higher probability setups and it's not important why it works we don't care why it works like this we are
price action day traders we don't care about the fundamentals we just are technical analysis traders and we just are interested that it works so as long as it works that is fine with us and but you don't have to eyeball the market close and the key levels just you know using your eye there's actually an indicator that you can plot it is called i forgot what it's called it's like current high or low let me find this one more time there it is current day high and low and you can apply it and the close
would be actually you can see that the bar close slightly here i had a slightly higher but that you know few ticks it's not important you can see this yellow line or this or this orange-ish line this is what you know signifies the market close and if this seems a little bit too cluttered because this indicator shows you the highs of the day and the lows of the day and the market open but if you just want to use the clothes for the day because that is the most important you don't need to know what
is the high of the day this is pretty visible even though you can see it may come handy if you get the really volatile market having the high of the day may come helpful you know so you don't go long into the high of the day sometimes because that that can be a little bit tricky but you can easily easily just hide just click on the current day open high and low and you can just show low show low and show high ticket back to hide it and you can just have this piece of information
for you so we're going to go back i'm going to try to show you guys how exactly we can benefit from paying attention to the market close because i personally don't use this indicator because i want to force myself to draw it and to find it you know myself so i'm really immersed in trading but for some of you you don't really want to waste the time so you can easily use this and this is very good for beginners to know that you have your key level drawn correctly you can see how the key level
is reacting how the market close keeps you know showing you its validity and how important it is you get into this trading range and all of a sudden all these longs are very justifiable and once again we broke below this support and instantly continue working up higher there is another example previous day how the close of the day keeps reacting and we have a fail break above this prices are turning down here field break above this so you can you know you don't want to take trade is blindly please don't take it the wrong way
don't just go out there and start you know plotting the close and just trading blindly you can but it is a very important and is a very useful tool to help you to predict the high probability setups when you know you're already trying to read the price action the same thing right here we have a little bit break higher we came back we tested the close of the day instantly turned down lower came back again instantly turned down and now we have a breakout pullback pattern and here is another perfect area if you are unsure
whether you got your support drawn your key level drawn correctly this is how you can identify that you know there is some key level a lot of traders are going to be looking at the close of the day and they're going to be buying the market and once again the previous day so you can see that this indicator can become very useful the close of the day happen right here the orangish line orange line keeps showing you what the key level is going to be and how you can find the high probability setups here you
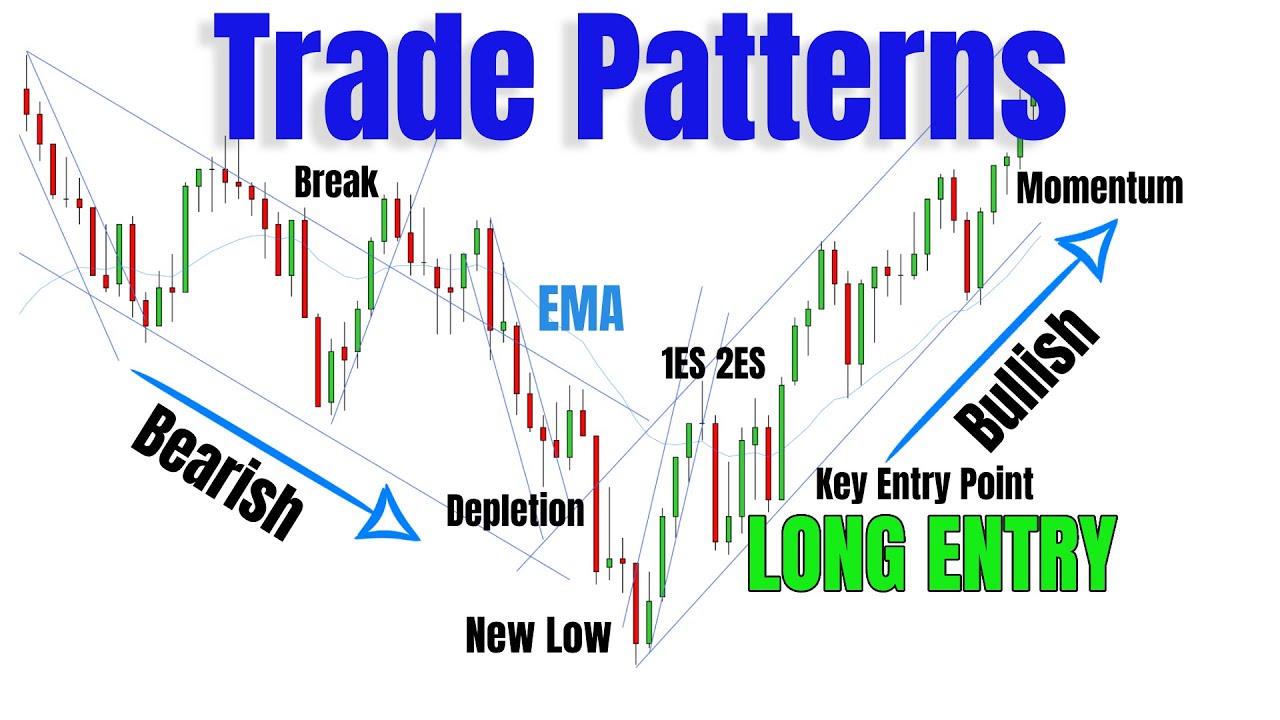
know you can combine it with the rules that we are trying to follow but this is a helpful tool to help you predict the high probability setups but the market today started with a selloff we have a break and a new law we have a pullback at the ema in another attempt to retest the new low and prices spike through the ema two-legged move up and prices are continuing working higher so according to our rules we are expecting two legged pullbacks at the trend line but this is very early pre-market open and unfortunately we just
get a first entry here but we are expecting with the break to have a new high and this is what it's called a pyramid pattern you guys can see that this is in shape of a pyramid so the first thing you would expect with the break of this channel is you would be expecting first you would be expecting some sort of support at the ema and possible re-test but here the support were nowhere to be found the price is just related up lower prices just rallied up lower and you have a first entry long at
this bar but you know we are now deep below ema and this is starting to look like a lot of sellers are jumping into the market you have a pullback and you have a second entry long right here so even though this is a two legged move second entry long and we are waiting for a new high we're deeply below in ema and we are you know this leg up excluding this leg down was fairly strong so you don't want to go long this below ema after such a strong move down it still would have
worked for scout this is why we scalp but that's not really the point we want to follow and find the highest probability setups and you have a first century short pullback second entry short right here but at the same time this is a little bit of a dilemma because trader is expecting a new high of this option working up higher but right now we are in an you know sort of consolidated market and this second entry short set up the trend line you have a lower high here but it is still way too early to
go short in my opinion because the strong move up looked very strong but you have a new height right here you have a per century long pullback second entry long right here so this is the first good trade because at this point on the bulls the buyers they're clearly abandoned their you know initial idea to continue buying and the sellers are now overwhelmingly you know you know the majority in the market and this trend line it nicely confirmed the trailer because you can find the trend line of these first two swings this is how you
normally find the trend line and the second entry long beautiful trap beautiful bearish reversal bar we confirm the trend line we're below ema and it is a failed second entry long this is we are not looking for second entry long now because we're in a downtrend we're looking for people who are trying to pick bottoms and we're going too long way too late so this was the first high probability setup according to our rules and prices continue working lower your first century short second entry short but the second entry short trigger triggered below this bearish
bar which we you know cannot go short below because we are looking to sell so we need as bearish bars as possible but this bar this was a really good trap because you have a little bit of break and a new height of the very short term trend line the ema is holding prices once again this is why we plot the ema the trend line is holding once again so once again similar pattern to here and if it's some if you know general rule in price action if it works once very similar pattern it's most
likely going to work twice so beautiful bearish reversal bar two key entry points high probability setup it is a form of a second entry even though technically it is a third entry short but you cannot really enter below this bar and you guys can see how nicely we traded up lower and here was the good trade that unfortunately wasn't takeable for us because the bar is way too big and it didn't really go much lower even though you guys can see the steam here this is not really what happened what happened live is we traded
up lower lower lower and at the very end of the bar we started trading up higher and ended up like this so you you couldn't even sneak in with the limit order you just had to let this go but important to realize how important the close of the day the previous day is and just try to use this useful indicator to help you find the key level and prices just started to rolling up higher so you have to draw the shortened trend line to keep you on the right side of the market you have a
break new high unfortunately only first trade well only first entry long and far away from ema so you cannot take this and you have a new high perfect price action we played out to the t so this uptrend is over and we should be expecting correction or possible reversal you're you're working up lower and once again your instinct what you should do first draw the shortened trend lines just draw them as much as you can to because it will really force you to follow the rules if you draw them because you can just try to
eyeball them and if you're a little bit new you it will come back to bite you because you really need to draw them so you really know what to do and take a look how you have a slightly small little over overshoot right here and it led to a break the same thing happened right here you have a look how nicely it fits prices neatly overshoot and instantly leads to the brake so these overshoots they work the rules of overshoots are you know 95 legit overshoots will most likely lead to break over trendline or even
straight up reversal so we have a break attempt to make a new low potential support forming here you're working up higher you have a little bit of break it was a little bit tempting to go long here if we had a little bit better bar because we have a double bottom right here and the way we pushed above ema but right now you're at the middle of trading range and this signal bar is too too bearish to my liking so what i liked better is once we made this double top and i only made i
only took two trades today this one and this one this was the second trade for me we have a trend line working up higher you have a break and a new height and you have a nice double top and a nice bearish bar and you're quite a bit away from ema so you're most likely going to pull back so what you can do you can once again draw it a little bit shortened trend line something like this doesn't have to be perfect oops doesn't have to be perfect you have a break new low and you
kind of stopped in the middle of trading range and you came back and you have another setup and now this is a third confirmation of this resistance so i think and once again you get a nice bearish reversal bar really the signal bars today we're on point you know while we're trying to follow the rules and you show your working upload you have an overshoot which leads to a break and this is a lower high of desire and we're coming off the lows but we already this is the and look how little nuances price action
is giving you we already because if this is a legit trading range this is your first thought when you're looking at this life like this if this is your uh this is a valid trading range you're supposed to go to this support you're supposed to go to the support support but twice we bounce fairly in the middle or the lower third so this was you know telling me that there might be some bulls in the market you know ready to buy so this lower high i don't really feel like taking this even though hindsight it
obviously looks good but once you cannot even make it to the bottom right here it looks like we may actually break this resistance and keep working up higher and it didn't happen you have a break new low and here was the potential first loser that you could have gotten trapped here is this potential bounce of the support because you're not quite close to the support but you know it is you know some trader will definitely try to take it or try to sneak in with the limit order so this would be a potential loser there's
really nothing you can do about this but once you get this filled brake lower below the resistance below the support and most breakouts will fail you want to definitely now go long because all these people that went short a little bit too early we're not close to the support yet but you know you cannot really play them this is a good signal bar but they went short they went along a little bit too early and they all were forced to you know get get out of their trades and they probably everybody re-entered right here and
the market just continued working up higher so perfect key level again held the prices your first century short pull back second entry short and we are looking for failed second entry short in this instance because we're coming off to support and we are expecting for prices to go high like this but we're below ema here and you're starting to get a little bit of a congestion right here so what is better is to draw the trend line and you pushed above the ema so buyers are confirming that they are in the market and you have
a nice reversal bar even though this is one tick bearish body at the very close of the bar we trade it up higher and this is how important it is to focus on the close of the bars not to trade when the bar is in the middle because this bar looked very bearish like we're gonna go lower and at the very end of the bar the key entry points ema and trend line held and it was the nice trade coming off the resistance and market just then continued to go into this congestion as you guys
can see this little consolidation which you find the support you find the resistance support the resistance and you fade the breakout but to wrap it up uh very easy to read the price action today but trying to follow and use trying to use this indicator it will help you find the key levels and because some traders you know when i was starting i was wondering why the prices all of a sudden bounce off of here what was the reason that prices made it all down here and suddenly bounce what was the reason well this can
help you identify the reason so i hope the video was helpful and i'm gonna see you guys in the next one take care everybody
![How To Trade Futures Contracts [Full & Live Explanation] | Trading Tutorials](https://img.youtube.com/vi/sJELO5PGY00/maxresdefault.jpg)