For all right welcome everyone how is everybody feeling doing great awesome so one more reminder to please fill out the first day survey before Friday because what we're going to do Friday is try to coales together into teams and you know start meeting each other Etc so the better you know your classmates and the better they know you the better so if you could fill it out by hopefully Wednesday or Thursday at the latest uh then it'll give us enough time to organize everyone coess and then start creating teams for the mentoring session on Friday
so on Friday is one of the formal mentoring sessions so in addition to the first day survey we're going to ask you to sort of complete um one page profile and we're going to give you more information about that but basically for now um just remember to um upload your profile all right all right so uh here We are uh with uh lecture two expression analysis so here's where we are so we are now entering the first module on genomics epig genomics single cell networks and circuitry today we're going to start with expression analysis which
is going to be fairly oh sorry I don't know how to hide the [Music] captions you guys see caption somewhere okay I think if I hit alt they Should go away okay anyway I apologize for oh no this is actually a feature it's for those who cannot hear me there's always a text we're trying to be inclusive here um okay so I apologize it's hiding part of the text uh screen um okay so the goal of module one is to basically uh first today we're going to look at expression analysis and we're going to introduce
the concept of clustering and classification more broadly in the Context of supervised and unsupervised learning and we're going to sort of include some ideas of semi-supervised learning and so on so forth we're going to first introduce a very simple algorithm known as K means and then we're going to see how this is in fact about gaussian mixture models and we're going to sort of you know get into the mood for machine learning and Bas on inference and generation versus discrimination Etc on Thursday we're going to talk about sequential data and an alignment dynamic programming here
Mark of models you know parsing um posterior decoding hmm architectures next week we're going to get into Gene regulation so we're going to talk about Regulatory genomics and epig genomics uh um how do we understand the motives of Gene regulation how do we model the signal of hiso modifications Etc then we're going to have a formal Lecture on all of the intricacies of single cell genomics today we're going to see a very simple version of that that focuses on the pure machine learning clustering classification components but then there's a lot more complexity and that we're
going to cover in a dedicated lecture that talks about both single cell genomics but also spatial transcriptomics and Next Generation techn ologies and also nonlinear embeddings that we're going to Be visualizing today but really diving into the methods of uh in a few weeks and lastly we're going to talk about graphs uh principal component analysis dimensional reduction uh you know regulatory circuitry and so on so forth so that's the goal for module one H which we're starting today for module two uh we're going to be looking at protein structure module three chemistry module 4 ehrs
Etc sounds good excited about module one so again these course Is called uh machine learning in computition biology so today is going to be our for first formal introduction to um machine learning so you know first what is machine learning machine learning is the ability to improve on a task with more training data okay a lot of people have been talking about AI since the 60s they're like oh artificial intelligence artificial intelligence is not necessarily machine learning Artificial intelligence could be oh I'm going to code in a bunch of cases and decisions that the machine
is going to make so that it looks intelligent but if that machine is not getting better with more data it's not actually machine learning is everybody with me here so that's the that's the key idea first there's a task then it's about training data and it's improving sounds good awesome so Um what is that task that task could be many many different things the two tasks that we're going to be talking about today is classification and also clustering classification is a form of supervised learning that's when we know the answer when you know the answer
then there's somebody supervising the algorithm when you don't know the answer it's unsupervised learning so basically one task could be how well can I Classify Alzheimer's patients from controls with more data if I'm getting better that's a type of learning everybody with me here another task could be regression I want to predict the uh age at which a person will get Alzheimer's regression is when I'm predicting a number not a class everybody with me here transcription could be simply taking a voice stream and doing what you see on the screen here that I couldn't Get
rid of translation could be doing it in you know buch of other languages like Greek French Spanish you name it um this could be structured output namely I could speak and it could be you know for example I could be speaking to a patient about their diagnosis and the Machine could be creating structured data from this so when we talk about structure versus unstructured data unstructured data is usually free text or an image structured data is you know two mer size Seven the image is just a bunch of pixels it's unstructured tumor size 7 it's
something that you have inferred from the image everybody with me here diabetes stage severe that's structured data unstructured data is well you're starting to show symptoms of cognitive decline you know we're a little concern Etc okay that's unstructured data free text everybody with me here now machine learning used to be very much about Structured data basically you have a bunch of variables and you're doing stuff with those variables it's about data it's about numbers I'll show you some slides where that dichotomy between structure and unstructured data is starting to get lost where you can basically
start doing clustering as we're going to see today but now on documents on text on you know patient records or patient responses okay so it could also be Anomaly detection for example you have a bunch of streams and at some point you want to raise the alarm like oh the patient has fallen down so basically Dina katabi up you know upstairs she's basically modifying Wi-Fi to be able to sort of observe people walking in their homes and there's going to be all kinds of activities at some point you're going to have to make a detection
to say okay call the cops call the medical you know team so that's anomal detection Synthesis is about taking a lot of data sets and then you know summarizing them better sort of inferring something about the field imputation means finding missing data and then filling it in and then Den noising means um finding sources of variation that are not necessarily meaningful that are non-biological that are simply uh you know perhaps Technical and so so forth everybody with me here so in all of these tasks through the course we're Going to see techniques that allow you
to get better with more data and that's going to be you know what we call machine learning and then when we say improve on a task that basically means we need to have some kind of performance measure that tells us that indeed we are improving everybody on board good questions okay so now when we talk about training data this is what what we're going to call the experience okay and Then the experience is either the Rober running around in the in the world or the AI agent monitoring you know interaction with patients on or figuring
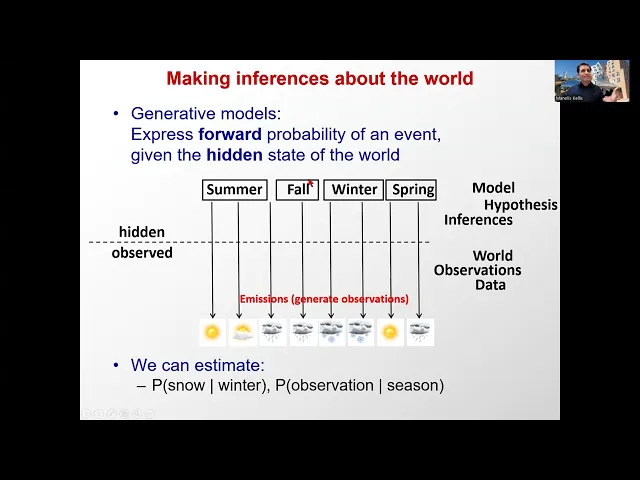
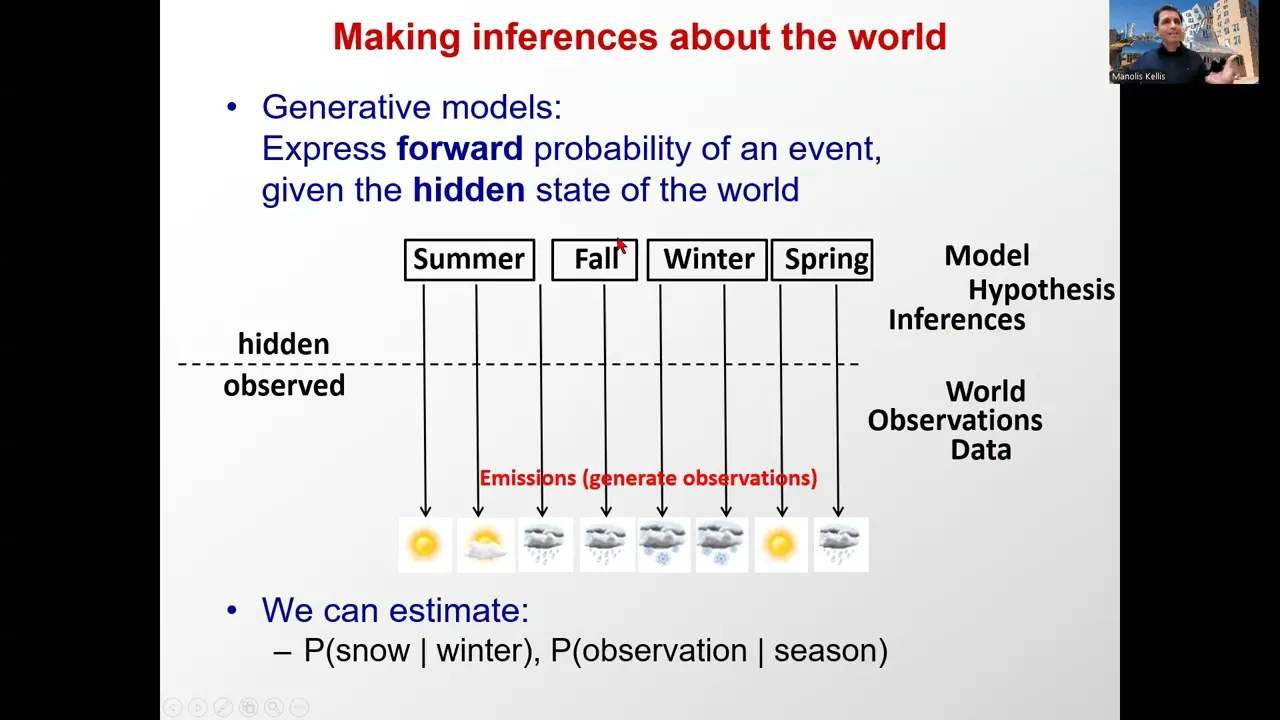
out how the doctor is responding to different circumstances getting better at this okay so that's basically our working definition of machine learning okay good now we're always talking about making inferences about the world and in competition biology there there's always going to be something that is observed And those those are going to be the expression values for example for a gene and then there's something that's going to be hidden and that's you know the patient has Alzheimer's and we're going to distinguish these two different worlds there's the world of the measurements and then there's the
world of the model and inferences is inferring something about the hidden state of a system based on observations about that System okay so what are the observations for example if you're looking outside I don't know some long hole in a wall and you can see that like there's a lot of bright light you might infer that it's you know summertime when you woke up for example or if you see you know lot of gray you might infer that there's you know rain or sorry that it's fall based on the observation of rain so basically when
you see snow outside it's unmistakable it's snow it's rain it's Cloudy it's Sun this is the observations the inferences is you know what season it is or what is the you know storm system that is going on above me and I have isolated observations but from those observations I'm inferring something about hidden state of the world why do we care about that because I can then make additional predictions I can basically say oh perhaps I shouldn't go sailing because there's a storm building up okay so that's the whole Point that you're observing parts of the
world and then you're inferring something about that world about about you know yeah something about the underlying hidden drivers of those observations so this is the world of observations of data of of you know measurements and this is the world of models of hypothesis of inferences everybody with me here so far right so very often it's going to be easy to express the forward Probability of an event that basically says when it's winter then there's you know I don't know 60% chance of snow when it's summer there's I don't know 60% chance of sun okay
so these are the forward probabilities and this is typically the way that we express systems why because they're easy to measure you're basically saying okay now it's summer I can measure a bunch of stuff and then this is what I find or I have an Alzheimer's patient I can Measure their expression patterns this is the probability of having that Gene Express highly when you have Alzheimer's inferences are going to be about reversing that directionality of the arrow it's basically saying given that I observe rain what is the chance that there's a storm system above me
okay given that I observe High expression of I don't know some lipoprotein Gene what is the probability of Alzheimer's okay so very often we're Going to be talking about the forward probabilities and that's the generative probability in other words I am in a state of the world for example I'm in the summer State and I'm sampling observations from that state based on knowledge that it summer and a series of observations I can infer the probabilities of that generative model generating samples from a distribution so for example I'm Sampling temperature readings from I don't know June
and then I get a distribution of temperature readings now now given that I have a given reading I can say where does that reading fall in that distribution and from the reading and the underlying model that I have of say the standard deviation and the mean I can say okay well the June State generated 72 degrees with you know this probability the July State generated 72 Degrees with a different probability and now I can start making inferences about is it more likely to be June or July based on the measurement that I have is everybody
with me I mean this is a terrible example because this is Boston so it doesn't actually work that way Boston basically just shuffles all the day just randomly pulls out of weather and then so so you know imagine we're in some other sort of well behaved climate zone okay everybody with me here awesome So so basically when we talk about a generative model we're basically talking about the sampling probabilities from an underlying model that is able to generate observations of the world okay and therefore we have the probability of an observation given the season or
the probability of snow given winter or in general probability of you know a measurement given a state of the world and what we're trying to do is reverse the arrows and basically make an Inference about what is the probability that the patient has Alzheimer's give even a bunch of gen Express measurements okay so basically uh we have the probability of the data given the hypothesis or the state of the world if you wish and then we're trying to infer the probability of the state of the world I.E patient Alzheimer's from the observations i e I
measured you know this expression for that Gene in that Tissue okay and that's where Bas rule comes in so basically when we talk about basian inference it sounds fancy but it's just simply we're using base rule to reverse this Arrow we have the arrow of probability of hypothesis given data and then we're flipping it around by talking about the probability of data given hypothesis hypothesis given data is like given data hypothesis so the r is pointing down data given hypothesis is um sorry that's the arrow pointing Down data given hypothesis so we have hypothesis we
generate data so that's the arrow pointing you know given hypothesis data and then this is given data hypothesis in other words you know we're trying to infer the up pointing aror okay and this is super simple it's basically simply the probability of a hypothesis given the data is the data given hypothesis times the probability of hypothesis over all the data divided by the probability of the data over all The hypothesis okay to explain that super super simply it's um you know the purple area is simply the fraction of the world that's red times the fraction
of the red ones that are also blue but the purple area is also the fraction of the world that's blue times the fraction of the blue that's also red in other words P of a given btimes P of B in other words P of B is the fraction that's blue and then P of a given B is the subset of that that's red P of B Given a given P of a is like simply P of a that's red and then this is the part of red that's also blue purple everybody with me here so
that simple to derive and then you know from that you get P of a given b equals this divided by B and that divided by a okay and that in the context of basian inference is simply that the posterior probability what does that mean why posterior because I've seen the data so post means after so after seeing the data then the prob of My hypothesis is something okay so having seen snow my probability of winter is something everybody with me and then having seen the expression of you know a gene my probability of Alzheimer's is
something and from and I can infer that from Simply what is the probity of expression of that Gene given Alzheimer's but notice I have to worry about the prior for Alzheimer's basically very very often you know people confuse those two and they're Like oh yeah well if this is higher of course this is higher and yes it's true but for hypothesis that have vastly different priors then this is absolutely not true okay in other words I you know I take a test for some rare disease the test comes back positive what's more likely that I
have the disease or that I don't have the disease it's still more likely that I don't have the disease and the reason is that the Probability of having a rare disease is like I don't know what in a million a given rare disease having some rare disease is much higher because there's tons of rare diseases but having a given rare disease that probability is extremely high that's why we don't go around testing people for everything the doctors just don't go you know testing for everything because these tests are fallible they basically wait to to have
some hypothesis that you might actually Have the disease based on some symptoms and then they do the test for that disease everybody with me here so basically that prior is extremely important when you start thinking about you know rare events for example having Alzheimer's or you know the test might come back positive but the prior might be so so small okay so that's why we need to worry in basan inference very much about not just the likelihood that's the Probability of collecting the data when the hypothesis is true in other words you know seeing something
given that I have Alzheimer's but also the prior which to the probability that the hypothesis is true before connecting the data we call it prior because it's before the data posterior after the data okay now this bottom here is the marginal this is simply the probability of collecting data under all possible hypothesis so what's P ofd P ofd is p Ofd given H1 * P of H1 plus P ofd given H2 * P of H2 plus P of D given H3 * P of H3 Etc so this is the integral over all possible hypothesis does
that change the most likely hypothesis the most likely model basically for example if I'm worried between Alzheimer schizophrenia or bipolar for a patient does that change anything no it doesn't the only thing that matters is the prior when I'm comparing between different hypotheses Because that marginal is going to be the same for all of them okay the total likelihood the the total probability is going to be the same for everybody with me here awesome any questions okay so in that context of basically you know basian inference we're going to be first introducing very simple algorithm
for clustering and then we're going to basically see that it's just a simplification of a much more General Algorithm for gaussian mixture models what are gaussian mixture models is basically when you have a mixture of multiple gaussians generating data so I'm sampling data from the green distribution I'm sampling data from the red distribution I'm sampling data from the blue distribution and then I observe a bunch of data points that's the actual process generating the data but I don't know that process in Advance what I need to do is figure out what is the number of
clusters where are the centroids of these clusters what are the spreads and distributions for each of these clusters Etc okay so unsupervised learning is going to be about without any guidance as towards green red or blue inferring what is the underlying distribution that might be generating my data and that distribution might sometimes be a mixture of Gauss everybody with me here Awesome so this is unsupervised learning and then supervised learning basically says oh I've sampled a bunch of green points I sample a bunch of red points I know the labels for those points I get
a new Point what is it okay so if I get a gray Point somewhere around here you're going to guess red if you get a gray Point somewhere around there you're going to guess green if I get a gray Point somewhere around there you're going to Be like well you know it's hard to tell everybody with me here so basically these are the two main tasks that we're going to be talking about clustering and classification so basically clustering is here classification is here and in a toy example we're going to be you know thinking about
uh expression for example in the brain or expression in the liver and the you know single dimensionality projection of this is going to give you Some perhaps separable data but projecting on for example liver there might be some overlap but if you look at both dimensions together the data become more separable everybody with me here awesome so we're going to be talking about a set of objects that are characterized by one more features the features are going to be all of the measurements we have and when we talk about 20,000 dimensional objects it's simply that
we did 20,000 measurements For example all of the genes in the human genome it's routine to just measure all 20,000 gen and then you have 20,000 features now how well can I classify every person in the room using 20,000 features super well you know I can figure out exactly who's wearing a blue shirt or a pink shirt or a you know I don't know green earrings or you name it why because I have 20,000 features super easy right so Basically we're going to be wearing a lot about do I have too many features do I
have way more features than objects if you know if I have I don't know 70 students and 20,000 features super trivial you know I I can certainly find a gene that classifies any one person in the room okay yeah have so many features visualiz ITA very very good point so I'm going to be showing you plots that are usually two-dimensional because you know we're Human and we're having trouble visualizing more than two certainly more than three dimensions so most of the time I'm going to be showing you some lower dimensional projection of these very high
dimensional data and I'm going to show you some of those and when we get to the corresponding chapter lectures probably lecture seven we're going to be talking a lot more about how those are made now pca's principal component analysis basically says what Are the major components of variation if you look at here the major component of variation is this one and the next one is that one now I went and measured expression of let's say this Gene in brain and that Gene in liver is that the right dimensionality or is the right dimensionality some underlying
process for example lipid metabolism over expression in that person that then gets reflected both in the expression in the Brain and in the expression of in the liver so maybe that principal component maybe that combination of features is actually where the true biology lies and then what I'm seeing is different projections which are only capturing partial information about the true underlying biology is everybody with me here so sometimes these axis of variation are going to be interpretable and it's going To be oh simply the combination of those two features other times the global axis of
variation will be completely meaningless because we've taken 20,000 Dimensions we compress them down to two but then the local variation will still be very meaningful at least biologically for example as you're moving in One Direction you might see that oh those cells are more Alzheimer's and those cells are more more healthy that Dimension absolutely means Something but it is reflected in perhaps 3,000 measurements at the same time because all of these genes are slowly increasing their expression along with Alzheimer's but the true biological variable is Alzheimer's does that make sense so basically we're going to
be talking about both linear and nonlinear dimensionality reduction and the linear one is when I when I do PCA and the nonlinear is for example t and umap and other sort of you know Projections yeah so if you do learning method like clustering and you see really strong clusters can you turn that into like a classifier or can you start adding your own labels to these things validation so so if I see this data and I say oh well that's class one that's class two that's class three and then I say okay how well can
I classify those three classes I'm going to be doing really great because I Define the classes based on my Clustering and if I say oh this point was labeled Alzheimer's but it's probably a mistake let me relabel it control I'm going to do a little data clean up my classification is amazing so you have to be very cautious about that in the sense that uh statistically if you basically first look at the data there's whole things of the whole slew of things that you can no longer do because you've you know dirtied your mind by
looking at the data you suddenly Are soiled because you can't think unbiased anymore so that's going to be one challenge however you could say well I'm going to do PCA and then you know find the principal components of the data that's an unbiased operation you don't need to like it won't change based on what you see but the M say and I found 10% components best explained that the difference between Alzheimer's and non-alzheimer's that's biased If instead you say I find that 10 components Explain the most relative variation you know and then there's diminishing returns
after that and therefore I'm going to stop after 10 components before looking at the Alzheimer's classification then you're good so basically you have to constantly be thinking how much did I bias the analysis because I peaked at the result beforehand so however there's a whole class of semi-supervised learning where you basically have some points that are Labeled some points that are not labeled and therefore instead of having all points that are green or red here and then a gray Point shows up you have a ton of gray points and maybe you know three red labels
and two green labels ET so that basically means that you have to somehow use the structure of the data to understand the overall patterns of variation and then after that you can kind of layer in the classification component and now you can kind of use Both the structure and that there's also uh self-supervised learning what is self-supervised learning self- certifed learning is a lot what we see with AI right now I talked about in the first lecture where we basically have you know billions of images and no time to annotate them all so I'm going
to hide a patch of the image and I'm GNA ask hey what's hiding in this patch I'm going to turn the image black and white and say hey what Was the color I have the answer because it came with color but now the machine doesn't have the answer because I only gave it the BL the black and white so for the machine to figure out how to color it it better understand what our world looks like and therefore build underlying models of the world but now I have as much labeled data as I want for
free because I just remove the color and I'm asking for the color again this is known as a pretext task I don't care About that task I have the color I hit it so I don't care for the answer you know you don't have to be get really good at it but getting really good at it means that in doing so you're learning about the state of the world so semi-supervised learning and self-supervised learning kind of blur the boundaries between supervised and unsupervised these are fantastic questions any other questions okay great so classification you have
Labels and you want some kind of rule that will accurately assign labels to new points existing points so easy new points is where you know the rubber hits the road and the sub problem very often is feature selection namely maybe there's a bunch of extraneous features maybe those two are perfectly correlated with each other maybe I don't need both maybe the true biology is here maybe I have to sort of construct you know Some inferred features from the measurements that I have those infert features could be some kind of linear or nonlinear combination of those
features for example this plus that or this times that or this Square divided by that Cube or you name it okay so this is you know sort of feature augmentation and that allows you to sometimes find Dimensions through these combinations of Your existing measurements where the data becomes linearly separable and that's what support Vector machines are all about it's like that's what the kernel construction stuff comes in it's basically a fancy form of not feature selection but feature inference feature construction okay and when I talked about representation learning in the first lecture or I should
say call call it lecture zero basically in the intro lecture I talked About representation learning representation learning is really about feature inference so you have a bunch of pixels but you're inferring meaningful features and those meaningful features are closer to the underlying biology to the causality to the mechanisms than the raw measurements okay so very often we're going to Care to infer the true dimensionality of the data the true axis of variation and maybe instead of having brain expression liver expression of X Or YZ Gene maybe the act of variation would be male female Alzheimer's
control young old you know African-American you know european- American and so so forth is everybody with me here so these might be the True Dimensions of variation of your data and if you can understand enough of the structure of the data to understand these latent dimensions of variation unsupervised and then ask hey what did They mean and then you're like oh well this correlated with age or with sex Etc then you're doing really great there's an alternative which is you can start with age and then say okay what correlates with h let me now take
that component out okay what's correlating with sex biological sex let me take that component out what's correlating with you know disease St let me take that component out you can progressively peel components of Variation and then you can do an unsupervised clustering of the rest or you name it everybody with me here cool other question okay um so again classification has some labels there's some kind of feature selection and the metric you can actually have a metric because you know what's green and what's red you can hide the label of this point present it to
the model as gray and say how well did I reconstruct it what is my false positive Was my false negative rate Etc clustering has no labels and it's very hard to sort of have a metric for how well are you clustering so the goal is to group points into some clusters based on how near or proximal they are to each other and to identify some kind of structure in my data and the metric is usually I'm going to bring in some other measurement that I haven't shown to the algorithm and I'm going to ask it
How well are you capturing that measurement of course if that measurement is highly correlated with one of the measurements that I already have that's a problem basically usually I want to have some kind of independent validation that's not just like maybe um yeah it could be for example an Imaging data set or it could be a performance in a different test or something that was not used in the deciding of what's Alzheimer's okay awesome so again I'm You know this is the first lecture technically so so I I I I I think it's important to
sort of distinguish all of these different types of things so so basically we've talked about AI we've talked about machine learning we've talked about deep learning and I can't know try to introduce them at the beginning so basically Ai and comass is many many things including systems that pretend to be smart where everything's hardcoded for example a knowledge based Or a rule-based you know robot that's still artificial intelligence okay within that is machine learning and that's basically what I'm getting better at uh at a task with more data okay so for example AI could be
simply you know I have some input I have some hand design program that de decides what to do based on that input and then I have an output the learning part are the gray boxes here okay with classical machine learning you basically have design by Hand some features these are the measurements that you're making and then you're inferring the parameters with which you weigh these features and that's the learning part the more data you have the better that waiting will be everybody with me here conversely if I uh not not conversely further uh within machine
learning there's representation learning and that's basically when I don't design the features by hand to start with I Don't say oh expression of this Gene in brain is you know a good feature for Alzheimer's instead I say ah go figure out the features okay and then from the go figure out the features it could basically do some kind of principal component analysis or it could do all kinds of other things to infer what are good features to even use in inferring the output and I can learn the features just based on the input I could
Basically say great what are components of variation or I could learn the features that give me a better classification for the output okay so I could basically say oh let me infer some features map the weight of those features and then infer the output and now back propagate how to improve the features and then try again update the weights I get a slightly better Classification I go back and I update the features again okay so the concept of learning not just the weights but the features themselves that's what representation learning is about is everybody with
me here yeah um what would that look like for something like expression R would would it be hand designed features if you give it like the actual expr values or in a representation model what would you have to give it instead Yeah that that's exactly right so basically the vanila sort of representation learning approach would be okay let me now infer like some linear combination of features or some nonlinear combination of features and then I can see every pair of features that could be a representation the difference with deep learning is that these features are
not built at just one level they're Built on each other so basically I'm learning some simple features from these features I then learned more complex features from the more complex features I then learned even more complex features basically having multiple layers of combinations of gene expression values is you know where this would be okay and that's why we call it deep because you're learning multiple layers of more and more abstract features Everybody with me here awesome basically that's sort of the hierarchy that we're going to see and then within deep learning there's generative AI Etc
so basically there's uh you know more classes that are being constructed who feels that they've learned stuff yes awesome all right let's Dive Right In so with classical AI the way that machines were kind of learning how to play chess was that the human would program all of the rules of Chess it would hand you know the human would handcraft a scoring function for every position and you know the machine would then search the moves that it can make for the white to maximize the score then for the black to minimize the score then for
the white to maximize the score again for the black to minimize the score and that's sort of a Minimax algorithm that basically says at every step I will choose the thing that maximizes my score and my opponent will Choose the thing that minimizes my score and I will choose the thing that maximizes my score and so on so forth okay and this is Gary Kasparov so I met him in Croatia he's a really awesome guy our kids the same age and we also play chess I will not tell you who on this is an exercise
the um so so basically the machine basically infers from the rules that the human made and perhaps from some scoring function that the human made I don't Know how many of you guys made a you know chess game in your youth but you know there was a time that we would basically say oh what is this the best scoring function for where the Knight is and you know based on the night being in the middle you know it has more controlling squares and therefore it has a higher value and I can use that to score
every position and humans would basically come up with awesome scoring functions and then the machines would Basically just run through these really really fast run the Minimax algorithm and then that's where Kasparov lost to a machine back in 99 or something like that and then the the world was shaken you know at the time we thought that humans would be unbeatable at this kind of thing and eventually you know machines got better and better and better you know anyway I'm not going to get into what's happening now but you know needless to say a lot
A lot has Changed so this was the classical way that humans would play chess and then based on this we had this concept of you know things that are easy for humans and things that are easy for machines okay or hard for machines and the things that were hard for humans were things like chess or you know math integration or remembering like I don't know 3,000 things or reasoning and you know planning and logic Etc but those it turns out were kind of easy for machines You could basically start you know planning out a path
by just simply you know doing depth research or breath resarch and then sort of trying every possibility you could you know play chess by simply testing every possible option and then there was this dichotomy of things that were basically very easy for humans that you know we didn't think of as intelligent and then you know the intelligent part was things like playing Chess okay but it turns out that the the the classical AI stuff was basically I'm I'm sorry to be so provocative but things that humans had to get trained at in other words math
integration nobody's born knowing how to do integration you know we we kind of go through school to figure out how to do this nobody's born knowing how to be a good doctor oh you learn how to follow flowcharts and that what makes you an awesome doctor you basically look at That evidence oh you forgot that one you're not as good of a doctor okay and guess what that's not what humans are best at that's what machines are best at so we trained humans to be machine like in a bunch of tasks and those were the
hard tasks at the time because it took us many years of education to learn how to do something properly but machines super easy that's what they do best where deep learning is going and where the modern movement of generative AI is Going is kind of that the opposite the stuff that humans are kind of born knowing how to do like you know you're born knowing how to drive a car well maybe not but anyway you're born how to recognize to learn how to recognize images babies can recognize IM is even before their retina is like
fully functional and their visual cortex is fully formed like you can recognize patterns just you know from just being a baby it doesn't take any special skills Can recognize people that's that's what we do best and that turned out to be super super hard for the machine but it's kind of embarrassing because the machines are now getting super super good at these things and maybe general intelligence lies somewhere in that direction my guess is that it lies somewhere in both directions basically right now the movement is very very much towards you know sort of large
language models that You know have enough parameters to understand the world but I think there might be some room for learning the laws of physics and you know having some kind of equation and some kind of structured modeling of knowledge and knowledge graphs and stuff like that maybe but again we'll find out we don't know where AGI is my guess is that it's already here and you know we're just not called for that because we're protecting our own I don't know Vanity or confidence anyway so so but again if AGI is already here then we
don't have to worry about it hasn't killed us all right so so you know there's a good way of seeing everybody with me here awesome so uh again sorry for taking the time to sort of explain these Concepts but they're going to be hopefully helpful for thinking and conceptualizing about this so when we talk about deep learning we basically mean that there's layers of Abstraction building on features on features on features and that's basically what's being done inside our deep learning apparatus that we call our brain okay so basically we have layers in our cortex
and then individual neurons are sort of sensing perhaps pixels and then they're sending signals and now you can arrange neurons in a pattern that will recognize you know low activation High activation low activation you can hardcode that in your Brain and then when you see an edge the neuron that recognize that pattern will fire and that's one layer of abstraction and now that you have an edge recognizer you can kind of build you know a recognizer of uh triangles and so on so forth based on those features so basically the concept that you can learn
from the building blocks more and more abstract items is what you know is at the foundation of deep learning we'll talk a lot more about that when we get To image analysis and we've basically expanded this Hardware uh like our actual cognitive Hardware dramatically since you know Divergence from the chimp a few few million years ago so basically humans have expanded this neocortex which was already insanely enlarged you know from mammals to primate and um you know has just gotten wild and again if you look at most humans you kind of think of the eyes
as the top of the face but if you've taken a drawing class you Realize that the eyes are actually the middle of your face and we just have some hair here but when you see an extraordinarly smart human without hair you kind of realize that the eyes are kind of in the middle okay but all all of you have the same thing just you have hair um all right so so basically that architecture was basically utilized in the visual cortex but guess what we studyed the motor cortex nearly identical architecture you studi the you Know
all of these sensory cortices are nearly identical in architecture receive signal abstract it abstract abstract it and then you know boom you get something out of that and then the Last Frontier is the prefrontal cortex basically where all of your cognition and thinking happens and guess what that's the same architecture so basically this concept of abstractions and reasoning you know might be inherent to sort of how humans think can function and this is what I Was describing in you know the the introductory lecture when I was talking about this representation learning okay maybe all of
these layers are just really good at abstraction at sort of learning more and more complex inferences about the world so we have the world of data we have the label the Y the prediction and then this is where the magic happens this is where the Latent uh spaces are okay so again what we just saw will apply everywhere okay so yes we are in the expression analysis lecture but it's also the intro to machine learning intro to sort of all of these you know wealth of both techniques but also ways of thinking about the world
everybody with me here awesome all right so now let's basically see how we can use machine learning for gene expression analysis how can we learn how can we get better At a task with more data first we're going to look at um you know gene expression analysis in general then we're going to look at this gausian mixture model of you know uh I think it's a very nice Foundation to start thinking about machine learning and inference and then we're going to sort of look at actually an easier version of K cluing but let me uh
Dive Right so first of all what is gene expression analysis you basically start With a tissue you then infer where for example the nuclei are and that's usually much easier to capture in a tissue as complex as brain you extract nuclei you package up nuclei in individual bubbles that have the same barcode for all of the cells in that bubble and therefore all of the RNA molecules inside that one cell in that one bubble have the exact same barcode you then sequence all of the reads that come out And what you get with what would
get back is barcodes for individual cells that I'm going to now call the green cell of course there's no caller it's just barcode GD dtdc ABC or something or AGC definitely not b um and from that you will say oh all of these reads came from the same cell is everybody with me here and therefore in the end you're going to have all of the measurements that you saw an RNA molecule from Gene 2 in the same cell I'm just going to Number them arbitrarily cell one cell two cell three and you're going to get
an expression Matrix which is simply the number of times I saw an RNA molecule mapping to that region of the genome that corresponds to each gene with a barcode corresponding to cell one okay it used to be that it was expensive to sequence and every letter that you read from the DNA cost $1 and to sequence the three billion letters of our DNA it took three Billion right now it takes about $300 so we're talking about seven orders of magnitude from a billion to 100 okay just and therefore instead of just hybridizing a read to
a region with a probe we just re sequence whatever it's re sequence okay and that's basically how we do quantitative expression analysis we're basically just simply tagging with DNA bar codes individual cells and then Measuring and you get back a matrix everybody with me here and then you basically have a number of uh like you have 20,000 human genes maybe I don't know four million cells and you get a matrix like that and from that you can do your principal component analysis Etc and you can find clusters and classification ET everybody with me here so
basically you dissociate single cells you do sequencing based counting of RNA read for every Gene then You have the counts for every cell you have multiple samples and cells from every different condition so you might have a bunch of Alzheimer's patients and all of these reads you're going to call as Alzheimer's reads and you can think of this as a flat model that simply says oh I get like that many cells from Alzheimer's patients or as a hierarchical model first I sample a patient then I sample cells from that patient and so so forth So
that's sort of the hierarchical approach of of seeing it and then you can basically do clustering or classification everybody with me here awesome so very simply we're going to be measuring 20,000 genes in hundreds of conditions in thousands of cells and we're going to be ending up with every condition where I did a measurement I get the expression of a bunch of genes sometimes partitioned by cell and then for the next condition the next Condition the next condition this could be I don't know 400 individuals and that basically gives me an expression profile for a
given Gene across these conditions so I can start asking questions about the experiment Dimension or about the gene Dimension everybody with me here so we can ask how similar are two genes in their expression patterns and how similar are two experiments in their expression patterns everybody can here Awesome so now what's clustering classification clustering is basically saying okay I have these genes by conditions Matrix and I'm just going to find common patterns I'm going to find genes that behave similarly across conditions and conditions that behave similarly across genes everybody can hear this is just about
finding common structure the goal of cluster is to group similar items that likely came from the same category And in doing so reveal hidden structure now classification basically says okay well we have some B cells and some you know t- cells and some activated B cells and some proliferation uh you know uh cells and then from that we're we're you know we're going to now classify genes that are related to these conditions or conditions that are related to these genes and so so forth so basically it's when you have known classes and then you're Finding
features that predict those classes so the goal is to First extract features from the the data that best assign new elements to one or more well defined classes sounds good all right so um I'm I'm showing you this like that but in fact it's more like this okay right now we're thinking about oh we have two Dimensions like measurement in brain measurement in liver uh and that's a toy example there's like 22 cells here And two measurements each in practice this is what real world data looks like this is 2.4 million cells across 430 donors
every one of which has a 20,000 dimensional Vector okay and going back to your comment yes you can represent this into Dimensions using some kind of nonlinear dimensionality reduction technique which we're going to talk about in later lectures everybody with me here so basically remember that it's much more complicated but in this Lecture we're going to think about the simple scenario to introduce the machine learning components and the inference little by little okay so basically these clusters discover one component of the variation which is the cell type but now within that cell type the cells
here come from let's say Alzheimer's and the cells here come from control or the cells here come from males and the cells here come from female donors and so so forth Okay and again single cell analysis a lot more complex we're going to talk about that in lecture six you know you have to deal with batch effects for example most of the time when you do an experiment you basically see oh this is the cells from the first experiment and this s from the second experiment and they have nothing to do with each other so
basically what you need to do is find some anchors that are are sort of the best you know neighbors for example Between these celles and kind of like pull them together and then you know change the dimensionality to match those Etc so that's the first thing you got to remove unwanted variation you got to understand that there's thousands of genes measured by sell there's like Dropout events there's a lot of noise and sparsity because the samples are tiny you're measuring one cell at a time there's herity there's all kinds of scalability issues you got to
work with Alignment integration across platforms and different experim exp Al designs sometimes the little bubble will catch two cells instead of one cell and that's a problem we call these doublets sometimes you have multiplets and you have to worry about dimensionality reduction which can be linear sparse nonlinear Etc everybody with me here so all of that will be in lecture six but for now let's worry about beautiful data two Dimensions let's clut them okay so How do you discover these clusters how do you find you know that these are micral cells and these are progenitor
cells and so so the way you're going to do that is by um assuming that there's some fixed number of clusters and then partition the points into those clusters and how you can initialize randomly K cluster centers and then you can repeatedly assign points to a center and then move the Centers to the center of gravity of their points and you can stop when there's no more reassignments let's see what that looks like so I've sampled some points without knowing which distribution generated each of them I randomly throw three centers yeah this one you know
I may have cheated I put it very close to those points but this one is sort of exactly halfway between those clusters so what's going to happen let's run the algorithm first I'm going to Assign every data point to the nearest cluster then I'm going to color the points based on that nearest cluster and then I'm going to recalculate the cluster centers I'm going to move the Clusters center of gravity of the points that are assigned to those clusters notice What's Happening Here the Green Point the green centroid gets moved somewhere to that you know
average but because I had the purple Point here capturing some of those you know we'll See what happens at the next iteration so here I've now captured those and those and now I'm going to move the Green Point the the the green centroid closer to the points that are near it and the points that are near it now the purple cluster that came down has now captured all of the points previously assigned to the green and now the green gets moved to the center of the corresponding points everybody with me so what did I do
here I basically just Cooked up a recipe this is like AI I cooked up a recipe I don't tell if it's good I don't tell if it's bad I just simply you know run an algorithm it's basically just a recipe like the way you make waffles or Crepes this is just a recipe now how do we know if it's any good well we need to evaluate it how do we know how well it captures the thing that we were trying to capture we can have some kind of approximation bound that basically says here's how good
or How close you get to the op okay but let's now break it down a little bit and and then we're going to show that it's in fact gaussian mixture model model okay so so in one step we basically said we're going to assign points to the nearest Center and in the other one we updated the center to match the points okay and guess what this is a form of learning because I'm actually getting progressively better at capturing this unknown structure of the Data it's not supervised learning but it is a form of learning okay
what are we trying to do what is this algorithm actually doing what it's actually doing is that by by reassigning the point to the nearest center it's actually minimizing the distance between all of the points that are assigned and the centroids to which they're assigned and when I'm updating the center to the mean I'm basically you know again re inferring something About my representation of the world so first of all I'm saying which clusters generate the points and then I'm saying what is the most likely clusters and if either of them was known the other
one would be trivial but because neither of them is known we're kind of starting with a random guess of the Clusters of the centroids and then we're iterating to improve it and that's going to be a common technique for many many Algorithms that we see where you basically start with a randomization and then you progressively make it better now you can think of K means as basically trying to create clusters that minimize a cost Criterion associated with the size of the cluster you basically say that the cost of in inferring some structure to all of
these points is simply the the sum over all centroids or clusters of the sum over all points in every cluster of the total Distance does that make sense so by making the Clusters compact I can basically make that cost smaller what's a great way to make you know this cluster super compact I have a th points choose a th clusters right boom every Point gets a cluster zero cost function so you know we basically can't have that one single measurement as the cost function we also have to think about generalization you have to think about
the compactness of The representation and that's a lot of what we call regularization regularization basically means that I'm going to have a penalty associated with a number of parameters that I'm using everybody with me here great but basically for a fixed number of clusters then this is a fine you know algorithm that basically minimizes the of these clusters sounds good and it turns out that the C algorithm is basically minimizing this geometric view Of the structure inference of the points which is we're you know trying to minimize that total uh sum of distances and what
is that sum of distances basically the way to do that is simply the centroid uh of the points is what minimize okay so you can basically think of the um of the algorithm as basically doing that now assigning these points discretely and unambiguously to only one Cluster at a time has a problem which is that some points can truly be almost halfway between two centers and therefore we might want to sort of think about partial weights and that's going to be a modification of the Cs algorithm that's like fuzzy K means and what is fuzzy
K means fuzzy means basically says we're going to basically assign points partially to each of the Clusters instead of saying this point is 100% blue you say that this point is 98% blue And maybe 1% purple and you know 0.7% Green everybody with me here and this point you know for this point it probably doesn't make a big difference but for this point it does it's like 40% this and 30% that and 20% this or something like that okay 30 or something anyway so the goal here is instead of saying that there's probability one of
being generated by this cluster and this cluster only we say that now it's a Probability that really depends on that distribution of the point so and again that's where we're getting to the gaussian mixture model every single one of the centroids is a gaussian generating points from this distribution randomly sampling according to that Gauss distribution and now when you see these points you say okay which gussan is more likely to have generated at this point okay so now let's think about the the machine learning Formulation of this nice little recipe that we saw you basically
have the generative model again I have a model of the world and I'm sampling points from that model as we saw earlier so I have a model of the world that's you know there's some red points and there's some Blue Points so I flip a die and I Choose Or flip a coin and I choose whether I'm going to sample from the r distribution and when I do I basically sample from a Gaan and therefore the points are going to be distributed from the center out in an exponential decay okay and this is the gaussian
distribution it's basically one over 2 pi and then that that the exponent and that's the distance and so so forth so that's the decay of the gaussian function and the gaussian function is not just something that you know humans dreamed up with to make high school students Suffer it's it's real it's there it's it's there in the real world so basically when you create a machine where every ball will randomly fall on a stick and then randomly go right or left with equal probability you end up with basically a g distribution and it's spooky how
present and omnipresent it is okay so then you can think about these centers of mass or the center of gravity and you can think about the spread of that distribution and now the question Is if I have gions generating points with means you know uh here here and here and here then what is the most likely G to have generated a point here well the red one what about here well the orange one so the rightmost point comes from the orange distribution what about the leftmost point also the orange distribution that's a little weird and
that's because it has the longest spread And therefore the fact that the green one is slightly to the left of it matters initially but eventually stops matter yeah so in the Ali what's like how do we know one point on the bottom left of the gra versus one point the top right of that gra is not from the same distribution K would assume they're different distribs right exactly exactly so basically now we're getting closer to fuzzy K means and to expectation maximization so basically The original K means the geometric approach only deals with one unit
variance it doesn't understand about different variances and it doesn't understand about priors so basically here in the full model we'll have different priors for blue versus green versus red versus orange and different spreads whereas K means only understands about the means but not the standard deviations or the frequeny okay so now we can go back and revisit this cute Little recipe and basically realize that it's actually an optimal algorithm for finding the interpretation of the world that has maximum a posterior probability of generating the points that we observed is everybody with me here so what
we're going to do is reinterpret these two steps of the uh K means algorithm in an expectation maximization way what is expectation maximization it's a way to iteratively Refine the latent variable for example the centers of the point and the uh you know rest of the distribution in an itative fashion instead of saying I infer one thing about my data it's an iterative way to estimate an underlying posterior distribution that you don't directly have access to okay so the Eep assumes that the centers are known and it estimates the memberships the Mstep assumes that the
assignments are known and recomputes the centroids okay and iterating between them you basically have a set of label points oh that's great super easy I can find the centers if I have no centers oh super easy I can assign the points but the iteration between them is what basically allows me to get learning machine learning out of this process okay and then the solution to the model of the world that Max maximizes the total probability of Generating this points is no other than the answer of the cin algorithm basically what you're trying to do is
solve two problems at once the first is infer which points were generated by which clusters and the second one is what are the Clusters that generated the points and you can infer both if you knew any one of them the the other would be easy but if you don't know either then you start anywhere and you iterate okay so then the maximization of this Probability of generating the points given that gussan again it's a generative model we have the forward probability of inferring the X's which I'm sampling from the gaussian centered at that point that
total probability the arcmax of the log probability is basically the same as that probability is this expression here and then this becomes uh you know irrelevant because it doesn't vary with X but this here is nothing but the solution to the centroid problem that we had heard okay yeah yeah I'm just a little bit confused because the method model also infer variance of the corre correct only that's exactly right so basically in the case of the variance being the same it's identical if the variance changes now then you know then we need a a more
sophisticated version of that algorithm okay so basically when I'm Computing that probability that probability here is just simply based on you know this uniformly decaying function but now if you have a parameter associated with the spread of that decay that becomes a standard deviation and that you scale in that exponent and that basically becomes a scaling factor that you're going to need to incorporate in your um in your algorithm okay and then again the the same thing happens with this maximization of either Maximizing the likelihoods of the cluster means and maximize the likelihood of a
point being generated by that mean and you can basically think again side by side about the K means algorithm the fuzzy K means algorithm and what is the Eep and the M step and you know I'll let you you know walk through that on your own but the initial King's solution was a uniform prior where every CL is the same size a unit distance function instead of Having some variable standard deviation for your point a symmetric distribution between the different dimensions of your data where the every Dimension was independent the X and the Y were
independent where here we can actually talk about a covariance matrix of sort of some you know reshaping of the space and then with K me we simply picked the max where we found the one cluster that was closest and we chose that one and with fuzzy means we looked at the full Density and with expectation maximization we can look at the full density and then estimate the membership of the points all probabilistically according to each cluster or we could even sample from that posterior distribution using Gib sampling that we're going to see again in a
lecture or two okay so again if you have an original data set it was generated by a big green cluster that was you know shaped this way and then two little red And blue clusters the cing solution will spread them you know exactly that way will sort of separate the points that way will partition as should say whereas the fuli model will be able to sort of recognize the standard deviation of the blue is actually larger than the standard deviation of the green and so so forth and therefore that point here even though it's technically
closer here will be a sign there okay excited good so that's basically uh Expectation maximization and uh that sort of assumes that we have chosen a number of clusters and then we're partitioning into those K clusters okay but the problem is that selecting K can be hard you can always make clusters more compact by increasing K and if K is the number of data then you know of course it's you know perfect but meaningless completely um and with hierarchical clustering you can you can kind of side step this so basically Hierarchical clustering is an gomera
clustering that basically says can I build a nest set of clusters which are organized as a hierarchy so when I have a set of points I don't need to choose K in advance I just find the two closest points and I merge those I find then you know then they become a cluster then I find the next closer there and I merge the next two closest clusters and I continue to basically generate an a tree a hierarchy that basically tells me the Order in which they were clustered okay and then if I want to uh
make a cut I can just choose how many clusters do I want and I can just make a cut at that height and then it gives me the four clusters everybody here good so this is upgma that we're going to see again in philogyny later in the semester which is unweighted pair group method with arithmetic mean and when you do that you assume that every point is a cluster initially And when you merge two points together you merge the corresponding clusters but the problem is that the closer to closer distance is itself matter of debate
how do you calculate the distance between these cluster in that cluster you could take the distance of the closest two points you could take the distance of the furthest two points and if you choose this one versus that one this one will basically allow you to merge Clusters like a snake you know connect them together whereas this one will sort of tend to make clusters that are very compact because it's it wants to make sure that the two furthest points points are no further than any other cluster that I could merge everybody with me here
or you could say let me take all of the pairwise distances and just average them and then that will be the cluster to Cluster distance or I could simply take the center of gravity and the Center of gravity and you know look at the distance between the centroids of those this one is a k squ algorithm this is an N squ algorithm this is basically checking all n squ distances this is only checking all K squ distances where case the number of clusters at that point but of course recomputing those distances basically means that I
need to now that I've merged these clusters I need to recompute the center of crow okay so anyway basically the cluster Distance affects both the results and the run time and again the pointto point similarity can be either uclean distance which is what you know most of us intuitively think of or it could be Manhattan distance or it could be Pearson correlation or sper Spellman correlation and so so forth okay and then to evaluate the clustering results you can basically look at some other independent measurement and say How likely is it to have sampled I
don't Know um K Alzheimer's patients in my group randomly uh by chance okay so I want to make a small parenthesis here because we are in 2024 and people think of clustering of points with numbers but you can actually cluster things Beyond just points Okay so here's of course clustering of numbers so basically this is you know 2.4 million cells clustered according to their expression patterns um this is now patients clustered together but you can actually Start clustering text how do you cluster text you can cluster text by uh and I don't know if that
link will work but let's find out yooo so um this is basically clustering of uh responses to a survey so basically this person says oh I have a relationship that did not go as expected as a result it brought me down personally as a person I'm sorry if this is very depressing uh so uh as soon as I said depressing all you guys are laugh laughing okay um so so basically Um back in 1980 a bunch of old men sat together in a room and said okay we're going to Define psychiatric conditions according to this
list and now every one of us in 2024 has to fit one of those lists that they decided like 30 40 years ago okay instead you could say okay let me just look at the responses of every person and then based on that I can infer a hierarchy of you know psychiatric uh you know conditions basically all of these are uh parental Health concerns okay this is in Greece so it's it's a little biased um so uh you know personal concern summary Etc so basically relationship breakups so all of these things it happens to you
that's the thing like you suddenly realize that it's not just me I'm not the only weird person who doesn't fit one of those like 1980 categories like all of us are struggling with some of those things so um you can basically now you know um study not just um numbers but also text You can take the description of every single human protein just as free text and then you could cluster those descriptions together and hopefully that space will come up and now you can basically navigate 20,000 genes not based on their expression but based on
the description of their functions and if I search here for lipids for example if I can spell I can basically find that there are you know genes associated with Lipids in a bunch of different categories maybe in cargo receptors or in biosynthesis and molecular function Etc you could also do all kinds of fun things you could like you know select those points together and say you know uh what are uh some let me make this a little bigger uh diseases that these genes are involved in right and then it can basically you know tell you
answers About that anyway why am i showing you this because this is so much fun a bunch of undergrads like mostly freshman and sophomores in my group built this and it allows you to now start thinking of text as uh clusters so this is another fun space every Lex fredman uh click clip is now categorized and you can see here uh unsurprisingly when you zoom into the center that's where the meaning of life is and uh you know next to meaning of life you basically have philosophical Discussions Etc why am i showing you this because
I want you guys to think broadly Beyond just numbers everybody's thinking of oh you know I'm going to do a final project by measuring expression here and here and there why don't you just do a co-embedding of you know all of the expression patterns of you know uh a bunch of genes with the lat and embedding representation of the corresponding things okay so that's the Sort of small parenthesis and uh all of this to say that what we just saw is a much harder version of naive Bas classification why because with naive Bas you have
classes that you already know about you have class one and class two and therefore you can ass assign probability distributions to the points from that class so before I was doing everything from scratch I didn't know what point belonged where and I didn't know what the cluster would look Like whereas here you actually know what points belong where and therefore it's actually super trivial to infer the center of mass of that distribution it's just the average of those points the the the spread it's just the standard devation and you can now use that to start
inferring what is the probability of a given class given the data and how much more likely is it that something belongs in class one versus class two given the data and to and of course as We mentioned earlier the denominator is the same so what do you want to know you want to know the probity of class one given the data probity pass to given the data and using Bas rule this is the backward facing Arrow this is the forward facing Arrow I Know How likely it is to generate a particular expression value given the
class and I know the prior for that class and the denominator is the same so I can basically build a basian Classifier between different classes simply based on the generation probability times the prior a lot of people think of vision statistics oh you just have prior for everything no the prior just simply comes from this invert ing the direction of the arrows part and the prior just naturally sort of Falls in there and therefore we can think of a discriminant function for a classification based on whenever that probability is greater Than one or whenever the
log probability is greater than two then we classify according to one class or another class okay and therefore we can think about estimating these distributions based on the number of points that are sitting in different parts you could assume a parameterized model which basically means I have a mean and a standard deviation or you could assume a non-parametric model that simply says I'm just going to you know break up the Distribution in different parts and just simply measure how much is in each part if you know that your data is distributed as a gaan you're
doing great you can just use that if you don't know then you want to be a little more unbiased for example it could be a you know multi Peak distribution or you know non um bell shaped distribution and so so forth is everybody here awesome so uh and then to combine multiple features that's where you can Assume uh in the naive base scenario you just assume Independence you assume that all of these features are independent of each other and that's the naive Bas assumption it basically assumes that all of the features are independent and therefore
that the join probability of all the features together given a class is simply each of the features in isolation and therefore the product of a bunch of independent classes of course this is almost never the case however You could do some kind of principal component analysis you could basically separate the all of these different measurements into a set of separate principal components and then you can actually use you know base uh classification that way okay so again this was optional so we're not going to cover it but basically we talked about uh gene expression analysis
we talked about K means we talked about hierarchical clustering we talked about Naive based classification and we also talked about how this does not apply solely to numbers it can apply to text and you can really go wild because it is 2024 and you know large language models are are around and and sort of what I showed you earlier with the teest classification this is super trivial it's basically just looking at the lat and embedding representation of a large language model par of whatever text it is you can Basically you know use that and if
you guys want to use it for your final projects you know I I would love for all of you guys to be able to visualize to sort of zoom in to the different clusters that you're learning and so on so forth okay so uh that's where we end for today and um I will see you guys on Thursday where we're talking about um some more fun stuff so thirdly we're going to talk about uh he Mark of models dynamic Programming parsing and sequential data yeah