hello i'm thanks shahi um this is linhya mung i'm the assistant professor from beta college of medicine and also the lab director from baylor genetics so as a lab director overseeing the dry lab at beta genetics we often face the bottlenecks that we are unable to keep up with the increased case number of faster turnaround time so in today's talk i'm going to share with you our experience working with using the imaging platform to do um coaxial analysis in our lab so what is a bottleneck we are facing we all know that the cost of
genome sequencing has fallen to levels which is no longer the bottleneck for creating clinical reports however the cost of dry lab is huge compared to the wet lab this um is due to the information overload which we have a lot of variants from axonal genome sequencing that need to be interpreted each of the variants require highly trained individuals to assess the evidence and then do the judgment the acmg and provided interpretation guidelines for the varying interpretation however it has not been um integrated if we are not using the ai platform and lastly there is always
a need to reinterpret exome or genome data with to keep up with the new um published information from the literature so our lab has been working with axon sequencing for a very long time so in this publication um from 2013 we published in new england journal medicine we um here is a kind of our workflow at that time so as you can see for each of the axon cases after filtering there's about 400 and 700 variants left that we need to manually assess each of them do the decision making including the variant pathogenicity the phenotype
matching the inheritance in order to decide whether we want to put the variant on report or not so this is a very manual process and takes a lot of time for excellent review so in order to increase our work efficiency about a year ago we started to working with imaging to look for the options to do a more automated genomic interpretation so here's a high-level kind of summary of the imaging platform so they have their knowledge database which is created from the scientific literature and scientific database and then through machine learning they evaluate each of
the variants using the patient variance patient phenotype cross check with the knowledge database and to form each of the hypotheses and then this process is automated for each of the variants for the axon so before we started implementing imaging platform in our lab we would like to know um whether the platform is doing the job correctly so we've performed accuracy study using 180 non-selected positive west cases from our lab all those cases have been previously manually reviewed by our lab scientists and lab directors and using imaging platform we want to measure the ranking of the
diagnosis variance and the percentage of the cases that was captured by the top 10 ranked variants and and also later we'll talk about our clinical production cohort including the validation implementation and our experience with 334 clinical cases we also look at the automated re-analysis possible in the last slide so our accuracy cohort um is quite similar with our production cohort so it is a good representation of our real clinical work the only exception the only difference between accuracy could harm production cohort is that um and the accuracy cohort is all positive cases while the production
cohort is a mixture of positive and the negative cases and both cases both cohorts have very similar phenotype presentation as well with on the top phenotypic as the neurologic and neuromuscular presentations so we first evaluated the diagnosis rate from the 123 trill cases so the graph you see here the x-axis is the ranking of the diagnosis variant and the y-axis here is the number of cases out of 123 fields we look at it 109 cases have the diagnosis variance listed as the top top one variant and overall 98 of the cases have the variance listed
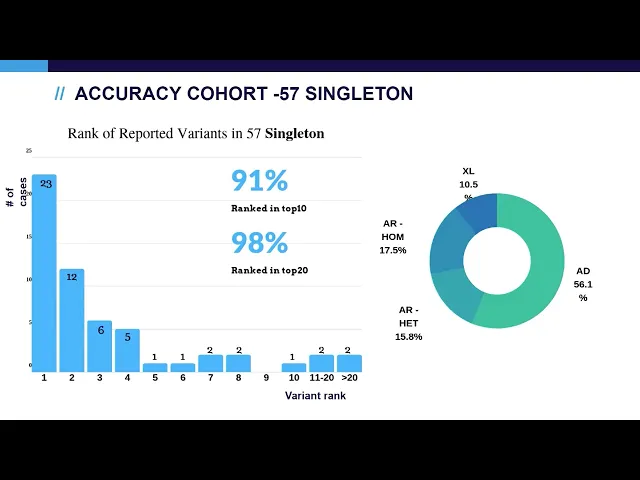
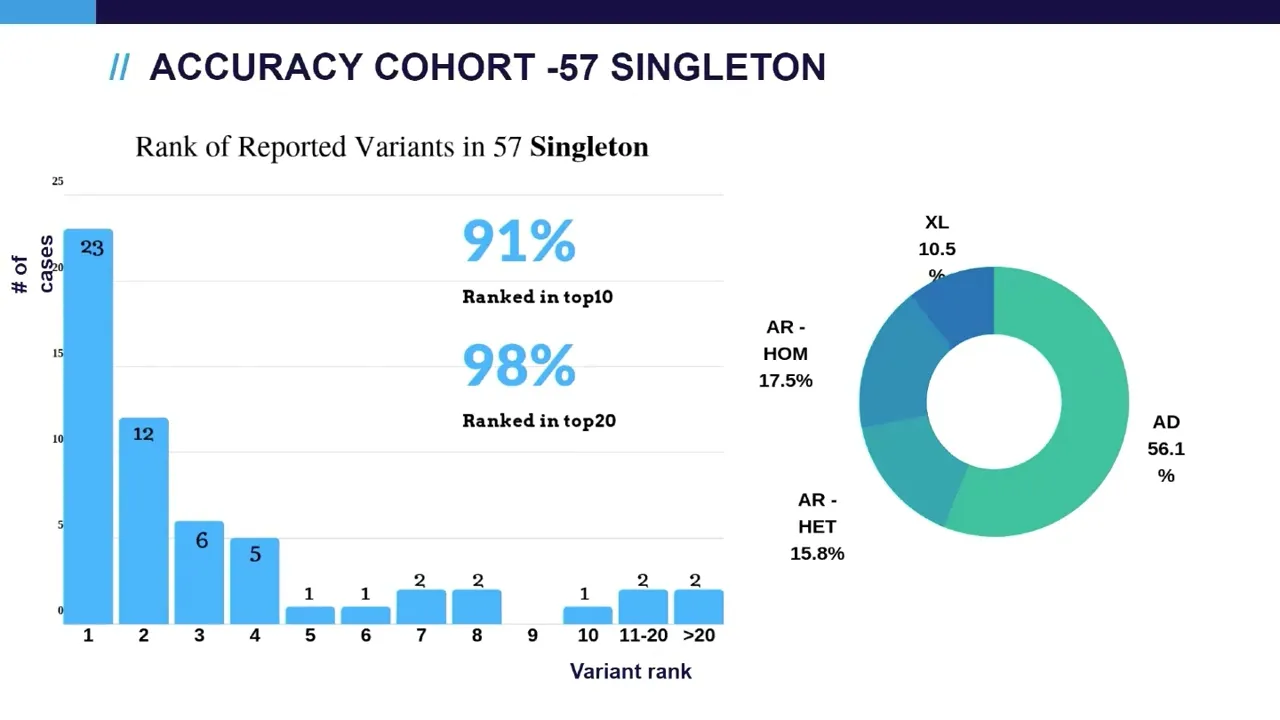
in top 10. and the diagonal our diagnosis um include all possible um inheritance patterns including autosomal dominant denominating heritage situation autosomal recessive compound head and homonygous situation and excellent general and inherited situations next we look at singleton cases as you can see the performance a little bit lower compared to trio cases and this is well expected because in singleton cases we don't have the parents data available for the inheritance model analysis and we also achieved similar the cases also include similar inheritance patterns so next we look at those cases that has a relatively lower ranking
scores trying to understand the limitation of the ai algorithm so we found out that first on category of cases are those with incomplete genetic data so showing here are three cases um the first case is a patient with autosomal recessive at a standard syndrome west identified a single heterodigest vos in the plod1 gene which is ranked at 38 cma later found a axonic deletion in chance the second case is similar which has a apparently homologous variant pathogenic variant in the rbm 8a and gene this variant is a little bit tricky because um by itself even
in homologous status it is not penetrant it is only penetrant with um in transvision deletion which is causing the tar syndrome so cma later identified the deletion and solved the case the last case is the case with relatively complex allele which the allele would break into the two course and then may contribute to the relatively low ranking of this case the next category of cases are those with atypical phenotype information however in all cases we consider them as the diagnosis due to the relatively strong genetic evidence so for example the first one is a seven
week female which has um compound heteroligos likely pathogenic variant and vos in the um cozy gene which uh causing the autosomal recessive and neurodegeneration disease as you can see the phenotype match score given by the imaging platform is zero in this situation however we cannot rule out that the patient is still too young to develop the phenotype a similar situation in the second case which is a pathogenic variant found in the fox p1 gene the patient is a newborn who has not developed the disease yet again the phenotype matching score in that case is zero
um third case is similar and then the last case is a likely pathogenic variant in a genome not unknown significance there's only two publications indicating for autosomal spectrum i'm sorry autism spectrum disorder at that time and therefore we think that may contribute to the ranking we also look at the possibilities of the platform to do the due diagnosis in our cohort there are three cases that has definitive due diagnosis and in each of the cases the ai platform is able to rank both of the diagnosis variants at high level so as a summary to the
accuracy study we found that the automated analysis is able to run diagnosis variant at top 10 for 98 percent of the trio cases 91 percent of the program cases and overall in the entire cohort um 96 percent there are a couple of factors that can affect auto analysis that include incomplete genetic data such as a single singleton analysis um single heterozygous variant in the autosomal recessive engines and complex alleles another situation that can affect auto analysis is the weak phenotype evidence that include either atypical phenotype or the non-omega unknown significance the auto analysis can pick
up on due diagnosis so after seeing the performance of imaging analysis we started on doing a more comprehensive work on trying to implement this platform in our clinical lab so we did um extensive validation using another 60 cases and based on that 60 cases we developed our review sop by working with imaging team we did extensive workflow customization and also the interface on customization in order to fit our labs needs and finally after lunch we did side-by-side run on 50 cases with our old analysis and the new imaging analysis to compare the results and in
all cases the results are consistent so this is our current workflow in our lab to use the automated analysis so the sequencing and bioinformatics on calling was done at beta genetics and then the ai analysis was done in imaging which gave us first tier of 10 variants called most likely and the second tier 100 variants are called candidates and in addition to that we performed independent beta genetics preset filtering to complement those auto analysis and all those variants um still under through the manual view of the scientists as well as the lab directors and finally
the reporting was done at beta genetics so um up to october this year um we have analyzed about 334 cases and uh looking at the diagnosis rate we are able to achieve 29 of diagnosis rate in both singleton cases and trio cases and this diagnosis rate is consistent with the previously published west cohort from other u.s reference labs so lastly um we look at the possibilities to use ai system to do the um large-scale case u analysis as we all know that as in the reference lab as we accumulated more and more cases throughout the
years it is very labor intensive to manually assess those historic cases so in order to speed up the process imaging develops a new model um to assign a solved unsolved probability score to each of the cases so that score will give out the probability whether the case will be solved by the west analysis so um we apply the model to the 334 production cases and in the figure you see is on exit axis is the number of cases ranking by the probability score from the lowest to the highest so the lowest means the case is
more likely to be unsolved and the high score means the case is more likely to be solved so if we look at the bottom quartile of the cases from 0 to 0.5 2.5 of the score there are only five percent of the cases that is solved and 95 percent of cases are unsolved based on the manual review and if you look at the top and quartile cases 77 of the cases are indeed solved based on the manual you view so we are currently working with imaging to see how we can best utilize the model to
do the reanalysis and how we can implement that in in our clinical workflow so with that um to summarize our clinical um production experience imaging auto analysis has been validated customized and integrated into our clinical excellent review at beta on genetics we still do currently do the two-step manual review in order to ensure our axon quality um the diagnosis rate in 334 clinical cases is about 29 that is in range of the previous manual review cohorts and currently we are looking to explore options to do a more automated analysis on for case reanalysis and that's
it thank you