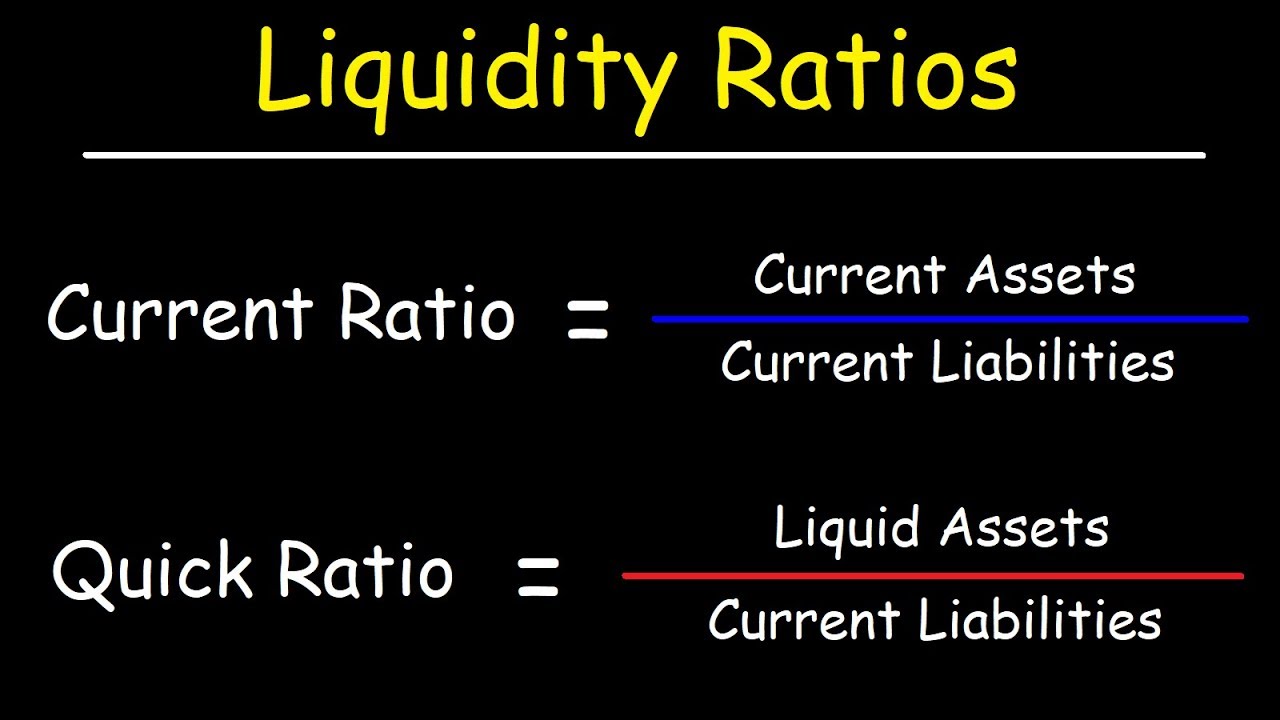
[Music] [Music] welcome students so in my previous lecture or till the previous last part of discussion we were talking about the ratio analysis or analyzing the financial statements with the help of ratios and so far we have discussed five ratios about this Grasim industries Limited which was current ratio quick ratio super quick ratio and then the turnover ratios to turnover issues that is datas turnover ratio and the creditors turnover ratio means the debtors collection period and the creditors payment period and in these five ratios we have seen that the liquidity position of this form is very good it's excellent and they are doing very well they're keeping the optimum amount of the liquidity and when we looked at the current ratio we found it that it is well within the say acceptable range emissive rather and less than the standard rule of thumb of 1. 33 is 2:1 and the company is managing this liquidity by having such a low current ratio where the cost will be very much under control second ratio week we looked at is that is the Cooke ratio and Cooke ratio was yes according to the standard rule of thumb that is one is to one and when we try to know about the cash ratio that was just 8% so company is keeping 8% cash maybe if you talk about the total current liabilities so they are keeping only 8% cash so it means it's a it's a wonderful liquidity position they are maintaining not less not more level of the liquidity and in that case you can make out you can understand that the form will never default and will never be technically insolvent when we use the term technical insolvency when we use the term technical insolvency technical technical insolvency technical insolvency means that when any short term liability or any liability becomes due to be paid to the source from where the funds have been arranged and the form is not able to pay it maybe the firm is not insolvent firm is having a good position if you look at it as a liability position then they are enjoying a good position it's a profit-making firm also what the form is not having sufficient liquidity profits are there but the profits are not in the form of cash so when there is a lack of liquidity when there is a there is a shortage of the cash with the form it means form is not able to make the payment on the due date so how strength will you are but if you are not able to make the payment of your creditors on the due date it means that means the strength is of no use so it means that situation when the form though it is solvent it's having a good financial power financial strength but it's liquid is lacking or it doesn't help the substant liquid funds in that case that is called as the situation of the technical insolvency that firm is not able to pay for its obligations pay for its liabilities on the due date on the time so there's a technical insolvency but we have seen that in case of Grasim industries and their short-term debt they have taken entirely that is in the form of the working capital limit wcm CL or that you can call it as the working capital line or UCC call it as a working capital line or the CC limit so in the form of CC limit entire short term debt is in the form of the CC limit and CC limit is not considered as a debt kind off we keep on receiving visibly we withdraw the money as and when we need the funds and we deposited back when we have the surplus funds so it's on the daily basis you can say so technical insolvency is not expected in the form like Grasim industries because it has a very optimum amount of the liquidity because I am using the term optimum optimum amount of the liquidity optimum means when you don't have the more liquidity you don't have the less liquidity if you have more liquidity means level of the current assets that is the inventory that is a debtors then it is the say cash and then it is a prepaid expenses or you call it as marketable securities you have a very high level of the current assets so sometimes the current ratio is to 2 is to 1 or something sometimes even it is more than 2 is to 1 so when the forum has a very high current ratio in that situation is considered as over capitalized from as far as the working capital is concerned as far as the short term for the situation is concerned and I tell you that if we keep the high amount of the current assets I discussed with you that keeping high amount of the current assets increases the financial cost and when the financial cost is going up your profits are getting affected and when you reduce this level of the current SSE investment in the current assets to the optimum level means I don't say that you bring it to the minimum level if you bring it down to the minimum level in that situation what will happen the forum will be technically insolvent because you don't have the sufficient cash here sufficient liquidity to pay for the liabilities on this side so it should not be neither too low or too high it should be in between that is a optimum amount that how much amount of the capital is required to be maintained the forum is maintaining that amount and it's not keeping very high and whatever only thing is that in the short term funds what happens that whatever the saving you do here by investing less in the current assets or optimum in the current assets whatever the savings we make here those all savings directly result in to the increase the profitability they directly result in to the increased profitability because time period is very short it is in a few days or months maximal trismus you keep the inventory for a few months you keep the debtors for only a few months you keep the cash on daily basis so if you save any any cost on account of these current assets there is no leakage of this savings there is no leakage there is no pillage of these savings these savings can be transfer to our profits and profitability of the firm increases so those forms who are keeping the optimal amount of the working capital in that case what is happening that they are not going to be technically insolvent and second thing is they are not going to increase their financial cost so because they are maintaining the level of the current assets which is actually required in the firm so profit is also protected and the technical insolvency is also avoided so we have seen in the five ratios ratios so far that the current ratio quick ratio super quick ratio and then debtors collection period DCP when we calculated saw the DCP the form be formed that the debtor collection period in this form is about in this form is about 20 days which is very very even call it as no period it means that talks about the strength of the forms products demand for the forms products market for the funds product who gives the less credit in the market whose product is easily saleable in the market and when the product is easy sell you in the market either you tend to sell that on cash and if an anyhow if you have to record the credit be required to give the credit period also that credit period is minimum or you can call it as as low as possible but when we compared it with the credit payment period cpp credit payment period was very high 180 days it means this you look at that they are getting the credit for six months whereas they are giving the credit for a period of less than even one month so this is the strength of the form this is the liquidity position of the form form is maintaining sufficient amount of the liquidity neither we are investing investing too much in the inventory nor in the debt rest nor in cash no prepaid expenses and marketable securities are also not there so it means very norm normal level very optimum level of the current assets they are keeping now we will calculate the next ratio that is the last ratio in the liquidity ratios and that last ratio is the inventory turnover ratio let's see that how far that in which means for how many days the inventory is staying in the form and how in how many days that inventory is convertible into cash in holidays the inventory is convertible into cash that is inventory turnover ITR inventory turnover ratio ITR inventory turnover ratio or the ICP inventory conversion period so when you calculate the inventory turnover ratio I discussed when we were talking about that say formulas and the basis of calculating these different liquidity ratios I discussed with you that the inventory turnover ratio has to be calculated like this sales divided by the inventory or closing inventory you can say or maybe the average inventory so sometimes you can take the average inventory or sometimes it can be taken as a closing inventory but when we talk about the numerator it's better to take this as the cost of goods sold CEO G is if you take the cost of goods sold it's better because though the cost of goods sold is not directly given in the profit and loss account we will have to calculate their cost of goods sold but we can calculate it and divide it by even closing inventory so maybe the closing inventory or the average inventory whatever it is it's not going to make a big difference much difference but the it has to be calculated like this and for this for calculating the inventory conversion period again we had to use this term period 365 divided by the inventory turnover ratio 365 divided by the inventory turnover ratio is going to us the inventory conversion period and we are going to find out that for how many days the firm is keeping the inventory as inventory and in how many days the inventory is converted into cash so we will use this formula for calculating the inventory turnover ratio that is cost of goods sold divided by the closing inventory and for the Grassi of industries if you look at that I say a crew cost of goods sold it's not given to us so we'll have to calculate the cost of goods sold closing inventories I think it is given to us if you look at the closing inventory that is given to us and that inventory figure is this is the inventory figure that is 8 to 4. 14 is a closing inventory for this year two thousand six and seven and 750 point seven three is a super corrodes for the year 2006 but the cost of goods sold is not there let's see whether the cost of goods sold is given to us no it's not given we are given the material cost we're given the manufacturing expenses we are given the purchase of finished products and we have to take one more item into account that is the decrease in the of the stock-in-trade that a decrease in the stocks so to calculate the cost of goods sold we all know that we need the material that is the raw material so we have to tell you the cost of raw material this is the raw material consumed so let's calculate the C OGS c OGS can be calculated by that what we have to take here first of all we have to take the raw material the raw material consumed is the cost of goods sold and raw material consumed is double to 1/9 in that a of two thousand six and seven 0.
32 0. 32 and then you have to take that and if lecturing expenses so if you take the manufacturing expenses how much is that manufacturing expenses manufacturing expenses are one seven double four point three three one seven double four point three three and then we take the third item that is purchase of finished goods purchase of finished goods directly finished goods and purchase of finished goods means three to one point three two one point one six and then decreasing stock if you take it has come down to sixteen point four four so there is a decrease in the stock by sixteen point four four so if you take these items this works out as how much this will be a 1013 m5 and then it is 1 4 7 8 12 1 and then it is 10 14 15 and then it is 16 so it is going to be a 9 for 21 and 6 so it is going to be how much that is 6 7 7 & 4 11 12 1 10 14 15 and 6 21 so it is going to be like this so finally the total costs of goods sold is going to be 4 3 0 1 point 2 5 so cost of goods sold is this much inventories directly given to us so for three zero one point two five cost of goods sold is four three zero one point two five and divided by the closing inventory if you take take the closing inventory we have already seen the figure of the closing inventory is that is a two four point one four eight two eight two four point one four eight two four point one four this is the closing inventory figure and in this case for calculating this you take the reverse of it so it is eight to four point one four divided by the four three zero one point two five so and multiplied by 365 so this ratio works out as seventy days seventy days is for the year two thousand six and seven and seventy four days for the year two thousand five two thousand five and six so we have calculated the inventory turnover ratio inventory conversion period actually and when you find the inventory conversion period eighty seventy and seventy four days is roughly in the range of 70 days so I we can understand it also because this form is into the textile industry and textile is basically dependent upon the agricultural material cotton and then it has a long process means that process is very long so buying the raw material and then converting that into the ferrous product or if you talk even that the say selling the finished product in the market it is a textile product and you have to keep a sufficient stock of the textile so that there is no out of stock situation and you can convert that closing stock and you talk about the material raw material it is because of the long press process it is requiring because it is safe bleaching dyeing miss converting their cotton into yaar and their bleaching dyeing and so many other things have to be done so it is going to take a long time so conversion of raw material into finished product is taking much time and then converting the fan its product into sales he is also taking some time so it's about 70 days which is not a big time they have to keep the inventory for 70 days around 70 days last year it was 74 days but in two thousand six and seven it has come down to 70 days so you can see it is in the range of about 70 days little more than two months which may be optimum better estimates will be whether it is high or low will depend upon if we compare the ratios of the other forms in the textile industry or you compare it with the industry average then we would be able to but if you look at the other indicators like current ratio quick ratio super quick ratio or the debtors turnover and the creditors payment in that case we can easily make out that this period doesn't seem to be much longer this seems to be the optimum period because in one ratio the company cannot be left behind they must be having it and less than this or more than this is not advisable so they are keeping the inventory for 70 days so this is overall liquidity analysis of the form if you look at the overall liquidity position of the firm we can easily understand that all the six ratios three ratios based upon the current assets and current liabilities and three ratios based upon the turnover of the debtors creditors and your inventory even the down over position is also very good it's excellent is wonderful and the form is maintaining a very good amount very optimum amount of liquidity and this is a wonderful organization it's a wonderful form they are maintaining a very good financial position very good liquidity position and it is reflected into their overall financial position in the balance sheet in the profit and loss account and all our results if you look at they are really good they are wonderful after this we'll be talking about the next set of ratios and we have seen there now a 100 we discussed as the theoretical composition so far we discussed the three sets of ratios and in this three sets of ratios we talked about the different components and in those different components we a first we talked about the ry issues then we talked about the solvency ratios and then we talked about the say liquidity ratios so these three ratios we have discussed the so far and we try to understand these three ratios with the help of a case of aggressive industries and when we calculated that a turn on investment of Grasim industries or when we try to understand the solvency of the Grasim industries in that case we found there the Galatia industry is maintaining a very good having a very good return on investment similarly the Grasim industry is having very good solvency and the Galatian industry is having the very good liquidity next set of the ratios is called as the turnover issues next set of the issues is called as the resource efficiency or not turnover issues then over ratios when you calculate these ratios these ratios again can be seen that when you talk about the resources first we have the financial resources first we have the financial resources and these resources are like your the liability side of balance sheet there we are talking about the capital that is the equity and preference capital we are talking about the reserve and surplus we are talking about the I say then the external sources but first we are more concerned about is that is about the internal funds or the net worth the form has and then you can see the efficiency of the asset side that the turnover of the ratios can be calculated with the help of the asset side so we will compare the turnover of the form or the efficiency resource efficiency means turnover means for the resource efficiency means with what efficiency the form is using its adjusting resources with what efficiency the form is using its existing resources and resources if you look at that you can look it at the resources from both the sides first is from the liability side of balance sheet and if you look at the liability side of balance sheet you call it as a net worth that whatever the internal funds because external funds we borrow from the market whenever we have the need but initially we invest the funds from our own resources and if we are investing the funds from own resources we'll have to compare that whatever the internal funds the font form has with what efficiency these funds are being used so that will be called as the net worth and net worth turnover ratio we will be calculating that with what efficiency the net worth of the form is being used second on the asset side of the balance sheet if you talk about then we will be trying to know about the say fixed assets turnover ratio Network turnover ratio and the fixed assets turnover ratio that whatever the fixers land plant building machinery the form has created how efficiently the form is using these fixed assets how efficiently the form is using these fixed assets that is very very important so here two important ratios that is the fixed asset turnover issue and the net worth turnover ratio and then we will be talking about the other two ratios also that is the debtors turnover ratio debtors turnover ratio and the inventory turnover ratio when we talk about the turnover ratios we include these four issues into the resource efficiency or in the turnover category and here we have fixed asset turnover ratio net worths turnover ratio that is turnover ratio and inventory turnover ratio so it means how efficiently the firm is using its net worth - Lee the form is using its fixed assets how quickly the firm is converting the sundry debtors means into sales or misandry debtors into cash or collecting the sundry debtors and how quickly the form is converting the inventory into cash or they are selling the inventory into the market so these are the four important ratios first ratio is that fixed asset turnover ratio first ratio is the fixed assets turnover ratio and if you talk about the fixed assets turnover ratio it can be calculated we'll learn how to calculate the fixed asset turnover ratio and for this we compare the fixed assets with the sales the ratio is calculated here like sales that is you can call it as - excise duty sales - means their net of excise duty so sales - excise duty divided by the net block net block of fixed assets net block of the fixtures sales - excise duty divided by the net block of successors with the help of this formula we can find out that finally what is the level of series how many times the ratio says how many times the sales are off your total fixed assets net fixed assets means that is that total fixed assets - depreciation will have to take the net fixed assets so how many times the sales are of the net fixed assets this ratio is going to tell us how efficiently we are using our fixed assets so that the sales are maximum and we are getting the maximum return from these fixed assets then we talk about the net worth turnover ratio and when you calculate the net worth to turnover ratio here you say that ratio will be sales against sales that is again the net sales after excise duty has to be divided by the net worth sales have to be divided by the network so how many times the sales are of the net worth how many times the sales are of the net worth we are going to discuss here we are going to talk here about that and this is again a very very important ratio sales means the net of excise duty divided by the net block of the fixed assets we are going to take here and that's going to tell us that times this ratio has to be calculated in times not in percentage in times terms we are going to calculate this ratio and we will be talking about this ratio with reference to the data available from the Grasim industries are the two ratios that is the debtors turnover ratio retailer and inventory turnover ratio we have already talked about so we have seen that what is the debtors efficiency conversion efficiency and what is the inventory term / efficiency of the form we have seen and we'll be calculating two ratios here and that is a fixed assets turnover issue and the net worth turnover ratio for the Grasim industries and then we would see that how efficiently an aggressive Industries is converting its say fixed asset or they are using the fixed assets for maximization of their sales value so if you calculate these ratios you will be able to find out the efficiency with which these fixers are being used by the firm so let's now talk about that and let us try to find out the fixed assets with the form and what is the level of the fixed assets here if you talk about the balance sheet we look at the balance sheet here and the fixed assets are that is gross Palach of accessories six seven seven zero point nine seven and then it is a depreciation that is three three eight zero point five three and then the net block is three three nine zero point four four is the net block of the fixed assets so now to take that fixed assets that is that three three nine zero we'll be taking for the year that is two thousand six and seven so what is the amount of sales if you look at the sales 89600 nine seven we have the excise duty one thousand four point three eight and then net sales are eight six zero three point five nine this is the net C so let's take this figure of eight six zero three divided by eight six zero three point nine five nine divided by the natural log of X a search and how many fixed assets we have we have seen that fixed assets we have is that is three three nine zero point four four three three nine zero point four four so this is the level of the fixed assets and the C is amount and if you calculate this ratio this ratio works out as how much it is two point five four times this ratio is two point five four times it means in the year 2006 and seven the fixed assets and sales as compared to fixed assets were sales were two point say two and half times of the fix s such investment in the fix yes and it's very good it's wonderful you see when you talk about the textile industry one peculiar characteristic of the textile industry is that it's a capital intensive industry it's not labor intensive industry it's a capital intensive industry that you have to make the huge investment in the capital if you want to establish the capital say a textile unit and there you have to have huge amount of land because we need the say more buildings so big land big buildings with large amount of buildings machinery is also very typical and because we have to look at the cost part cost of the textile product should be as low as possible because of the stiff competition so you have to have the excellent machinery latest machinery latest technology so every investment in the fixed assets is very high so we can't say here that if the ratio is coming out test 2. 5 4 times it is not a big ratio it's not a big amount of the sales they are making as compared to the investment in the fixed assets because investment in the fixed assets is itself is very high amount they're having a huge amount of investment in the fixed asset that is three thousand codes of the fixed assets they have and then there is a high amount of the investment in the fixed assets and they are having the sales that is necessary to point two and half times of that two and half times of the of the assets means first out denominator is very heavy and still your numerator is 2 and 1/2 times of that so you can't say that the sales is not very good it's very good amount of the sales had the level being level of the fixed assets been low you would have seen then this level of the series would have been sometimes five or six times four so investment in the fixed assets being very high and even after that the form is having high amount of the sales that is two and half times of the investment in fixed assets is quite a good success and say very good performance and we have seen it is reflecting in terms of profitability financial position everything and and that the ratio for the previous series let's check the ratio from the previous year and that is two point two one times that is two point two one times this ratio is two point two one times it means they are on the growth path they had ratio that is 2.
21 times and now the second ratio is that is the 2.


![Visual Calculations in Power BI - DAX Made Easy! [Full Course]](https://img.youtube.com/vi/JITM2iW2uLQ/maxresdefault.jpg)


![Working Capital and the Change in Working Capital in Valuation and Financial Modeling [REVISED]](https://img.youtube.com/vi/tMgty8jwmHI/maxresdefault.jpg)