what's up guys diamond doctor welcome to this series of YouTube videos and today we're going to talk about the best three long pattern strategies have been tracking for the past month so I should give you some tips and I haven't finished all the data yet but you can use this as your I was the kind of mindset or type of frame or structure you can use to trap specific tickers and the reason you have a bunch of runners the angio xng TBI MRI they all have common stuff that laid around I build out couple structures
for them we can get into the video I know about it so before I get into the video make sure you hit the like button and also leave a comment below what should I do for the next video alright so for long strategies I want you two guys to take a look on X and T be NGO and BMI those are the three biggest runners that happened I will say for the past few weeks and B and Jill is one of the best follow both BMI with a sympathy plate and follow it xnt with mass
among traded now the first common thing you look at is market cap so different market cap zones perform different percentages on the stock entry day so especially on something like B and Jill and BMI those two are considered as a micro cap the spiking percentage on on the day it can be exceeding two hundred percent seven percent sometimes even thousand percent all those tickers they have one specific thing they're all SSR so when the SSR is on the ticker especially on the first screen day it means two words to polish so be NGO and be
I mine they're both SSR on the day and when it spiked and the second thing you wanna look at is the market cap well first thing we already looked at float the market cap they're both very similar one is about nine million this won't work out pretty much always on game but when they spiked it to $5 I think is right around 20 million 30 million market cap so we can use this so right now it's $1 ish when it hits $5 so use 10 million market cap times 5 which is 13 million and also
super close to be IMI and both tickers maximum squeezing percentage or maximum spiking percentage will be near 500% so this one actually went from chewed 11 is well actually it went from 1 to 5 so there are both 500 percent and once you know the and you can put that in your spreadsheet that say when the stock is on SSR was a maximum tab with 50 million and the maximum spiking percentage would be five hundred percent so in this case you can use this as like an average taking profit percentages let's say I already went
long at one so the maximum is five hundred percent and hourly exit most of the positions but I know there's a maximum pullback point so I want to exit right before the maximum percentage which is how many percent now something you can put your spreadsheets to remind you of where you take profits and also can help you top ticket the ticket when you are going along now let's follow with X and T now in this XM t is trading much different market cap zone this is around two hundred meeting market tab and flow I think
was around 30 to 20 million if you want to check the acura you can check FM basic calm or yahoo finance those are the two most convenient website and check for accurate flow a market cap if you want to be more accurate and more specific about warns and offering price you can go ahead and check at sec gothic own that website has the most accurate flow and market cap in print in stock secretary it's not that important to read the full fundamental because pretty much opening stock fundamental are super garbage next thing you want to
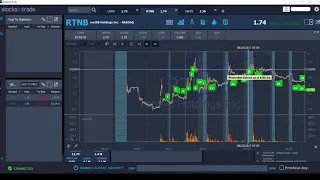
look at the chart performances when you take a look up this chart the chart is trading massive amount of volumes same thing with be NGO something was x NE t vm i trade the over I think was 50 million volume 25 million volume with a two million flow so that's about 10 times of low rotation be NGO traded about 60 million volume I think 10 million shares it's assuming to miniatures so that's about five times of floor rotation now follow with XA et this one trade about 61 million volume but it has about 20 million
flow so that's a three times for rotation now in this case you can also put your spreadsheet as say it's saying in this case you can also put this factoring in your spreadsheets let's say with the flow anywhere between to anywhere between x three to ten times its concert to really polish is because if the flow keeps rotating there's more buyers to keep coming in and when there's more demand the price is likely to go up now the third thing we don't look at it's the chart itself when a stock keeps going and it doesn't
really have a long period of consolidation time and when we studied and when I started back in the days parabolic moves fast moves like when this candle spikes 50 percent 30 percent or a hundred percent those type of fast move something like one from one to four super fast those involves a lot of emotional play there will be short sellers shooting at the parabolic move there will be buyers buying a parabolic move every single moves are super emotional now you want to put buyers and sellers into the same computations and when the stock has a
really low flow when the buyers and sellers are really fighting each other when the stock is attracting more volume that means there's more buyers going to come in just by supply demand itself the buyers will win is because when the stock is attracting more volume and it's not consolidating short sellers are emotional that's the best scenario to really catch saucers off-guard that's the reason why I tell you guys never sure on the first Green Day when there's more emotional movie involved and there's a lot of one being traded in the ticker basically the more demand
will come in there's only limit amount of supply that's why the stock can go three four hundred percent the same thing happened on B and Jill if you take a look at intraday chart right around here the stock is only doing per buttock move when the stock is getting halted the reason why stock is hotter is they're jumping too fast when every time you to fat it gets interesting and when the stock is halted people are scared or people are feeling emotional it's a the size likely to pull back turns out I didn't and trait
about families are hotter again people can't really tell if it's a t1 212 or volatility hole if there's more emotional and parable move in the ticker the stock is likely to go up same thing with ex ante you don't really see very specific tire range of consolidation in those those tickers the stock bounced back in from three to four dollars that's a large range of consolidation P&G didn't really consolidate at all until we're hitting later of the day same thing with BIA mine and consolidated about an hour then you start to spike again when you
want to go long you want to focus on something that's tracking a lot of volume and the stock is on SSR the stock is likely to flow rotate for about three to ten times anywhere between that point and also we want to track something that has really short range of consolidation and also the time period of that consolidation is very short that's the key component for a short service become really nervous and start cutting their positions so that's the couple sectors you need to track when you want to specifically go along I don't have enough
data to really support a theory yet but just based on my observations from the past year and to first Green Day always involved with SSR massive volume with short period consolidation guarantee qualities they always tend to spike by the end of the day and typically continues in the second day for most opinion staffs I wouldn't really be comment and for most of the penny stocks I wouldn't really recommend to go overnight is because you're basically risking entry offering most of tickers can do offering and destroy you from now if you take a look at PNG
oh you mean from basically for two sub one in one day so that is the risk and those criterias I've just talked about it's more for intraday non pattern only as I said not recommended overnight so that'd be the end of the video hopefully guys like it and I feel like I'm really behind the view my account statements so I would do a September for maybe next couple videos and we can do like a statistics 102 if you have another suggestions about what should I do for long or short I'll leave a comment below and
let me end up with video thank you very much yeah we'll see you guys next time [Music]