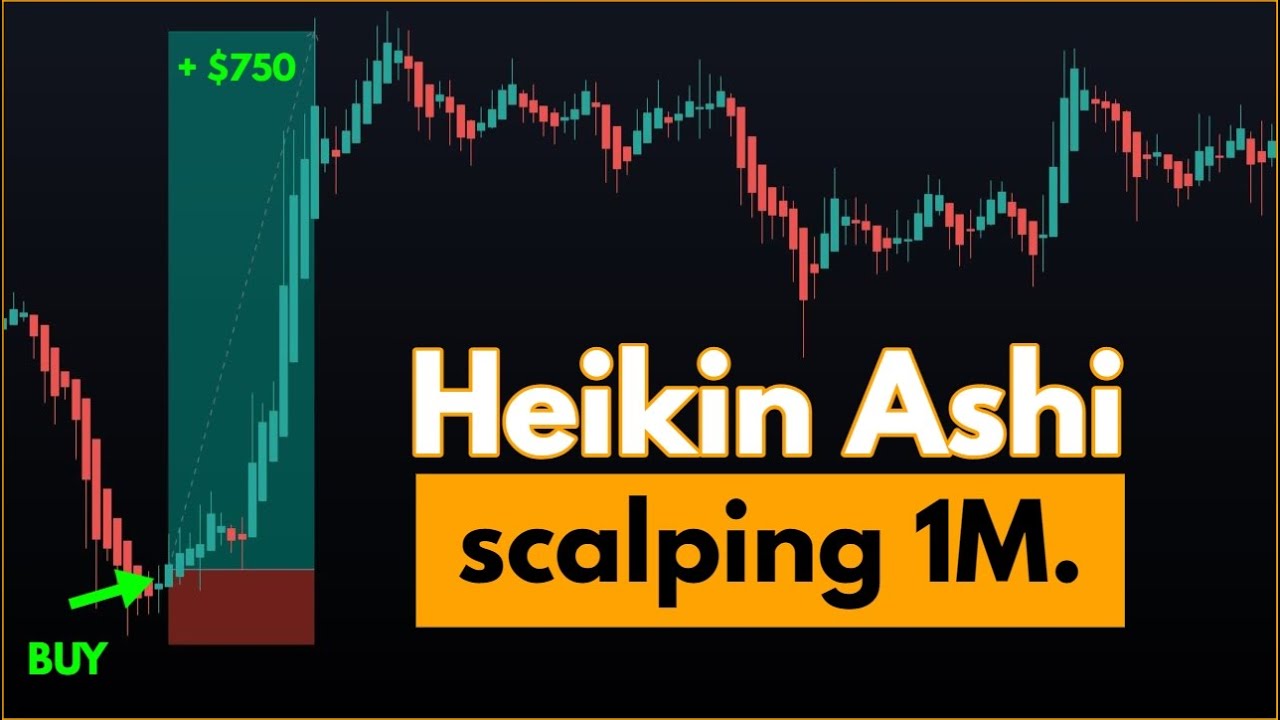
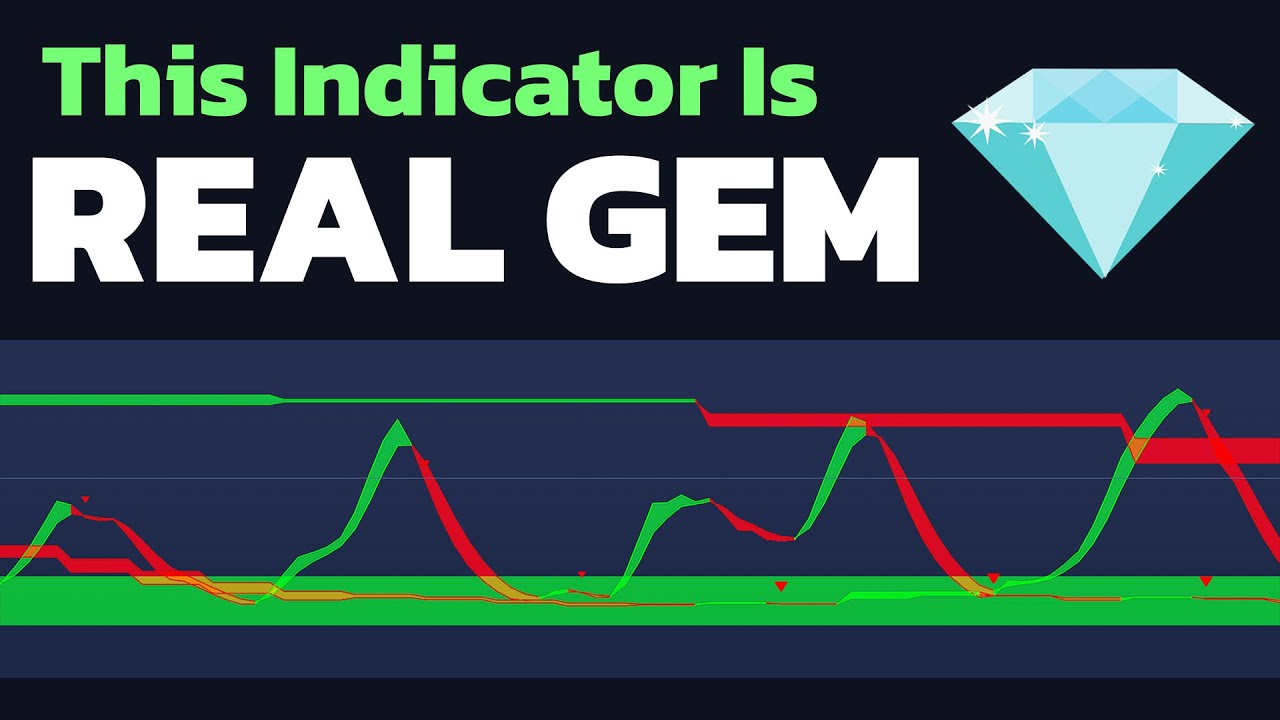
this indicator is one of the best indicators to use when scalping this powerful indicator unlocks a hidden realm of insights providing you with a clear view of the market while scalping the indicator we are talking about is the hiking Ashi RSI oscillator which is a highly versatile indicator that shows us the trend Direction Trend reversals entry and exit signals overbought and oversold zones and many other Market patterns in today's video we will be showing you exactly how the indicator can be read and how it can be used to enter into positions along with a profitable
scalping strategy that utilizes the indicator let's first add the indicator to the chart head over to the indicator search Tab and search for the harsi indicator select the indicator made by Jay Rogers and add it to the chart now let's head over to the indicator settings tab as you can see there are many settings that can be changed the first of which is the length of the indicator you can increase or decrease this depending on the length which you want to give the RSI indicator as you can see by increasing this value the indicator becomes
less sensitive and less precise however if we decrease the value of the indicator becomes a lot more sensitive to the price movements since we will be showcasing the indicator on a lower time frame we will change the value to 10. the next setting is the open smoothing by increasing the value of the open smoothing it increases the bias towards the prior open value helping provide better visualizations for the strength of the trend because of this let's change the smoothing value to 5. if we scroll further we can see that there is also a setting for
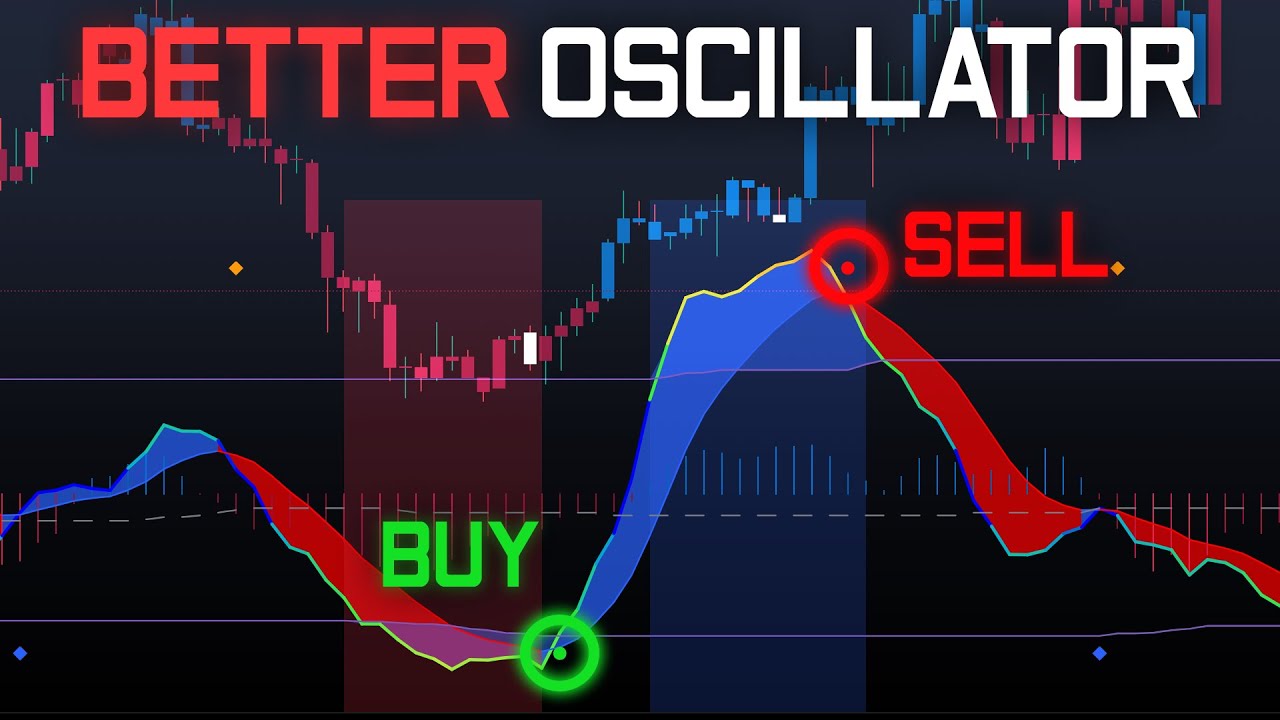
changing the length of the RSI plot finally you can also add a stochastic RSI to the indicator however we won't be using it so we will be keeping these settings at default now that we have changed the input settings we will be changing the style settings here we will first be removing the RSI histogram overlay and Shadow after that we will be removing all of the components of the stochastic indicator that was all that we needed to do the indicator has three components the first component of the indicator is the RSI haikin ashy candlesticks these
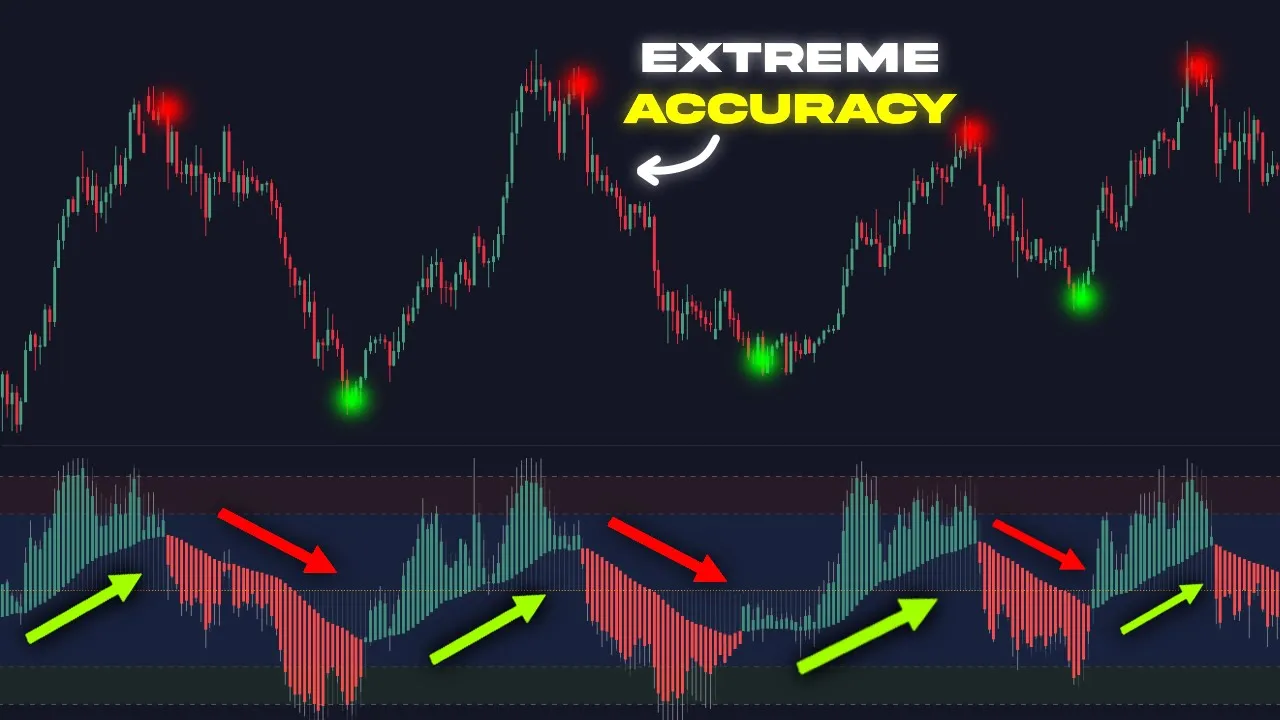
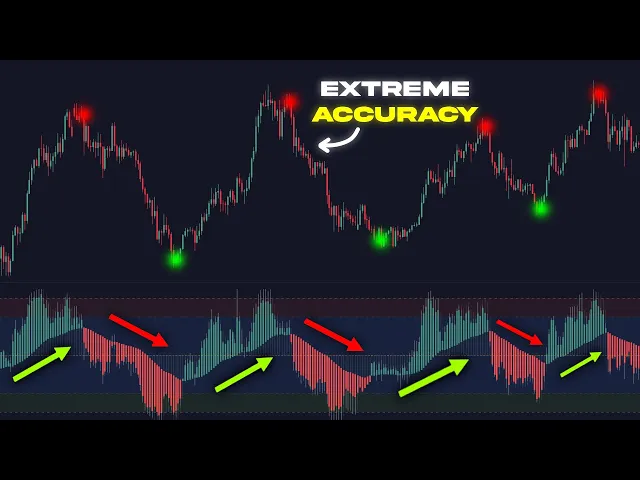
candlesticks display a modified version of price action smoothing out the noise and making it easier to identify Trends and reversals the second component are the overbought and oversold zones these are the green and red zones that are plotted at the 20 Level and the minus 20 level whenever the candlesticks reach these zones we consider the market overbought or oversold the final component is the center line the center line is set at a value of zero this line represents the equilibrium or middle point between bullish and bearish momentum when the oscillator crosses above the center line
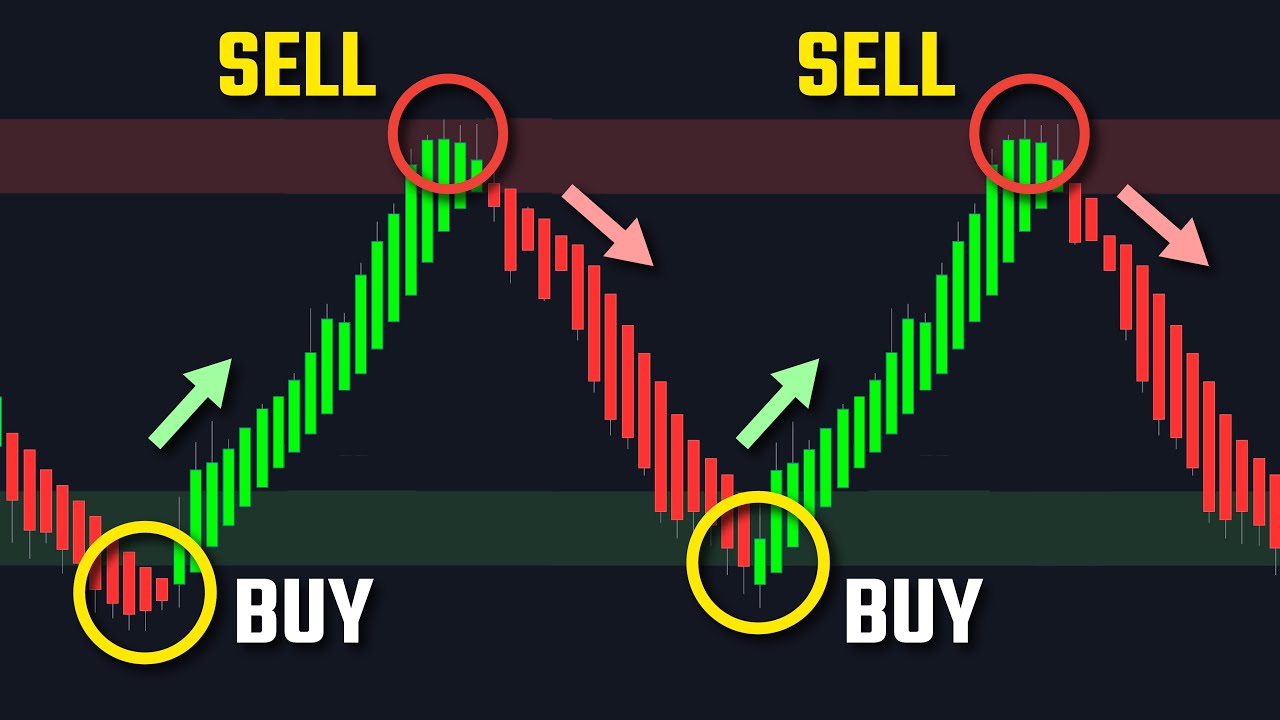
it indicates that bullish momentum is gaining strength and may suggest a potential uptrend and whenever the oscillator crosses below the center line it suggests that bearish momentum is increasing indicating a potential downtrend it's first important to understand how the indicator can be read the easiest and most straightforward way of reading the indicator involves looking for oversold or overbought signals whenever the candlesticks on the oscillator reach the overbought Zone it indicates that a pause might occur in the uptrend or that a bearish reversal might start playing out on the other hand whenever the candlesticks on the
oscillator reach the oversold Zone it indicates that a pause might occur in the downtrend or that a bullish reversal might start to play out there are also extreme overbought and extreme oversold levels these are zones that indicate a stronger signal than the regular overbought and oversold zones the extreme overbought level has a value of 30 whenever the hike and ashy candlesticks Reach This level it indicates that there is a high chance of the price making a bearish reversal conversely the extreme oversold zone is at the -30 level and if the hike and ashy candlesticks Reach
This Zone it indicates that there is a high chance of a bullish reversal occurring this is the most straightforward way of reading the indicator however other methods can be even more profitable one of these methods involves looking for differences between the price action and the indicator here we can see an example of this the price was making higher highs while the hikanashi candlesticks were making lower highs this shows us that a bearish Divergence is playing out making it likely that a trend reversal to the downside may occur if we take a look at the price
action after the move was made we can see that this indeed was the case here we can see that the price is making lower lows however if we look at the horsey oscillator we can see that the candlesticks are making higher lows indicating that the lows that the price is making are weak making it likely for a bullish reversal to take place by looking at the price action after the bullish Divergence formed we can see that the price made a strong reversal in the upward Direction in order to create a strategy where we can enter
into positions using the hiking ashy RSI oscillator let's add a few extra indicators to the chart the first indicator we will be adding to the chart is the EMA navigate to the indicator search Tab and search for the EMA indicator select the indicator made by trading View and add it to the chart the next indicator we will be adding is the volume indicator search for the volume indicator after that select the volume indicator made by tradingview and add it to the chart now let's change the indicator settings navigate to the EMA indicator settings and click
on the input tab now change the value of the EMA to 200. next click on the style tab here we will be changing the color of the indicator to make it more visible now let's head over to the volume indicator settings here we will be changing the M8 length to 30. once you have done that head over to the style settings and enable the moving average in order to make the line easier to see we will also be changing the color to white that was all that we needed to do first we will be using
the 200 period EMA to determine the trend of the market based on if the price is trading above or below the EMA next we will be using the hike and ashy RSI oscillator to find the exact point to enter into a position finally we will be using the volume indicator to determine if there is enough volume in the market to enter into the position here we can see that the price is in an uptrend we know this because we can see that the price is trading above the 200 period EMA however we can also see
that the price just made a pullback to the EMA after which a bullish candle was printed which is a bullish signal if we look at the hike in ashy RSI oscillator we can also see that it was indicating that the market was oversold along with this we can see that the candlesticks have now left the oversold Zone and turned green indicating that the price of starting to head in the upward direction again finally there is also a bullish volume bar that was printed we can see that the bar on the volume oscillator surpasses the 30
period moving average showing us that there is enough bullish volume in the market to push the price further in the upwards Direction because of these signals let's enter into the buy position we will be placing the stop loss at the recent swing low for the take profit we will be targeting a two times risk to reward ratio now let's see how the trade plays out [Music] we can also enter into trades without using the EMA here we can see that the price is in a downtrend we know this because we can see that the price
is making lower lows however if we look at the hike and ashy RSI oscillator we can see that higher lows are being made indicating that the price is due for a bullish correction along with this we can see that the red candlesticks reach the oversold Zone before switching to Green finally we can also see that there is enough volume in the market because of the bullish volume bars being larger than the White Moving average because of these signals let's enter into the buy position here we will be placing the stop loss at the recent swing
low for the take profit we will be targeting a two times risk to reward ratio now let's see how the trade plays out in the current market scenario we can see a downward price trend as the price remains below the 200 period EMA indicating a bearish market sentiment however a recent pullback to the EMA occurred followed by the formation of a large bearish candle which further strengthens the bearish signal analyzing the hike and ashy RSI oscillator we note that it indicated an extremely overbought Market condition simultaneously the green candlesticks turned red right after leaving the
overbought Zone signaling a potential downward movement in price moreover a bearish volume bar was also recorded surpassing the 30 period moving average on the volume oscillator this implies that there is sufficient bearish volume present in the market to drive the price further downward considering these combined signals it is advisable to enter a cell position at this point to manage risk we will set the stop loss at the recent swing High for the take profit level we will aim for a two to one risk to reward ratio now let's closely monitor the trades progress and observe
how it plays out as you can see the hiking Ashi RSI oscillator can be used in many different ways to enter into profitable positions I hope you enjoyed the video if you did please leave a like And subscribe to the channel if you have any questions feel free to leave a comment

![🔴 [98% High Accuracy] RSI-COBRA Trading Course: Ultimate Advanced Strategy Revealed](https://img.youtube.com/vi/EbGK1FF2Q_c/maxresdefault.jpg)