Liquidity forms in many areas in the market and has a big bearing on whether you're going to win or lose. One of the areas liquidity forms is around supply and demand zones. So, in this class, I'm going to teach you an advanced liquidity trading strategy to help you avoid losses, improve your accuracy, get higher win rates, and ultimately become a better trader.
If you're new to liquidity, I'm going to explain it to you now. If you're not new to liquidity, use the chapters to skip ahead to the start of the next chapter and we'll start on the more advanced technique. So, liquidity in a market refers to orders.
Orders generally in the form of stop- losses and buy stops and sell stops. There are two very common forms of liquidity and two that we'll be using in the more advanced method. These are equal high, which is this one here, and equal low liquidity, which simply refers to support and resistance levels.
and then ascending and descending trend lines. General retail education suggests when you see a resistance level in a market, you should look to sell that resistance. Okay?
So after the second tap forms, anywhere from there on becomes a good selling level. Now the general idea there then is when you sell your stop loss will go above the resistance because the idea is the market is likely to react from this resistance level and trade down without breaking above. So we know from this there is going to be a lot of traders with stop-loss orders above the equal highs.
So here we have stop- losses. Now, as well as this, we have breakout traders who will be looking for the market to push up and break above a resistance level and then use it on the retest as a support to buy from. So, as well as stop-loss orders being above the high, we're going to have buy stop orders, which are automatic buy orders.
Essentially, this creates more liquidity and more orders above that level. Now, if we think about what a stop-loss is in the case of a sell trade, it is an order to automatically buy back contracts for more than you sold them for. Because a short selling order, i.
e. selling at these levels, is simply where you sell with an obligation to buy back later, regardless of whether it's a higher or lower price. So, stop losses in this instance are actually buy orders.
We have a large amount of buy orders above this level. Now in two formats in stop- losses and in buy stops. Now if we have a massive amount of buy orders above this level.
So that creates a lot of buyside liquidity. What do we have as a potential opportunity here? Well, let's say you are an institutional trader, a bank, a firm, or simply a large player with massive amounts of money, multi-million dollars, and you want to place large orders.
Now, if you think about where we are in this point underneath this resistance, if you want to sell millions of dollars worth of a contract, you will be left with a pretty bad price. What will actually happen is you'll sell some and your movement could drive the market down because the amount of money you're working with is so large. So then your second execution may be here, you may get a third execution here, and so on.
you're going to have a bad average price because the selling you're doing is actually driving the market down, meaning you'll never be able to get your full order on at this good level. So, if you're expecting the market to move lower and you want to sell into that, what you can actually do is wait for this liquidity to be hit and this is going to open up lots of buy orders. So, if there's not enough selling pressure here, there may be buying pressure enough to push us over the high into this area where lots of buying orders are going to be triggered.
When all of these buying orders in the form of buy stops and selling stop losses are triggered in this region, there's going to be a massive influx all at the same time of buying taking place. And if you are a massive seller, you have now a lot of liquidity to take on the other side of the trade. If there are now thousands of buy orders being executed at the same time, you can execute a massive amount of monies worth of sell orders.
And that leaves us with this format which is what we call a liquidity sweep or a false breakout. The market pushes above and stops out anyone who sold the resistance and it also triggers in anyone who wanted to buy the break retest and then the large player can take the sell on the other side of all of these buys which will drive the market down. So it creates a scenario where you end up losing before the market moves in your favor.
Now equal lows work in exactly the same way. We have buying taking place upon a support floor. We have lots of stop losses underneath.
These stop- losses are automatic sell orders. Basically, if you've bought contracts on that resistance, so basically, if you've bought contracts on the support floor around here, your stop loss will be set to automatically sell those contracts back for a loss if the market gets down here so that you don't take a massive loss. So, that creates lots of sell liquidity.
Okay. Now, we also have sell stop orders, automatic orders that will trigger sellers into trades if the support breaks because they will anticipate further downside movement. So, we now have lots of sell liquidity.
If you are a massive institutional buyer, the market getting into this region will trigger loads of liquidity for you to take the other side of. So, then your large buys can be executed easier from down there and the market will make its run to the upside. So, as you can see, buying from support and selling from resistance, what should be a good way to trade actually has a large flaw, and that's the fact that institutional participants who actually have the power to drive markets are not executing at these levels and are more likely to be executing above and below.
So, selling from equal highs and buying from equal lows is generally never going to be a good idea. Now, let's talk about trend lines. These work in very much the same way.
The idea with trend lines is after the first two taps of a trend line have been created, any further taps from there should be good for buying. So we will have traders who are looking to buy another retest of the trend line. Now what do we have here?
Well, again we get this liquidity problem with lots of buying taking place here. We have lots of stop- losses underneath that area. We also have traders who are looking for break retest trades.
So they will be looking more so for the trend line to break, pull back, retest and then sell lower. So as well as having lots of stop- losses here from the buyers, we also have lots of sell stops here for the breakout traders which creates a large pool of liquidity again. So what we'll generally see happening in the market is instead of a clean test or instead of a clean break retest, we will often times come through the trend line, sweep all of this liquidity and then move higher, which ends up stopping out the traders on the buy side and stopping out the traders on the sell side.
And again, it happens because of all the liquidity that larger players can take the other side of. In a descending trend line, it's the same. Any sellers looking to sell a retest of a trend line here or any breakout traders looking to buy upon the break will have considerable number of orders and liquidity in this area.
So if the market is able to get into this area, we then often times see the market just come back down like this creating a false break and again stopping out the buyers and the sellers. So that is the basic liquidity that you need to understand. Now we're going to move on to the more advanced approach of these inducements and the liquidity around supply and demand.
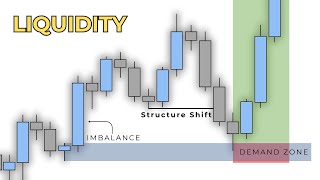
So while the concepts of liquidity structure, supply and demand imbalances all go together in the form of price action or what some people call smart money trading, we still need to be aware of liquidity around areas of supply and demand. So in this instance, we're going to be looking at a supply zone, which is a zone that we would look to sell from once the market returns to that level. Now, in this hypothetical example, what we want to make sure we are doing is considering factors of liquidity like equal highs, equal lows, and trend liquidity when we're looking at our supply zones.
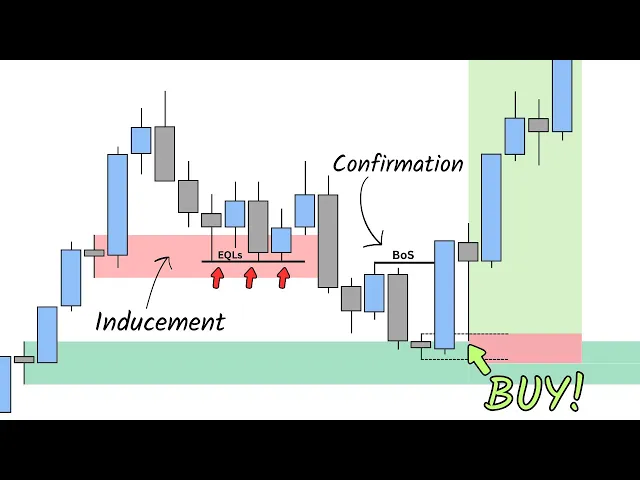
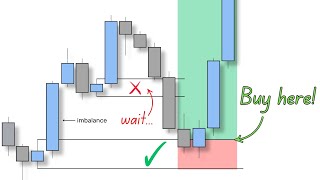
So, if we were to come into a supply zone and formulate this kind of price action where we create this equal high area, this double top area, we realistically would not want to sell from here. And the reason is because although we are reacting from the supply zone, we still have this factor of liquidity and we still may be looking at what we can call an inducement where we could be drawn into the market or lured into a sell before the market takes out those highs. So let's say we sold here and the market so let's say we sold here and we were expecting the market to continue running down.
The risk that we run here is that we actually get a push up to take out the equal highs that have been formed. And the thing is this is quite a common thing to occur. So when we create equal highs like this or what we could see as a double top or resistance inside of a supply zone, it doesn't mean that we're going to get that immediate drive away.
And what will commonly happen is we'll actually drive up and take those highs out before making the sell move. Which means if you were selling beneath with a stop above those highs, you would be stopped out. Whereas realistically it could be a movement like this that takes place.
Now, there's another way that things can go slightly wrong here, and that is if we have a couple of different zones to work with, which will happen quite often when you're looking at supply and demand. So, we see above here, there is an imbalance into a supply zone. Now, if we go ahead and trust this double top or resistance that's formed here, even if, for example, we reacted from it another time and we started to see some serious weakness kicking in, we still have the liquidity problem.
We still have this area above which has a high likelihood of being taken out. And as we've said, sometimes it's going to come up and do this. But what can also happen when we create liquidity like this is the market may extend through into the higher supply.
So, not only do we have to worry about what's going on inside of the existing supply, we also need to make sure that we understand the larger context and if there's any other areas the market may reach to in order to create the large meaningful move. So, how exactly do we combat this then? How do we make sure we're not getting liquidated first of all inside of the supply we're looking at and second of all inside of even the larger context where there could be other zones that the market will be drawn to.
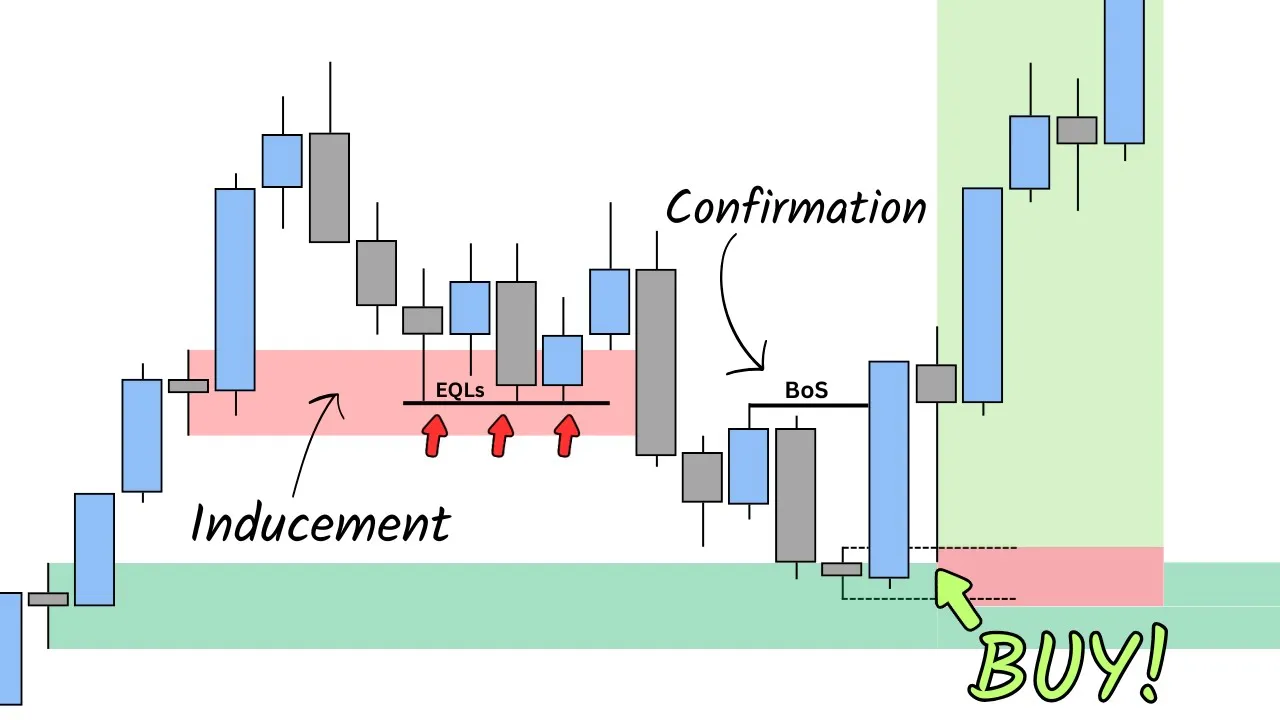
Well, there's an entry model that we can use to get around this problem. I call it standard confirmation. It's nothing new.
It's just a structural shift that we can identify inside of this area or inside of this area to validate our trades better and have a higher probability of winning. So, the standard confirmation is a market that is going from higher highs and higher lows such as this movement up here, i. e.
an uptrend very much in the way that we're creating higher highs and higher lows here and then shifts down into a lower low where we then look to sell from the lower high. So our selling idea would kick in here. Now what a standard confirmation shows us is a clear change in control from buying into selling in a market.
And it's this point here, this break into a lower low which validates a change in the trend. Then when we pull back, we can quite safely sell on any retracement to bring the market lower. Now, if we take a look at what we've seen in this example with the equal highs, we actually don't have that here because we haven't had a clear shift from buying into selling.
All we've done is come up and create a level of liquidity and then we've started some movements down inside of the range, but we don't have the clear change in control ahead of us. We don't see that, right? which means which means it's likely before the execution is made that we will see a push up and then we'll see that change in control where the market shifts into the lows like so.
Now if the market had come into this zone and instead of creating equal highs had done this well then this would have swept liquidity over the swing high and showed a meaningful change in the trend here that we could have used to get into a trade upon the pullback around here. So our trade could look like this and it would be very high probability because what we've actually done is align the smaller trend here. So this reversal that's taking place inside of this area with the larger trend which as we can see is of course bearish.
So we've pretty much used the larger bearish picture and then we've gone into the low time frame structure and found a small bearish picture here to execute into. Right? So, at this point, we have high and low time frame validation and agreement, which allows us to take a high probability trade.
But when we're looking at a market with equal highs, we're not seeing that. We're actually seeing a magnet price area that the market is likely to be drawn towards. And we're not seeing the clear control shift yet.
So, a movement like this would be more ideal to then provide us with the pullback sell opportunity because that would validate a clear change in trend and it would also mean the liquidity is taken out. So if we look at this with the other example of where we may have multiple supply zones, the reason this becomes so useful is because if we created this equal high liquidity here, rather than just having to guess into a cell when we get up here, we can actually wait for the market to make its movement and confirm that change in the trend. Now, often times you're going to see something like this taking place where this initially looked like a really good place to sell and it did create some form of small downward move.
But now, because of your understanding of liquidity, you would have avoided selling because you know that we're under a high probability point of liquidity that the market is likely to be drawn into. Now, if instead of then just selling once liquidity has been taken, you wait for the standard confirmation that we've just discussed, you may see sometimes the market completely fails to react from the existing supply and instead moves on towards another supply like this one here. At that point, you can employ the standard confirmation.
And when you see that change in the trend, that's going to be your validating factor that allows you to sell. in which case you would be able to get a trade like this. Now, because you've also waited for confirmation of this reversal, it will help you to avoid taking a loss here or taking a loss here by just by just blindly selling either beneath or even above the equal highs.
So this confirmation pattern here, which is what we use here to execute a trade like this, is going to save you from a lot of losses, and it's also going to help you to validate the perfect zone to buy or sell from and also lock in entries from the highest probability points. So let's go take a look at this in a real market. Okay, so we're looking at Euro Swiss Frank.
We're on the 5minut time frame. This concept works across all time frames because it's supply and demand. What we've got here is a market that has just started moving to the upside.
We've seen a retest of this demand zone and the market's now pushed up into this new high. Now, we can begin explaining this concept by simply looking at what's already occurred. We had this drive to the upside.
If we wanted to continue buying, there's actually already been multiple areas of demand that we could have potentially looked at for our buying opportunities. There are really three demand zones inside of this range. There's this one here, this one here, and then this low at the extreme.
This has an efficient range previous to it, meaning there's no more imbalance. So, this would be the final zone. Now, if we think about what we've said, we are basically looking to choose the right demand zone and avoid getting liquidated.
So, what we would do here is not buy the first zone. We didn't get any confirmation from this point and there is still imbalance beneath. As you can see, the market then went on to liquidate that low.
We would also not have bought the second zone because as we see when the market came into this level there was no confirmation provided and there is still again imbalance below meaning there is possibility for the market to come into this zone. Now you can see after hitting this zone we've actually seen that shift in the trend. So if we mark up the trend we have the high the low lower high lower low high lower low.
That is our trending move so far. Which means this high just here where I have the BOS marked is where the structure would need to break in order to validate a change in the trend. Now we see after creating this price action, we've had our confirmation.
We've had our break into a new high, which means we can now start looking for buying opportunities by simply using demand to then place our buy limit. Now, that is of course entry number one. That is the bigger setup and we'd expect the market to pull back before leading off into new highs.
Okay. But what we're going to do now is look at a kind of opportunity inside of an opportunity. We're going to isolate the price action to this existing move here.
If we break this down to a lower time frame, we're seeing pretty much the same thing again. We've seen a bearish market shifting into new highs, which creates a bullish market. And now we have to work out where to buy from.
So we have in this range a demand zone just here indecision before a large push away. And we have this demand zone down here which is again indecision before a large push away. Okay.
So I'm going to clear these ones off for now just to keep things simple and focused on the existing price action. To note we have a imbalance into this area of demand and we also have imbalance into the area of demand above as well. So how would we pick which of these zones to buy from?
Well, due to that inducement theory we just discussed, we would number one want to see if we get confirmation inside of these areas. If we get a confirmation in here, then we may potentially be able to lead through into new buys. However, we still have got liquidity imbalance beneath which would lead us into the lower zone.
So, by looking at this immediately, we would consider the most probable outcome is going to be that the market sweeps this level. The reason this is important is because if you start placing buy limits here with your stop loss underneath the zone, you're opening your yourself up to the inducement theory and you're opening yourself up to being stopped out on a trade that is in theory correct. You've got the market direction right.
You know buying is the right move, but you're buying in a place where you can easily lose before the market follows through with its opportunity. So what we would want to see would be confirmations inside of one of these zones with a clear focus as our primary zone on this lower area which is going to be the kind of zone beneath inducement. Okay.
So scaling the market forward we see we get a push down into the first zone. What we would realistically want to see from here then would have been a break above this high. So if we'd come into there and we'd started to push higher we could potentially trust that zone.
we'd say, okay, maybe it's not inducement because we are pushing back at the highs and creating a bullish shift in this smaller trend. And the smaller trend for reference here is going to be this is our high. This is our low.
This is our lower high. This is our lower low. So, if the market had broken up, that would have created what we need to see for a buying opportunity.
However, as you can see, the market didn't do that. It did what it usually does, and it pushed through to fill the imbalance and trade towards this lower zone. Now, if we want to be safe that this market isn't just going to sink all the way down lower, we can use the entry model that we just previously discussed to make sure we are taking a confirmed trade.
So, if we allow this market to scale forward a little bit more, you can see what we've actually done here up to this point is now start to make some changes in the trend. We had this high. We came down.
We created new lows. We've hit this demand. And then inside of some of the refined price action, so 5m minute price action, we've broke a structure point just here.
The market's pulled back and pushed higher once again. Now this has pushed us into what we call an efficient range. There is no imbalance around here.
So we can happily look to buy this market given that we've seen a break of structure there on the lower time frames and we've also seen the market take out these highs. Now, ideally, we would want to see a closure above this level for the most high confidence trade, but in this instance, we have everything we really need to see. We've seen a demand zone retest, break of the internal structure, and we've also seen the market show willingness to go higher here with no supply zone to cap price.
So if there was a clear imbalance supply here and we'd wicked into it, we could say, okay, that is probably not going to be the trade we want to take simply because there's possibility for this to then reverse on us because maybe supply is going to maintain strength and push us lower. But because we don't have that and we've pushed into what we call an efficient range, which is basically an area where there is no imbalance anywhere at all in this range now, we've essentially opened doors to moving higher because there's no point of resistance that should cap price. So, we can look at the next obvious demand.
I mean, this one here, we do have this little wick that pushes out of it. But what do we still have? This is very important to me.
We still have a clear imbalance. Okay? And an imbalance like this is very likely to be filled before we start moving into new highs.
So, with this demand zone still having imbalance, I'd be happy to use this for my buying opportunity. And we look beneath. There is no imbalance down here.
There is no area of demand down here. This again is an efficient range. So this here is the last inefficiency or the last imbalance left inside of this price move.
So our trade could go here with a buy limit. Stop could go under the zone and then our target could go up towards the new highs that we want to target for this trade. Let's just push it towards this supply zone here.
We can of course extend this out into larger swing trades. So we'll actually leave it like that. Yeah.
Right. So let's break this down real quick then. Number one, the first thing we did was on these higher time frame perspective, we identified demand zone here.
We didn't buy that because there was no confirmation. We identified a demand zone here. We also didn't buy this one again because there was no confirmation given.
And then the extreme demand, which is basically the last demand zone that exists. As you can see, there's no more demand zones before this down to around this level. I've actually accounted for just the smaller candle above as well, but we didn't have to do that.
That's just because I like to make sure I've got the full range covered. We see that this was retested and then following the retest, this push up here created a breaking structure which validates buys are likely to come into the market. Then we went down and took an isolated look at some lower time frame price action.
We can do this completely separately. This could be two trades because realistically with the retest we've just had here, we could have just placed a buy limit, right? But I'm trying to show you this across kind of multiple uh time frames or bigger picture and smaller picture view.
So again, we had the same push. We had a push which broke us into new highs. That creates a bullish leg of movement here.
We want to buy from this range. We have one two demand zones to choose from. We do not get confirmation from the first one and we're understanding there is imbalance still left which could lead the market into the next one.
And then when the market had reached into the next one, we looked at the break of structure, the push into an efficient range again. And now we can confidently choose this demand zone as the one to buy from. And we've avoided a loss by not buying here.
We've played it safe by waiting for the confirmation. And now we're getting into basically the safest possible trade. Okay, now we get a pullback, fill the demand zone, and then we get a drive to the upside.
And this market is taking its time, but we've now pretty much created a new bullish trend, right? We saw a drive up. We've pulled back down.
We found footing around here. Had we taken the profits at that supply zone, we'd be out already for around a three-hour trade. But given it the time it needed, it's actually taken a bit longer, but still follows through with that movement of taking us into new highs and providing an opportunity there for a good trade.
So that is the concept of using that entry model to avoid the inducement theory and make sure you don't get stopped out of trades that can be easily won. These are the results I got from trading these concepts last year and here are some wins from the past week from my students so you know to listen to me. This is a free course.
There's a link in the description to this. It's going to show you how to build systems, simplify trading, improve your trades, and ultimately find success. So, if you want to do that, 100% free.
I think you'll enjoy it and you know that I can provide you some value because it's working for myself and many other people as well. If you don't want to do that, watch this video next.