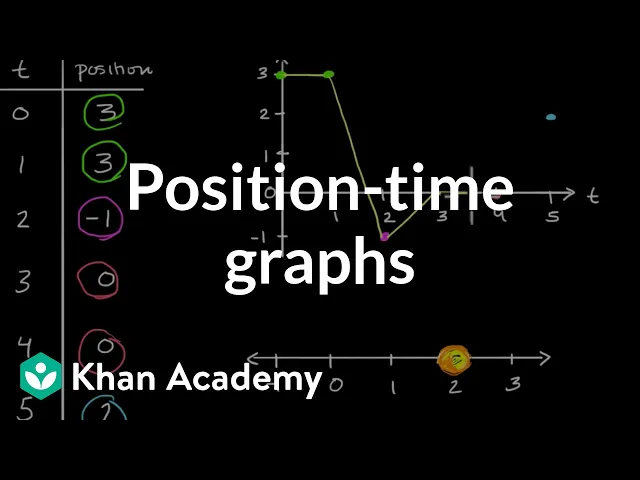
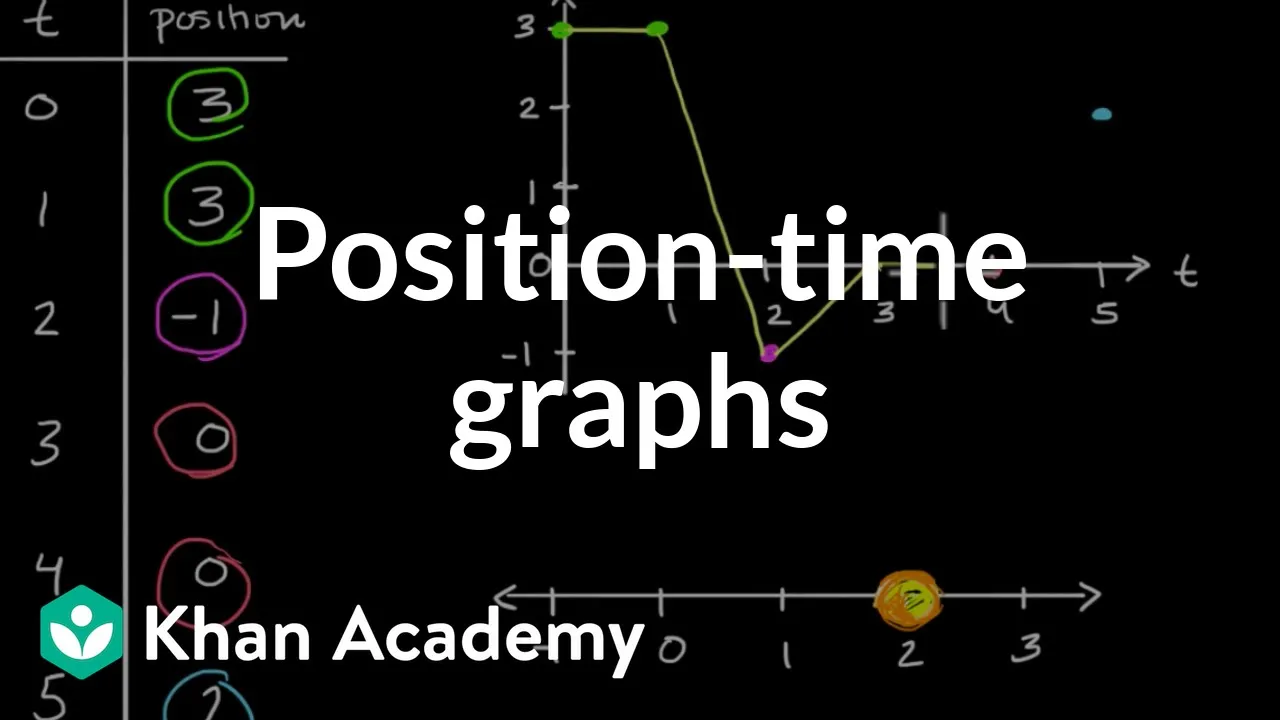
what we're going to do in this video is think about different ways to represent how position can change over time so one of the more basic ways is through a table for example right over here in the left column I have time maybe it's in seconds and in the right column I have position and this could be in some units let's say it's in meters so at Time Zero we're at three after 1 second we are still at three at 2 seconds we're at NE -1 then after 3 seconds we're at zero after 4 seconds
we're at zero still at zero after 5 Seconds we are at two maybe 2 meters now this is somewhat useful but it's a little bit difficult to visualize and it also doesn't tell us what's happening in between these moments What's happening at time half of a second did we just not move did our position just not change or did it change and then it get got back to where it originally was after 1 second we don't know when we look at a table like this but another way to think about it would be some type
of animation for example let's say we have our number line and let's say the object that's moving is a lemon and so at Time Zero it starts at position three so that's where it is right now and let's see if we can animate it I'm just going to try to count off 5 seconds and move the lemon accordingly to what we see on this position time table or time position table zero one 2 3 4 five so that was somewhat useful but maybe even more useful thing would be to graph this somehow so that we
don't have to keep looking at animation so that we can just look at with our eyes what happens over time so for that we can construct what's known as a position time graph typically time is on your horizontal axis and position is on your vertical axis so let's think about this a little bit so time equals z our position is at three so at Time Zero our position is at three and then at time equal 1 we're at three again at time two we are at 1 at time two our position is -1 at time
three our position is zero so our position is zero remember even though we're thinking about left right here here position is up down so here our position is zero at time three and then at time four our position is still zero and then at time five our position is at at two our position is at two so for the first second I don't have a change in position or at least that's what I assumed when I animated the lemon and then as I go from the first second to the second second my position went from
3 to1 from 3 to 1 and if we do that at a constant rate we would have a line that looks something like this I'm trying to that's supposed to be a straight line and then from time 2 to 3 we go from position -1 to 0 from -1 to 0 here it would have been going from negative 1 to zero moving one to the right but over here since we're plotting our position on the vertical axis it looks like we went up but this is really just going from position1 to position Zero from time
2 seconds to 3 seconds now from three to four at least the way I depicted it our position does not change and then from time four to 5 our position goes from 0 to two from 0 to two and so what I have constructed Here is known as a position time graph and from this without an animation you can immediately get an understanding of how the thing's position has changed over time so let's do the animation one more time and just try to follow along on the position time graph and maybe I'll slow it down
a little bit so over the first second we're going to be stationary so we could just count off one Mississippi and then we go to our position goes to negative one over the next second so then we would go to Mississippi and then we would go three Mississippi four Mississippi and then five Mississippi but hopefully you get an appreciation that this is just a way of immediately glancing and seeing what's happening