i'm going to teach you exactly how to make $100 to $500 every single day consistently even if you're a beginner day trader My name is Emanuel I'm a 25-year-old 7figure day trader And I'm going to show you a no no fluff guide on how to scalp And scalping is one of my favorite and primary strategies that I use every single day over the past 5 years to be a consistently profitable trader There is a lot of education on the internet and on YouTube trying to teach you how to scalp but no one does it quite
like I do And I'm going to show you exactly what I look at in order to have precise entries and precise exits in the market all through scalping By the end of this video you'll know exactly what to look at in order to scalp and you'll be able to implement this information as soon as tomorrow Let's not waste any more time and let's hop right into the video So these are my statements from Charles Schwab I use Think or Swim platform every single day And in February last month I made $68,955 And the reason I'm
showing you this is to be as transparent as humanly possible If I'm going to be teaching you how to trade it's important for you to understand that I actually make money doing this and that I do this for a living and I have been over the past 5 years So I've included my statements which shows my withdrawals my cash activity my ending balance and all that great stuff So February was a really good month January was an even better month I finished with $73,656 December $53,51 Uh November $77,571 That was an amazing month That was
actually uh when Trump got elected So ended up being really really good in October $15,036 And this was one of my slowest months in quite a long time partly because I was in Italy for half the month For anyone who doesn't know me my dad actually taught me how to trade I would highly recommend watching the interview with my dad It explains our journey but I haven't had a losing month in close to 5 years And it's all because my father taught me how to trade correctly from the very beginning Now it's not just me
who is making money with scalping and day trading My students have been absolutely killing it I've been able to coach and scale countless traders from zero to 50,000 plus per month with trading like Josh who by the way I did an interview with So you could actually watch a lot of my student interviews in my free 10 plus hour course You could find that in the description of this video And you could watch this interview of him explaining his trading journey But he went from zero to $95,000 in trading profits in only four months after
starting to learn how to trade And he ended up finishing 2024 with $110,000 in profits And it was all in a matter of of about 4 months I would highly recommend watching his student interview We have Brad who essentially is now making anywhere between $400 to $1,000 every single day through scalping and trading with me daily And he's a 63 year old gentleman who actually recently retired from his real estate brokerage business And I got this text just a few weeks ago where he made 5,000 in a single day He was up over $21,000 for
the month The previous month he made 17,000 So unbelievable results And Brad is a scalper He really picked up scalping extremely quickly and was able to profit as a result I also highly recommend watching his student interview in my free course or on my other YouTube channel Then we have Yuri who a lot of you guys probably know He is 19 years old or maybe even not Maybe I think he's 18 I got to ask him but 18 years old Definitely watch his interview Extremely interesting journey He ended up finishing with $155,000 in four and
a half months after learning how to trade And he is also an expert scalper This is how he makes a majority of his money And he actually bought a Corvette which is insane considering he's like 18 or 19 years old Absolutely insane results But these are the results that you can get if you learn how to trade the right way and if you can master scalping So let's get right into it and understand exactly what scalping is and exactly what we look at And we look at level two orderflow This tool right here looks super
complicated looks super overwhelming with random numbers but it is number one extremely simple to understand You'll understand it right after you finish this video and you'll see how simple it is But it's also one of the most powerful tools that you can use in trading And I just don't see that many trader traders use it And I don't know why It's unbelievably powerful if you learn how to read it correctly And that's what I'm about to teach you How to actually read it and how to use it to take advantage of your trades So before
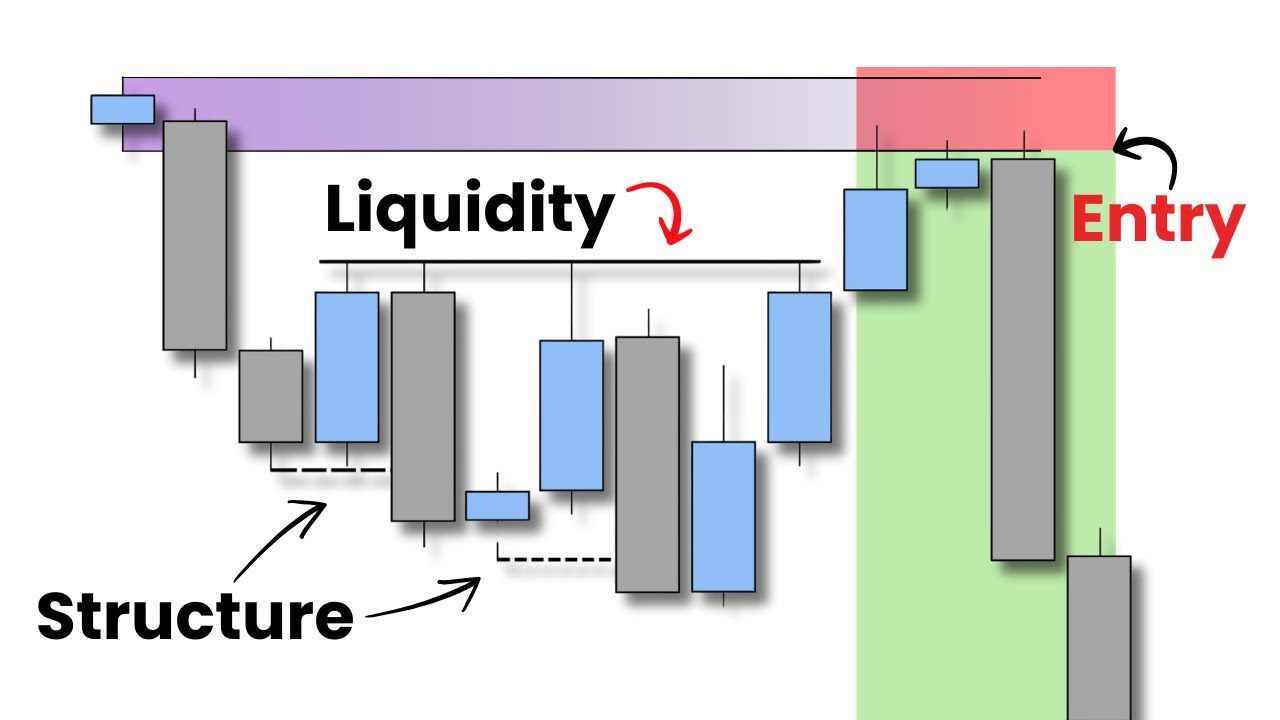
we try to understand exactly what this means first let's talk about a couple of requirements The first requirement that you need in order to do level two scalping is you need to be trading a stock that has a catalyst or that has clear momentum And for us you know when we live trade we focus on gapping stocks Now what is a gapping stock Simply put this is a stock that has an overnight change in price So let's look at this example right This stock closed at around 550 the previous day and then the next day
it opened at around call it 480 Right So this was an overnight change in price You could literally see the gap on the chart You see this how it changed in price overnight and the next day it opened at a lower price And because of this gap well it created a ton of momentum for this stock and it ended up moving all the way down to $3.50 So I like to trade gapping stocks because they have a ton of momentum and I usually trade in the direction of the gap So this stock gapped down My
bias is to look to go short on it And I actually remember trading it this day It was an unbelievable trade and it trapped all of the buyers who bought it the previous day All these buyers thought this was the bottom They got in The next day it gapped down against them Now they're all underwater and now there's a ton of uh pressure for them to sell and cut their losses This is another example where it closed at around 475 or so and then the next day it opened at around 4:15 and this gap you
know gave the stock momentum and that's what caused it to drop during this day and I also caught an amazing setup on this stock So we like to trade stocks that have a catalyst usually a gap right The gap acts like a catalyst And these gaps can occur because of news because of earnings because of events within the company Could be a whole you know a lot of different reasons We don't really care why it's gapping We just care that it is gapping And the gap is a catalyst and it gives the stock momentum That's
why we trade gaps All right And keep in mind we like to go in the direction of the gap not against it So here's another example where the previous day it closed at around 2510 The next day it opened at around 29.50 and this ended up getting sold and then there was a nice little retracement setup right here that if you took you were able to capitalize on the move higher and this stock obviously moved a ton relative to the other days because it was gapping The gap was the catalyst and we like to go
in the direction of the gap not against it Now you don't only need to trade gapping stocks but when it comes to scalping you want to make sure that you're trading stocks that are moving that have momentum that have a very clear either uptrend or downtrend It's very difficult to scalp sideways stocks You need it to have momentum You want it to be moving in a direction You want it to almost feel like unstoppable It just keeps moving in that direction And those are the best stocks to scalp right The ones that are trending I
like to go I like to trade with the trend not against it Why would I go against the trend right The trend is your friend It's a cliche but it's a thousand% true Trade with the trend That's why I trade in the direction of the gapping stock So if it gaps down my bias is to go short If it gaps up my bias is to go long Now there are exceptions However that's going to be a general rule for this video We want to be trading stocks that have momentum Next requirement that we're looking at
the stock needs to be highly liquid with high volume At least 2 to three million shares traded per day So you could go and check the average that that stock trades right Is it trading on average 500,000 shares a day or a million shares a day or 10 million shares per day And you want to be trading stocks that are doing volume that have high liquidity High liquidity means there's tons of buyers and sellers that are getting in and out of the stock And liquidity is essentially how easy we can get into that trade without
incurring slippage If it's not very liquid well if you exit the trade right and you have a ton of size it could impact what price the like the trade exits you at You want to be trading stocks that are highly liquid when it comes to scalping And a great way to know that it's highly liquid is to look at the volume Liquidity and volume are correlated right So if it's doing at least 2 to 3 million in volume per day on average that's fine Ideally you could trade something that's doing 10 million plus in volume
Those are the most liquid Those are the best ones to scalp Now I'm also going to include that the prices of the stocks that you're probably going to be scalping are going to be under $20 Okay this this is a strategy more for lowerriced than midcap stocks All right but usually it's going to be under $20 There are exceptions where we do scalp stocks over $20 but it's kind of rare And yeah this is kind of the go-to under $20 stocks even under $10 stocks at times Sometimes I even scalp penny stocks stocks under a
dollar like legit penny stocks using level two So high liquidity high volume Check how many shares it's trading Make sure it's doing good volume And that's another requirement that you need in order to scalp Next it must have a setup Now what are the setups that we trade Well if you have done my free 10 plus hour course you learned about a lot of these setups which if you want to watch it's in the description of this video You can join my free course and my free community and you could watch in my opinion one
of the if not the best free course on the internet It is genuinely better than most paid courses on the internet All right It's 100% free Check it out But essentially the setups that we trade are really simple We trade retracements right whether that's to the upside or we we can also short retracements when we go short right And we also trade breakouts or breakdowns So we have a move up we base and we could trade the breakout or the opposite we have a move down we base and we could trade the breakdown Okay So
we can trade the breakout or the breakdown Move up base uh then breakout move down consolidate then break down Right This is essentially the only strategies we trade I trade They're very very simple and I you know it's like that for a reason I keep my trading as simple as possible That's what allows me to make money consistently because I keep it simple right I'm not using fancy indicators either We'll get into um what kind of tools that I use besides level two in a second here but this is essentially the strategies that I trade
right So you combine the fact that it has a gap right remember has a gap has a catalyst right And then we need a setup right So if you take this stock right here we had a gap down That was the catalyst for it to move lower From here we go to the smaller time frames and we find a setup right So what's the setup here Well we dropped we consolidated and we got a breakdown right So that was the setup We could also look at this example Remember this gap down Well the the gap
set the bias for what that stock is going to do Then we go to the lower time frames I think this was the uh 15minute chart All right let me make sure Let me put make this white or Okay we move down We have a base and then we have a breakdown Right so these are the setups that we're applying on the gaps The gap sets the bias and from there we need a setup And I kind of just you know showed you guys the setups that we trade retracement or breakouts or breakdowns Please learn
about them in my free course right And then you can come back to this video or you could just finish this video and go to my free course after Okay But we need to have a setup in order to scalp We don't want to do it randomly Sometimes I do kind of hop into trades a little bit more randomly I don't there's not a picture perfect setup but for now if you're a beginner stick to having good setups and stick to having good gaps Next we have tight spread And we want to have 1 cent
spread for stocks above $1 So what is spread And this is something that's going to seem super kind of complicated but it really isn't Spread is super super simple And this is when we're actually going to begin analyzing the level two and what the level two is All righty So let's go ahead and begin Okay So when looking at the level two we have something called the bid and we have something called the offer And you have the bid price and then you have the offer price Then you have something called BS and AS BS
is bid size AS is ask size So this is essentially you know the size on the bid and you can think of these numbers as buying pressure and you can think of these numbers as selling pressure So the greater the numbers are on the bid size the greater the buying pressure The greater the numbers on the ask size the greater the selling pressure So what is the bid and what is the ask or the offer The bid is the best price the buyers are willing to buy at In this case it's at 107 They're not
ready or they don't want to buy anything So what is the bid and what is the ask The bid is the best price the buyers are willing to buy at So in this case the the best price the buyers want So what is the bid and the ask The bid is the best price the buyers are willing to buy at And the ask or the offer is the best price the sellers are willing to sell at Right So the bid here is 107 The ask here is 108 Now spread is the difference between the ask
and the bid Right So what's the difference between 108 and 107 Well 108 minus 107 is 01 And that is the spread for this stock Now as scalpers we only want to be trading stocks that have 1 cent spread right That's really what I need you to take away if you don't quite understand the bid or the offer exactly how it works the exact kind of like details of it It's kind of like an auction almost but you don't even need to understand that What you really need to understand is that the bid size represents
buying pressure The ask size represents selling pressure And the difference between the bid and the offer is spread And we always want to be trading stocks that have 1 cent spread spread especially if they're stocks trading above a dollar right And those are most of the stocks that we're going to be trading It can only have one cent spread This is actually the minimum spread you could have on stocks above a dollar but it's also the maximum that we want in order to scalp All right Now how does this make sense Like why is spread
important in the first place Well let's think about it Let's say I want to buy 1,000 shares Okay When I buy 1,000 shares who do I buy from At what prices do I get filled Like where is my average price going to be if I buy a,000 shares Well let's think about it If I buy a,000 shares who am I buying from Well I'm buying from the sellers that are represented on the ask So if I buy a,000 shares I'm going to buy it from the sellers at 108 Now let's say prices don't move and
I decide to sell and I sell my 1,000 shares All right Well where am I going to get filled if I sell Who am I selling it to I'm selling it to the buyers And the buyers are on the bid The bid represents the buyer So if I sell a,000 shares and the price doesn't move I'm going to get filled at 107 Now how much money do I lose Well I got filled 1,000 shares at 108 I sold it at 107 So I lost one penny Now what's one penny One penny is not only how
much I lost One penny is what the spread is for this stock And this is why we want to trade stocks that have very low amounts of spread So one penny on a thousand shares is around $10 Now that's not a lot but if I have 10,000 shares one cent spread right I would lose $100 So you could see you know the huge implications of spread Now hypothetically let's say instead of the offer being at 108 the offer was at 113 and I bought it right Where would I get filled I wouldn't get filled at
108 If I buy it I'm buying it from the sellers I would get filled a,000 shares at 113 Now let's say prices don't move and I sell Well who am I selling to I'm selling to the buyers at 107 So I would lose on that trade around 6 cents because that is what the spread is 113US 107 is 6 cents Whenever I enter into a trade I am automatically down what the spread is And that's exactly why we want extremely low spread with our trades So that is a requirement for us We want tight spread
If the stock is above $1 the maximum spread there could be is 1 cent So what you would do is you would go to the offer You would go to the bid right We can go and check it out And we would find the difference What's the difference between the offer which is at 108 and the bid which is at 107 If it's 1 cent spread good That's exactly what you're looking for Next the stock cannot be jumpy or flippy In other words the stock cannot be moving multiple cents at a time extremely quickly You
want the stock that you're trading to be moving in a controlled way that is extremely predictable You want the stock to respect level two And that's going to make sense as soon as you guys watch the live trade that I'm going to show you at the end of this video But just keep in mind when you are analyzing a stock and you're you know trying to determine if you want to trade it or not or if you want to scalp it or not look at how it's moving Make sure it's not you know sporadic Make
sure it's not fluctuating like crazy moving 5 10 cents at a time You want it to be moving in a very predictable way Maybe 1 2 3 cents at a time You don't want it to be jumpy and all over the place Next trade in the direction of the trend Right So I mean it's just a cliche right Trend is your friend Always trade in the direction of the trend Why would you trade against the trend The trend is telling you what it's doing If it's an uptrend your bias should be to go long If
it's a downtrend your bias is to go short And in this case in other words you should trade in the direction of the gap If it's gapping down 90% of the time you're going to look to go short If it's gapping up 90% of the time you're going to be looking to go long So always trade in the direction of the trend when you are scalping next Must have a clear imbalance on the level two I'm going to discuss this in just a second but first I'm going to go over not extended ideally near rising
or declining 20 MA So if you've gone through my free 10 plus hour course you know how to use the 20 MA So I would just watch my free course to learn about it But we can go back to the examples here right Check this out This stock when it was basing it consolidated directly kind of into this declining 20 MA There's a little bit of distance but essentially it's very much near the 20 MA Whenever you're trading or scalping you always want prices to be at or near the 20 period moving average This is
just a picture perfect example Like check this out We dropped we consolidated and as soon as we touched a 20 period moving average we dropped This is exactly what we're looking for And if you're let's say potentially trading like a retracement setup in that case you get a move higher Let's say you begin to retrace you would want to see the moving average like this And then you would look to go long near that rising 20 MA And you could take advantage of the next move up I would just watch my free course Honestly this
will teach you how to use the 20 period moving average But you want to be entering or you want to be entering near the either rising 20 MA or the declining 20MA depending if you're going long or short If you're going long you want it to be rising or if you're going short you want it to be declining All right Very very good Next let's go back to the imbalance on the level two So what is an imbalance Okay So let's take let's take a look at this and let's analyze very carefully what's happening on
this level two right here Well what is the bid It's at 305 What is the offer It's at 306 Is there spread Well yeah but there's one penny spread which is the minimum spread that you're going to have for a a stock above a dollar It's also the maximum spread that we could allow right So one cent spread Perfect Great Now remember how we talked about the bid size and the ask size This represents buying pressure This represents selling pressure right So if you're looking at these numbers just logically is there an imbalance between the
buying pressure and the selling pressure Well this is the bid size This is the ask size So as you can see there is significantly less buying pressure than there is selling pressure I mean number one you have 1 2 3 4 5 six bids versus 1 2 3 4 5 6 7 8 9 10 11 12 13 offers Not only that the amount of size that you have on the offer is significant compared to the bid This is what you call an imbalance And if there's significantly more selling pressure than buying pressure right So there's
more selling pressure at 306 then buying pressure at 305 This tells me prices are likely to go lower That should be logical right And this EX stands for exchange So these are just all the exchanges that the orders are coming in at All right You don't really have to worry about that honestly for level two trading Ignore this It's really not important What you really need to be looking at is the bid size the ask size the amount of bids and the amount of offers and the and whether there's an imbalance And in this case
there absolutely is an imbalance You there's way more selling pressure than buying pressure right That's what we're looking for In this case I would look to go short Now here is another really really good example right Let me bring this a little closer Check this out If we look very closely at $3 is there an imbalance on the bid versus the offer Well the offer is extremely strong but the bid is pretty strong as well but we have significantly more offers right If you count you know every kind of rectangle here what we have like
probably 12 13 offers versus only 1 2 3 4 5 6 seven on the bid So the bid is strong but it's you know weaker than the offer There's still more selling pressure than the bid There's still an imbalance So what I would do here is wait for this buying pressure to weaken And that's exactly what happens I wait for this to happen where this buying pressure turned into this buying pressure And as that's weakening and as that's happening as this buying pressure is going down that's when I go short I short it as the
buying pressure is weakening And notice that the offer it almost even got stronger The selling pressure increased while the buying pressure compared to here decreased And this is the same stock This was the same sequence right You could see the buying pressure here buying pressure here You could see how much it weakened right And as it's weakening I'm going short And on the offer here you see there's a ton of selling pressure here and here And the selling pressure actually increased And the amount of offers remain the same All righty So this is this is
essentially what we look at when we do level two trading We look at the imbalances between the bid and the offer and we also look at the amount of bids and the amount of offers available So as a general rule if the buying pressure right buying pressure is weakening where does it weaken On the bid our bias is to go short Assuming that the offer is extremely strong assuming we have an imbalance right And the opposite applies if you're going long Let's say the selling pressure right selling pressure and let me make sure I move
the screen The selling pressure right Selling P is on the ask right Now let's say the selling pressure is weakening on the offer right And the buying pressure on the bid is very strong Our job or our bias is to go long And we need an imbalance If we want to go short we need an ex we need a lot of selling pressure and weak buying pressure right If we're going long we need tons of buying pressure and weak selling pressure right So if I was to go long this would have to be reversed This
would have to be very strong at $3 and very weak at 301 And then I would my bias would be to go long And of course we combine this with everything We combine this with the gap We combine this with having a really really good setup We combine this with high liquidity We combine this with tight spread We don't want it to be jumpy We want to be trading in the direction of the trend We need a clear imbalance We need a consistent clear imbalance where it's dropping and there's a constant imbalance between the selling
pressure and the buying pressure All right Now this all is a lot of information probably a little bit overwhelming Let's look at a live example and we'll analyze exactly how this works on a reall life trade All righty Let's look at this live trade that I was able to capture just a few weeks ago And this ended up being an actual massive winner for me I made a little bit over I think $3,100 on this trade But the first thing we're going to do is we're going to look at exactly what the setup is And
we're going to be looking at in this case the fiveinut time frame Okay so this is the five-minute chart So actually before we even do that is there a catalyst Is there a gap Well if you look at the daily chart it's kind of hard to read but you can see that this stock gapped down underneath support which perfect I know what the catalyst is I know what the bias is My bias is to go short because it was a really bearish gap down That's exactly what I need to know Perfect From there I go
to the smaller time frames the fiveminut chart We dropped then we kind of like retraced attempted to move lower based a little bit and then we started to kind of retrace back up And check this out This is a consolidation or almost like a retracement and consolidation It's like a sell setup and a breakdown We dropped we moved up we based and right here under the base we had a really nice breakdown And this started to move lower And I was in the trade I actually I remember uh my computer or my internet was out
this day And as soon as my internet came back I logged on This was the first trade that I saw So I hopped in a little bit late I think at around 93 cents somewhere around here Yeah my average price was 293 Okay but anyway is there a gap Is there a catalyst Yes Is this highly liquid Absolutely This actually was doing I think it did like 20 almost 20 million shares that day So it was highly liquid Perfect Um so we we know the catalyst there was a gap It was highly liquid Is there
a setup Absolutely It's a breakdown Perfect Is there a low spread Well the bid is at 289 The offer is at 290 So yeah there was only 1 cent spread which is perfect Next is there an imbalance between the bid and the offer Well this is the bid at 289 This is the offer at 290 We do have some buying at 289 However we have a significant amount of selling at 290 There's way more selling pressure at 290 than at $289 on the bid And that's why I'm in it short I had 20,000 shares at
the time and I was already up around $750 Now I'm going to go ahead and kind of fast forward and find the exact moment where the bid began to weaken And I really want to highlight that point Okay so watch this extremely closely You're literally about to see the bid weaken significantly before it drops from 289 on the bid to 288 on the bid And of course the offer is going to go from 290 to 289 So watch this happen Ready It's going to weaken on the bid right It's going to happen any moment here
Right there You see how the bid just weakened significantly All of that buying pressure got sold and now there's almost no buying pressure at all and there's only one bid compared to a massive amount of selling pressure and tons of offers Let's resume There's literally I'm literally pointing to it as I'm recording this trade There was literally no buying pressure at all And there it dropped from 289 to 288 Now let's kind of reanalyze here The offer is still extremely strong and the bid is kind of strong but it's you know way weaker than the
than the offer The buying pressure is weaker than the selling pressure So now I'm waiting for the buying pressure to weaken before you know I'm going to be confident that prices go lower And keep in mind guys I'm going to pause it that the overall trend is lower That's why I'm so aggressive going short You look at the um gap it's a daily gap down You look it's it's a breakdown Look at the one minute chart It's such a beautiful breakdown Look at how well it's respecting the 20 MA on the one minute chart And
the same thing applied to the two-minute here You guys can't see it but the one minute chart was beautiful right Look at how well this downtrend is respecting the 20 MA The fivem minute looks lower It's just a picture perfect setup You have multiple time frame alignment You have a bearish gap really nice downtrend and the level two is perfect So let's go ahead and kind of fast forward to when 288 begins to weaken and it actually moves lower Okay so watch the bid and notice how it's weakening Did you guys just see that How
the bid literally weakened all the way to now only two bids and almost no buying pressure at all and it's about to break 288 and actually move lower to 287 And right there boom it just dropped to 287 And feel free to kind of pause and go back but you can literally see that all of the buying is getting sold and it drops And if we reanalyze well 287 is still extremely weak and we still have a really strong offer The selling pressure is tremendous The imbalance is very consistent between the offer and the bid
And you could see right here the bid weakening Look how weak it is So this is likely to continue lower and it's about to drop from 287 to 286 This is just a picture perfect imbalance where the selling pressure is significantly stronger than the buying pressure and that's why I'm still in it short and why it just dropped to 286 I fast forwarded a bit but now 286 still almost no buying pressure Tons of selling pressure on the offer Clear imbalance So prices are likely to continue lower And it just dropped to 285 Look at
285 how it's weakening And that's where we got the multiple cent move lower where it dropped literally from 286 all the way to now 281 on the bid 282 on the offer And I have 20,000 shares I had 20K at the time Every cent is 200 bucks right So the profits add up And crazy enough this stock continued lower The bid is still super super weak compared to the offer That's really really strong The imbalance is clear There's still way more selling pressure than buying pressure And look at what's about to happen It's going to
drop from 280 And by the way I'm I'm trying to go short I'm trying to short this because there's no buying And I can see there's tons of selling So I'm trying to go with the trend I'm I'm trying to even add to my position and get back in right And look 79 is about to weaken And it's likely to go to 78 and lower as well And there it goes to 78 There it goes to 77 still super weak at 77 compared to 78 Still tons of selling pressure compared to buying pressure So it's
still likely to continue lower And as you can see almost no buying pressure And it's probably about to go to 276 I believe Should be any moment now You could see there's still no buying pressure Tons of selling pressure It's almost It's just obvious what it's going to do It's obvious that it's about to drop And that's exactly why I'm shorting it and I'm so aggressive right So let's see when it actually happens from 277 We're waiting We're waiting And when I was in this trade I was also like telling all my students that this
thing is going to drop It's so obvious that it's going to drop And of course um it did And you're about to see that All right So I'm pretty sure this is when it happens But 277 still weak on the bid And watch what happens And there it just dropped like what three four pennies and I started taking profits because at this point it was down so much I made a lot of money and I started aggressively taking profits and that was the move and that made me $3,100 being able to combine all of the
factors that we just talked about Really bearish gap tight spread picture perfect chart setup on the smaller time frames nice breakdown on the five really nice downtrend on the one minute chart very clear imbalance on the level two highly liquid This thing did like 20 million shares that day So we combined everything that we just learned into a high probability setup which made me over $3,000 If you found this super valuable make sure you subscribe to the channel for more trading education for more lifestyle and my goal is to ultimately show you the raw reality
of being a full-time day trader Make sure you also check out my free 10 plus hour trading course in the description of this video And if you guys are interested in live trading with me every single day and having me personally mentor you personally coach you and scale you to 10 to $50,000 a month plus with trading Feel free to apply for my mentorship It's a highly selective program I guarantee results I work with you until you're consistently profitable So apply and please put detail in the application I cancel about 77% of the applications that
I get because I only want students that have a high probability of success because ultimately I work with you until you're consistently profitable


![How To START Day Trading As A Beginner in 2025 [Full 30 Day Tutorial]](https://img.youtube.com/vi/CaI5SvAB5_g/maxresdefault.jpg)