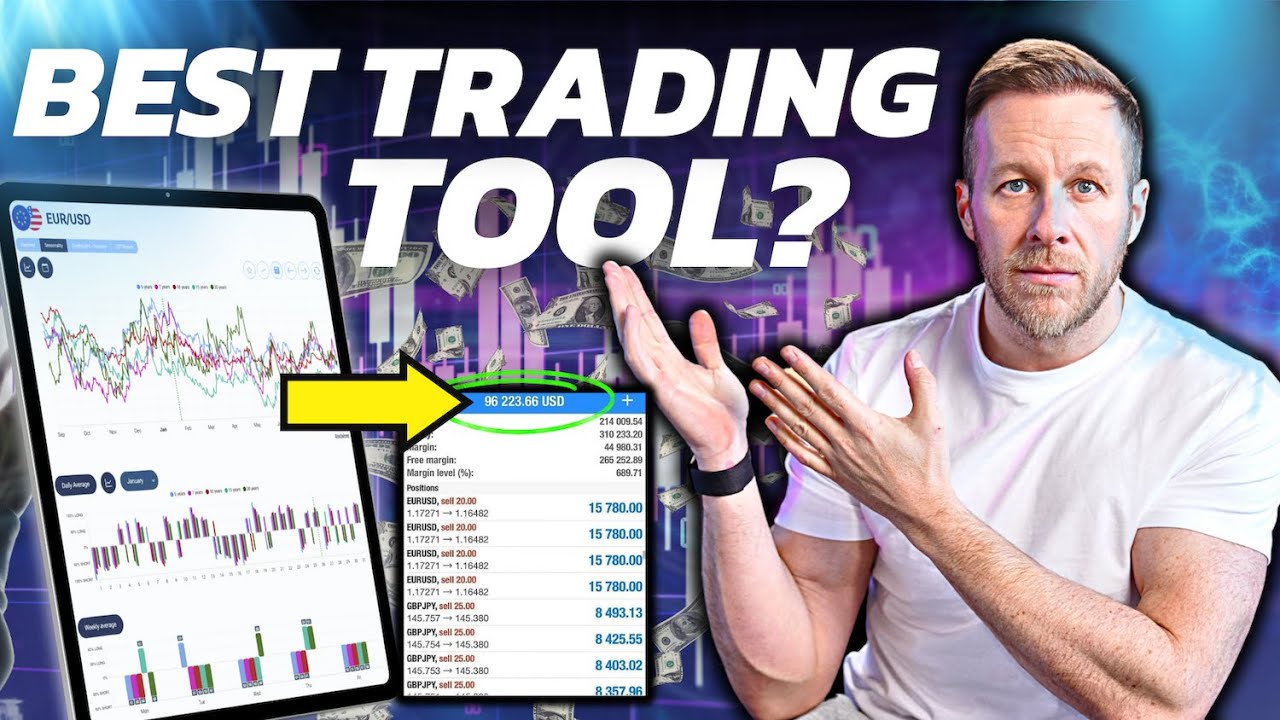
in this video I'm going to share with you a very simple yet very very powerful process in order to predict the highest probability moves in any Market the tool that I'm about to share with you will give you an edge no matter what Market you're looking to invest in or trade and if you watch my previous video on how to have an edge as a Trader this is going to be the next step for you this is going to show you how to apply that edge to any market so let's get stuck in all right so if you're familiar with my style of investing you know I use screeners all the time we're going to be using the brand new forecaster quantum screener for this particular video and the reason being is cuz this new feature is going to be a game Cher for you you know if you're investing in stocks you need to understand financial statements quantitative analysis qualitative analysis you need to understand how to build a story around a good entry and then you need to ideally time the best place to get in and get out if you're trading them well this is going to remove all that for you and this is actually going to give you the highest probability of when to get in and when to get out so let's Dive In first of all you can see the brand new Quantum screen at all here what this actually does is it compares seasonality to actual current price action and then it will give you a correlation score based on the previous historic data to tell you when is the highest probability to get in and out of any different market so let me show you an example all right so let's just go down to indexes for instance and I'm just going to pick one of these indexes here so let's just say uh the footsy MIB index here right so you can see that it's got an 8. 62% correlation score over the last 25 years with a 64% win rate average return between this period and this period would be a 6. 3% return but let's click and dig a little bit deeper to show you some more insights here the way we can tighten up that score right so this is the period that it's selected but if we just drill down to the best possible move from today until the uh 22nd or 21st of September at the time of this recording now you can see the correlation scores 81% right which is great um if we go short you can see we've got an edge here right so an average return would be a 4.
4% return uh and that's 60% correlation over the last 25 years but what's really interesting is if we go down to the daily average you can see that on what's today today is the 9th you can see that on the 12th we have a 57% correlation so over the last 25 years 57% of the time has been short on the 12th day and if we go down to the weekly you can see that we've got a 57% short on Thursday so we can actually drill down and develop an edge on a market like this knowing that if we just went short every Thursday on the 12th day of the month over time we would be profitable and if you go and check out my last video on how to have an edge in trading you'll know how powerful that stuff can be let's just take a look at another example here and we'll go to a Forex market so if I go to the Forex Market you'll see that the dollar Yen here has a 94. 9% correlation over 25 years so if we click on this one and obviously if you look at the correlation chart here and you can you can drill out all the seasonalities on this if you haven't seen my video on seasonality using this Tool uh you can go and check that out as well but if we drill down down on this let's just say that we pick uh the next month right so we're going from mid early September to Mid October end of October time um you can see we've got n 94. 9% long there a 60% correlation over 25 years with a 2.