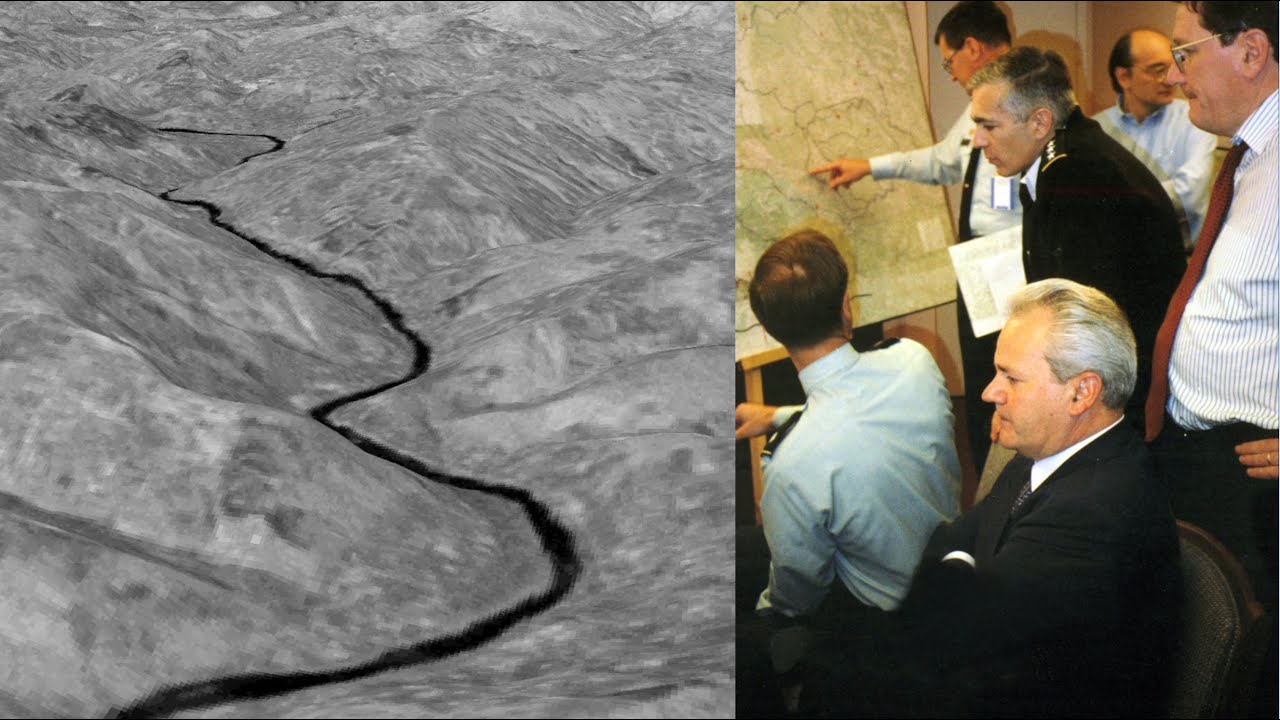
You need to know what's happening on the earth in a spatially continuous way, and how this varies over time. Both of those are provided by geospatial technologies. When you're making decisions you can't just take anecdotal information.
You need quantified, explicit information which really will let you determine is this bad or is it really bad? So that we don’t over-respond and we don’t ignore a real problem. Maps bring knowledge.
Maps bring understanding. And the hope is that the knowledge and understanding bring better judgment. [Water dripping] I am an earth scientist.
I want to know how the earth works. That’s what mapping is ultimately telling us - where things are, how they’re related, how it’s put together to tell us the story of what really is happening. Geospatial technology is a fundamental tool if we hope to understand what's happening on the planet.
Especially in the study of climate, where we have data and we need to study many things simultaneously. At NASA we take the geospatial data and observations of the earth, like the vegetation index and rainfall, and the observations of the atmosphere and we incorporate them into models. Suppose you’ve got a two-mile thick, one continent-wide piece of ice - that’s called Greenland.
Is that ice getting bigger or smaller? What’s happening? Satellites are watching how fast the ice goes over time.
And you collect all these data sets and you slap them onto a map. And then you can start to say this place is thickening. This place is thinning.
This place is dumping icebergs faster. So with repeated satellite data you can tell - are things are things changing, and if they're changing, why are they changing? We know that humans are changing the atmosphere - we know the temperature is going up.
How do we know if our CO2 is actually causing the warming? If you turn up the sun, you add energy everywhere and it warms everywhere. If you turn up CO2, it holds the heat down here and way up there at the top of the stratosphere it cools.
The map of it is different. You can see it. If we cut down forests, 200 or 300 years of carbon is then liberated to the atmosphere.
By combining satellite data with data from lasers to tell the heighth – it’s very easy to study deforestation from space. As climate changes, we need to be able to know what the extent of those changes are, and only through looking through time can we determine how these things impact our day to day lives. There are a billion hungry people in the world.
Geospatial technology plays a crucial role in helping us make good decisions about where food aid goes, to whom it goes, and how much is sent. When there's a food shortage citizens become desperate to feed their families. When that sustenance is not provided there's a potential of conflict that can elevate to military conflict, as well as increase potential terrorism.
The foreign agricultural service works hand in hand with our sister agencies - the state department, USAID, FEWS NET, NASA to monitor crop production worldwide. We link satellite imagery with ground observations and rainfall data to determine the impact of drought on plant productivity. And what we’re talking about is photosynthesis.
Green leaves absorb in the red and blue region of the spectrum very strongly, and more is reflected in the green. Satellite data shows quantitatively how much energy from the sun is being absorbed by green leaves. We can then determine risk for food insecurity.
We can watch the plants from space using the daily imagery as the growing season progresses. That’s really important in places that we can’t go to. In 2005, Zimbabwe, which had a lot of political issues, produced far less food than it usually did.
On top of that came a drought. Something really needed to be done, but we didn't have any good ground information to know exactly how much assistance should be offered. Using the vegetation index, and productivity in previous years we were able to determine that food aid was really going to be needed for about 6 or 8 million people.
So we gave them enough advance notice to get foodstuffs imported and disseminate it amongst the populous. In the end it’s about people and the hunger of people on the ground. And what can we do to respond to that.
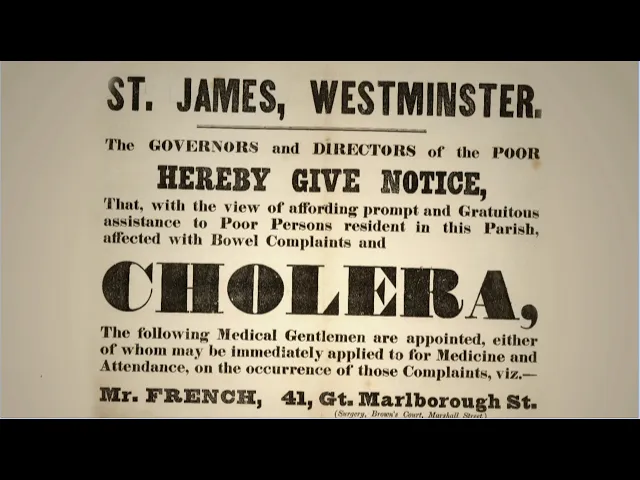
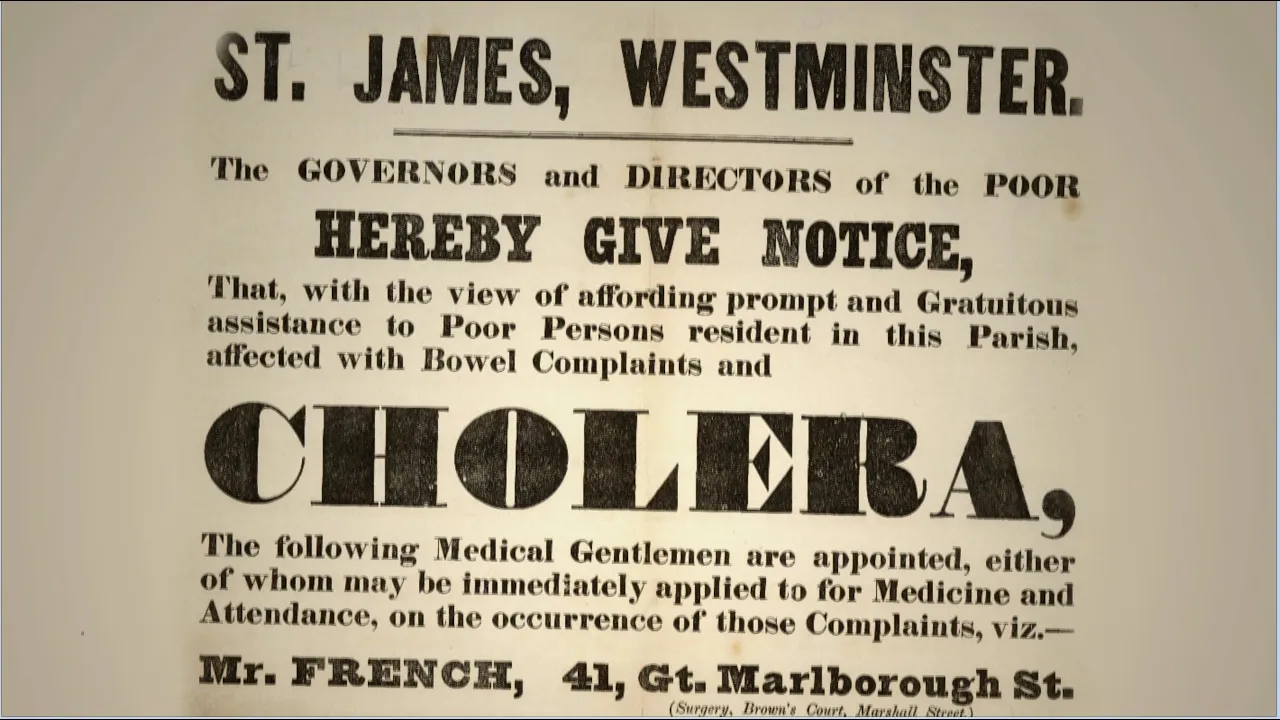
Interestingly enough, disease tracking has been in existence for hundreds of years. During the cholera outbreak in London in 1854, a doctor named John Snow started mapping out cholera deaths. Cholera is a devastating disease, it can work amazingly fast, you can be well in the morning and you can be near death by the evening.
People didn't really know what was causing the death. And so he went around to every household and started to record how many deaths they had, and then he asked the people in the households where they got their drinking water. And in those days water all came from hand pumps.
He started a map that said here’s the wells, here's the households where people were dying. Putting this representation down on a map is what I believe is a very interesting story. And you see this pattern of cholera death spreading out from the Broad Street pump.
He was able to show by the location of the deaths in relation to the water pump that it was almost certainly waterborne. He went to the health board and he said we need to remove the pump handles, and sure enough Cholera deaths started to decline in these neighborhoods. Snow was able to affect public policy by convincing people by the simple method of his map.
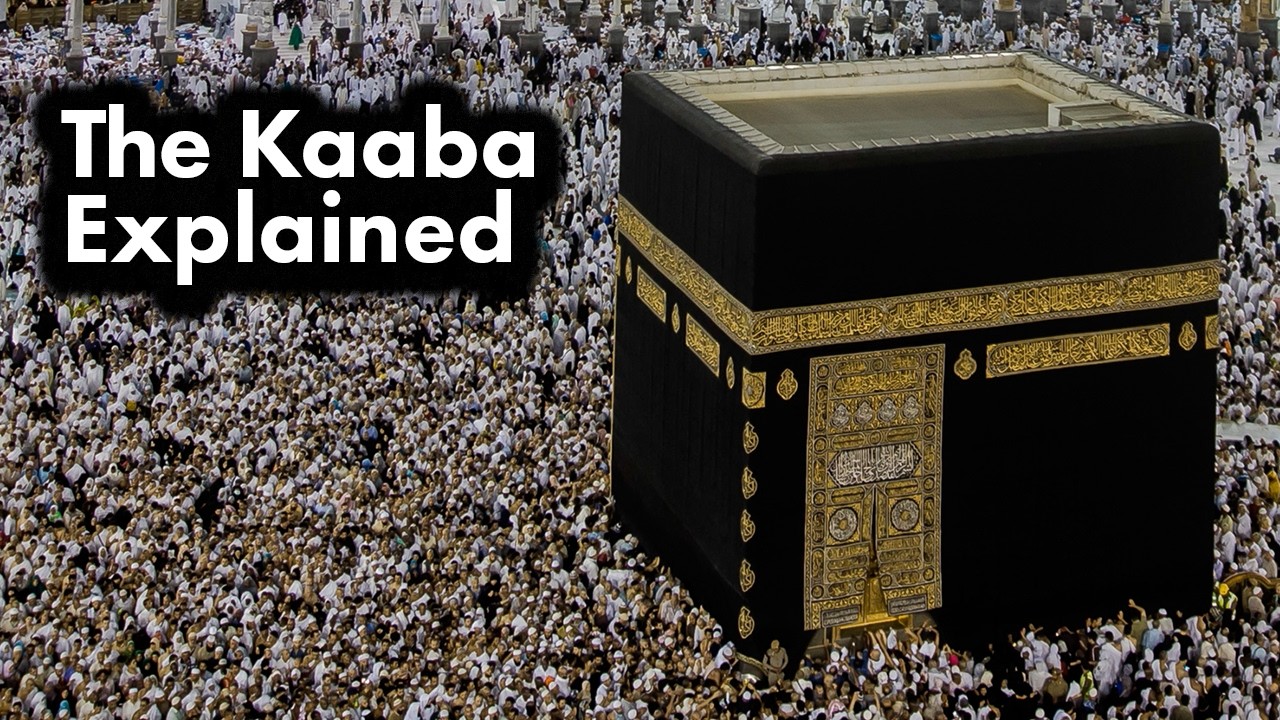
What John Snow did in 1854, still happens today. We’re looking at the spread of all diseases around the world. Hajj is a pilgrimage, which Muslims make to Mecca.
And it draws Muslims from 160 different countries. Three million people from around the world come together in one spot. But in 2009, with the Swine Flu outbreak, the ministry of Saudi Arabia was concerned.
[News footage translation] There is no doubt that dealing with pilgrims from 160 countries and different health issues is going to be a challenge. There are probably no other gatherings where crowd density can be quite so high for so long. Pilgrims are known as guests of God – the Kingdom takes this very seriously.
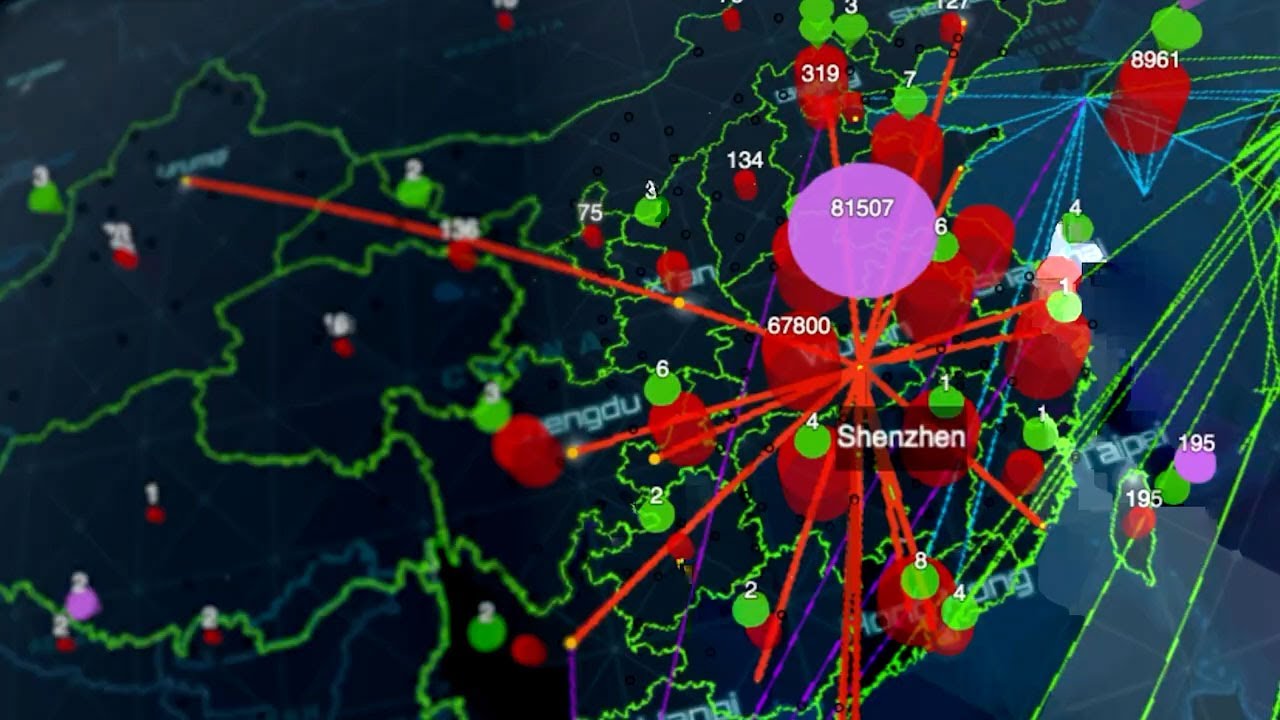
And so they could not issue emphatic bans or turn people away. Given the nature of the virus this was one of the most dynamic public health challenges. If you look at how disease spreads, place becomes extremely important.
The CDC has a mission to look across the globe at disease prevention. We track the gamut of diseases -everything from Shigella to cancer to rabies to HIV. The tracking of H1N1 is a powerful application of the geospatial technology.
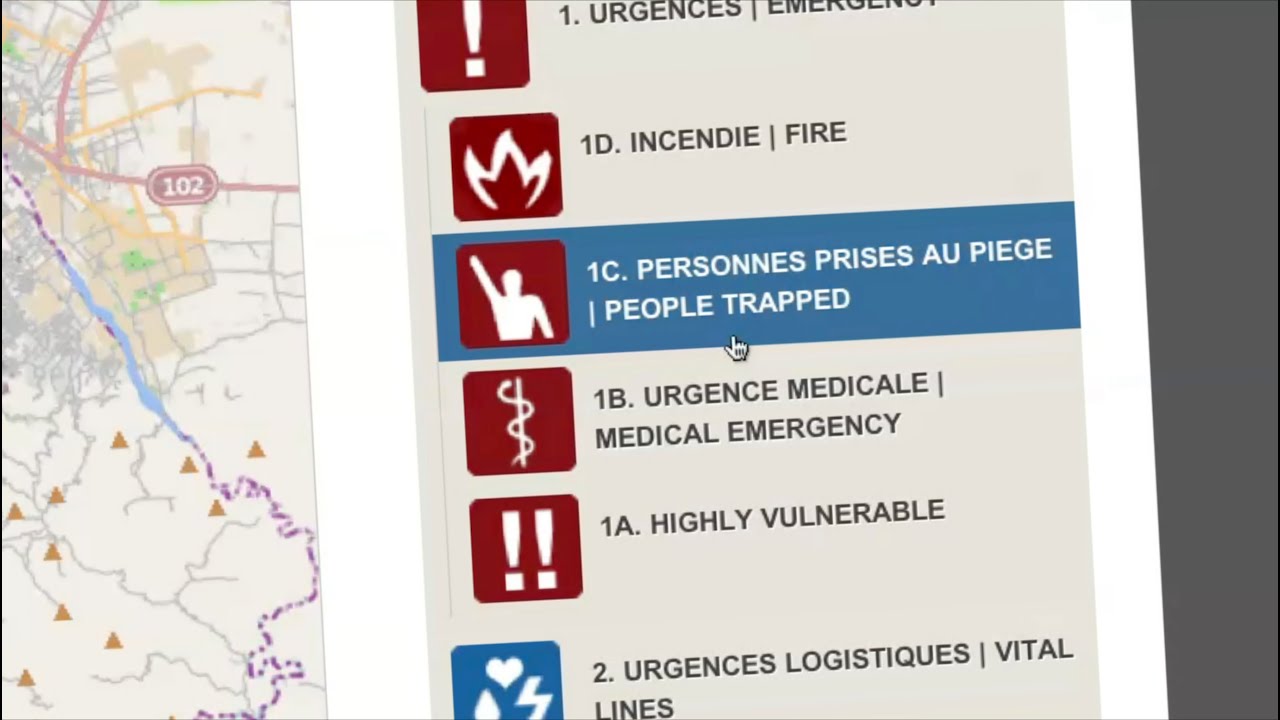
Human beings get in planes and trains and automobiles and they cross boundaries. How do we record all these vectors that are carrying this virus? Saudi Arabia wanted to say, “Hey, you know, we’re prepared for this during a pandemic.
” And so they asked for assistance on a real time surveillance system. They had healthcare workers meeting patients and when they were swabbing individuals they literally could enter the findings into a handheld smart phone. They collected GPS coordinates automatically with the survey instrument.
When they would hit “submit” on the disease form it would go back real time to the emergency operation center in Mecca, and they would see immediately that we have a certain number of influenza cases coming from Pakistan or from Indonesia and so they could do something about it now - but then also they're able to assist their partner ministries with their population when they come back. Now they’re able to measure active disease in real time during Hajj. We were fearing very severe infection control impacts, but that did not come to pass.
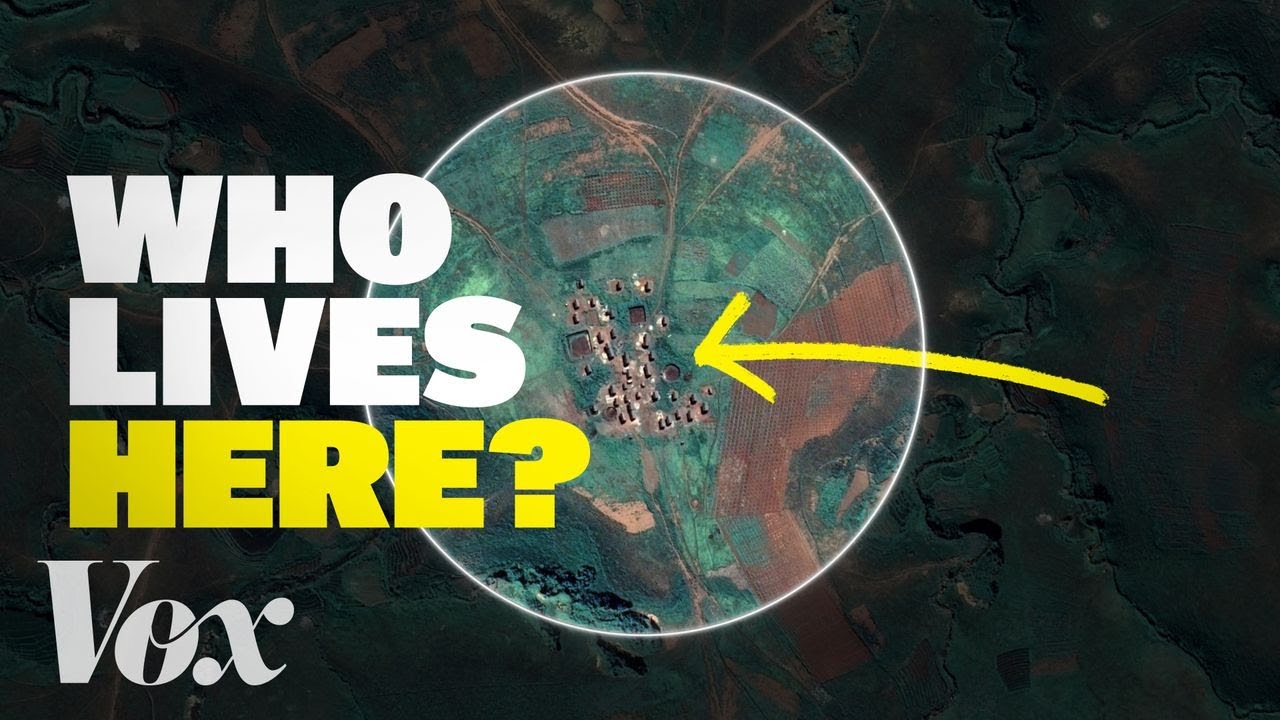
More than a solution to swine flu itself, those mechanisms of collaboration, sharing information are going to serve the Hajj very well, and its going to end up serving many corners of the planet well, too. One of the largest informal settlements in Africa is in Kenya in the city of Nairobi called Kibera. It’s a very dense, very intense place.
Kibera is a slum that is comprising 13 villages. And in those 13 villages we have 12 tribes. If you look at maps from any existing source, Kibera was invisible, just a blank spot on the map.
It’s kind of a fully functioning enclave, but its simply not supposed to exist. It’s seen as illegitimate. The Kibera residents themselves have no public school, have no public health facility, the issue of sanitation is a serious problem.
We have hospitals in Kibera but if you ask people in Kibera who live there, they don’t know where those hospitals are. So, who’s actually guiding that place? How is that place going to move forward?
When we first arrived in Kibera, we had no idea what the response would be. We thought, a bit naively, we’ll spend a month or two in Kibera and at the end we’d have a map and the community would celebrate. But people are sometimes skeptical of new projects, data collection.
This is why we didn’t do it ourselves. It was important for the people of Kibera to do the map themselves. I personally never knew that there was something like GPS.
We were mapping facilities that were important to the community. These included religious facilities, health facilities. They were all very enthusiastic to participate in the project, but still we would get a little bit of questioning from the neighbors.
“Well why are you making a map in Kibera? Are you trying to evict us? Are you giving this information to the government?
” Is this so that they can tear down my house? And we would say, “No, no - the idea is you would have access to this information yourselves so you can actually have a proper discussion about the future of Kibera. ” That changed their perspective.
They mapped those 13 villages in about 3 weeks. Every person that walked around with a GPS created this skeleton of Kibera itself. When we animated the work that they had done, everyone in the room was totally blown away.
Now that such a map is there, it can hold officials accountable so that we can tell them, “Look. Here is a population of about 200 thousand people with no facilities completely. What are you doing about it?
” In the second phase of mapping we went a little bit deeper. We mapped education facilities, water and sanitation facilities, health facilities. We had young girls that helped us map security.
“Okay, but you don’t want to be walking at night. Okay. ” On the security map we used tracing paper to say, “Okay, this place is dangerous, this place is not dangerous.
” “So like blue should be the more safe, red can be the less safe. ” We had discussions saying, “Can you identify where women get raped? ” “It’s not a safer place.
Not a safer place. ” On the map they’re called “black spots”. It’s shocking how matter of fact they are about it.
Like it really is just a reality they live with. Every day. After six months we have seen one of the places that was mapped as being dangerous today that place has a police post.
We used to be uninformed. Now we have all the information about Kibera. We are now informed.
When I saw the map for the first time, I was proud. This has not been done by other people, rather it has been done by me. This technology is changing the way we look at the world.
We’re taking location-based understanding of anything on earth and now making it almost touchable. When you look at geography you think, “Well, the world is not getting any bigger, we're not making any new land” and yet, every time I turn around, people are thinking up new ways to take advantage of maps. We’re in this together.
We’re in this standing on this vast pillar of knowledge that’s been built up by all of humanity over time. Geography and science are going to make a difference. They’re going to help governments make better decisions, help people learn things in new ways, help citizens understand their government and get involved, help save the world.