How's it going everyone? This video is going to be over one system or trading strategy that you can follow in 2026. Too many people bounce around from model to model and then cannot find consistency simply due to the fact that they cannot follow a single system.
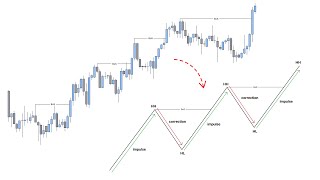
Let's go ahead and learn my fractal model. Now, this model is built off the fact that price cannot reverse without a swing point. If price is going to go from a bearish trend to a bullish trend, it's going to form a bullish swing point.
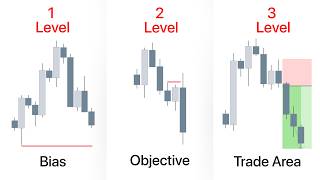
If it's going from a bullish trend to a bearish trend, it's going to form a bearish swing point. Now, if we look for these swing points to form at a point of interest and look for certain candle closures, we can anticipate expansion candles that follow. Now, the first thing we need to do before we get into the lower time frames is come into the day with a daily bias.
We're going to do this by simply looking at the daily closure. If price has a closure outside the range, we're going to be looking for a continuation. So, you can see here with a bullish continuation, price closes over its previous day high.
So, I'm looking for price to continue higher. And here you can see with the bearish continuation, price closes below its previous day low. So, I'd be looking for a continuation lower with a reversal closure.
We have price sweeping out its previous day low and closing back above that low, showing that price has reversed off that low. And we can anticipate a continuation higher in the next day with a bearish reversal. Price has taken out its previous day high, closed back below that level, and then I can be looking for a continuation that following day.
So once I have a daily bias, then I'm going to look for structure and a swing point formation. So how do I go about this? Well, here you can see we have a bullish daily bias through previous day high as price has closed over its previous candle's high.
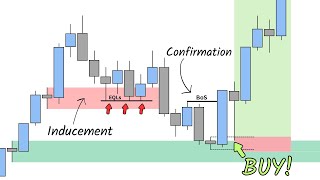
So looking for that, I'm going to be looking for a point of interest for price to react out of. So I'm going to look for that in the previous range of the previous day. So here you can see looking in this range here, we have a fair value gap.
Now points of interest are always going to be either a fair value gap or a low in a bullish scenario or a fair value gap and a high in a bearish scenario. Then I'm going to want to wait for price to reach into that point of interest and have either a candle 2 or a candle 3 closure, which if you don't know what those are, I do have videos on those topics. So here you can see we have expansion, price retraces into this fair value gap, has a candle 2 closure, and we have a draw on liquidity, which is our previous day high.
So with this, I would want to go down to the lower time frames, and then I'd look for a fractal model. Now, very simply, we're going to go down to the lower time frames using our time frame alignment. So, for instance, if that swing point was on the hourly, I'd be using the 5minut.
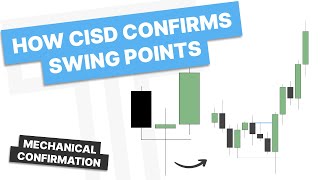
If it's on the 30 minute, I'd be using the 3minut. Now, we're going to check to make sure we have a change in the state of delivery, which confirms the swing point, but we're not going to enter on that change in the state of delivery. We're going to wait for another continuation.
So, what I'm going to do is let some structure form here. You can see we sweep out a low into a fair value up. So, we have that point of interest and then we get the close through the series of downclo candles.
This is a continuation order block which I also have a video on. Once I have a continuation order block that forms going to look to enter on that close through my stop on that protected low and then look for 2 R. So just to review if we go back through this we're going to get a daily bias.
In this case it was bullish. We'll then look for hourly structure or a point of interest on my desired time frame to be looking for. Some people prefer that on the 4hour or even the 30 minute.
And then from there when we form a candle 2 or a candle three closure in that point of interest, I'll go down to the lower time frame using the time frame pairing and then look for a continuation order block and look for 2R. So now that you understand this system, let's go through a few examples of this. So here we are in our first example and you can see we have taken out all the highs over here to our left and then we have a bunch of failure swings and a fair value gap here.
So when we have multiple days of an expansion without a new swing point, I can be looking for a retracement or a reversal. Here you can see on the daily chart, we do have that reversal closure. So that gives me bias bearish into this next day and I could be looking for price to trade into this daily fair value gap below.
Now let's go down to the hourly time frame for our structure. So here we are on the hourly time frame. You can see we have a change in the state of delivery as we have price sweeping out the highs right here and then closing through the series of upclose candles and that's validating this swing point.
So now going into the next day, we'd want to look at the lower half of this previous day's range and look for price to form its wick. So we' be looking for a candle 2 closure or a candle 3 closure in here to try to get on side if I want to catch the wick or wait for a continuation. So let's see if we can find either of those.
So here you can see we do have a reversal closure but it's not very bearish, right? It's more of a dogee. But we can go down to the 5minut time frame and see what this looks like.
Now down here on the 5minut time frame, what would we want to see? We'd want to see the lower half of this change in the state of delivery be respected if price is going to continue lower in the next candle. And here you can see price trades rather high creating equal highs up here.
So this is not something I'd be interested in shorting. Let's see what would happen. So you can see it just more so consolidates and then runs out the high.
Let's go back to our structured time frame as that would not provide a valid setup. Let's see if we can find a new swing point or if it trades too high, we can see if it reverses and then look for a continuation. So here you can see price has traded rather high.
So it's very hard for me to trust this reversal so close to this high. I would want to see if price can form a nice V-shaped reversal and then look for a continuation. Otherwise, many times I see this just fail and then run out the swing point.
Let's get some more information. And here you see we start to get that displacement down or that V-shaped reversal. Now, that is very aggressive.
And you can see this is a new continuation or a continuation order block on the structure time frame. So, let's continue to look at this time frame and see if we can get a retracement to get on side with a move. Now, one thing to notice here is we do have this bullish reversal, but this bullish reversal then fails as we are forming a candle to closure bearish here.
And now this is located within a fair value gap right here. It's rather small, but a fair value gap and retesting this continuation order block. So, we could go down to the lower time frame and see if the structure aligns with a move towards previous day low and into that daily fair value gap.
Let's drop down to the 5minut time frame as that aligns with the hourly. So, here we are down on the 5minut time frame. And let's take a look.
Do we have a point of interest here? We do. We have a fair value gap.
But what else are we doing? We're taking out this short-term low here. So, this is where we sometimes will run out a protected swing or a new high to then go lower.
Let's give this another candle or two. And you can see we don't respect this area at all or this smallbodied candle here. So, let's see if we form a new continuation.
So, we are sweeping out that high. We then need it to form a continuation which would be a close below here. Let's see if we can get that.
And there you can see we do get the closure below. So then I could look to take a position either on the close or on the retest. Put my stop on the body high or the actual high.
Either one works. That is up to you. And then I'd be looking for two R.
So just to review, we have a daily bias that is bearish. We have an hourly continuation out of a fair value gap. So we have formed the high of the day is what I'm anticipating and then a continuation in this hourly fair value gap right here.
And then we have a continuation on the lower time frames. So what are we doing? We are aligning all of our time frames in one direction.
The daily is bearish, the hourly is bearish, and the 5m minute is bearish. This is when expansion can occur. So let's see what happens.
We get tagged in on the retest. Candle four, do we get a continuation? It waits until candle five, but we do get a move lower, right?
And that is the expansion that occurs when we have all time frames aligned bearish. So, just to review one more time, we'll go back out to the daily time frame. Here we have price taking out highs on the left.
Here we have a reversal closure, which gives us a bearish bias for this day. here going down to the hourly time frame. We have a change in the state of delivery which confirms that daily bearish swing point and then we are looking for the wick high to form in this daily candle.
Now I can look to trade it on the candle closure and actually get in on the wick or I can let that in candle change in the state of delivery form or that continuation on the structure time frame and then seek a continuation. Here price traded too high so we let a V-shaped reversal form then looked to get a retracement and then get on side with a new expansion. So here you can see we had a candle to closure and a point of interest and then we went down to the lower time frames and found a continuation order block.
Now where could I be targeting instead of just two R here. I could look for previous day low or for price to trade into that daily fair value gap below. And you can see if we let that play out, we do get a very nice drop into that daily fair value gap.
And that's how you can get greater risk-to-reward on your trades is use a lower time frame invalidation and still target those higher time frame objectives. Now, let's get into another example. Now, here we are on our next example.
We are on USD JPY on the daily and monthly time frame. Here you can see we've had a candle to closure on the monthly, which gives us a bullish bias for this month or this October. Now, we're getting into the end of October.
I don't want to fade that month, especially with these equal highs resting above. So, with equal highs, what do we have? We have a candle to closure on this time frame.
So, what would we want to do here? Well, we'd want to refine that down and confirm it. Now, this is a fractal concept.
So, in the earlier example, I use the daily, hourly, and 5m minute. But here, you can see I'm using the monthly, daily, and then hourly. So, the hourly will be my entry time frame.
Now, is this at a point of interest? Yes, it has wretched into this fair value gap here. The body is respecting it and we are closing back above it.
So, instead of going all the way down to my lower time frames in this case, I can just use the hourly as my entry time frame. Does that mean you can't refine this down further? Of course, you can, but sometimes I just prefer to not refine it down too much.
But let's see here. What do we want to see? We want to see price open and then form a continuation, right?
We're looking for a continuation order block. Now, if we look in this structure here, I already have one, but I don't want to see price trade below this level, right? And that also lines up with the EQ.
Let's look for another continuation to form in here. Now, we do have a fair value gap here, right? We reach into a fair value gap.
Do we close over these down close candles to form a continuation? No. We are forming a consolidation and then we make a new low.
Now I've refined this down. Do we close over this level to form a new continuation and there we do. So with that I can then look to take an entry either on the retest or the close here.
I'd rather take it on the retest. Why is that? Well, we just took out these highs here.
So we could get a retracement before going higher. So looking for a retest, put my stop on the bodies because they are nice and fullbodied candles. And then look for 2 R.
Let's see how this works out. And there we hit 2R. You can see this is an example of the monthly to daily to hourly framework, right?
Just aligning multiple time frames in one direction. Now, if I wanted to refine this down further, I could look to refine this down in here as price takes out this high and then we have a retracement. So, if we're going to continue higher, I'd expect a low to form in here to trade higher, which you could look for a swing point on the 30 or 15minut time frames.
So let's get into one more final example. So here we are in one more example. We are on oil on the hourly chart.
So you can see we have this daily closure here which is bearish and then do we have that change in the state of delivery? And we do. We have closed through that level.
Now we want to look for a continuation in this area to get on side with it. You can see it's a bit messy, right? We have all these failure swings.
We have swept out this short-term low here. So it's not looking great, but let's see if we can find something. You can see we'd want to see this area respected and price just immediately trades higher.
Now you can see we do sweep out this little low but even with that do we form a continuation? No, we do not. We have not closed below this level and we fail to do so.
So now what is this becoming? When we fail to form a continuation multiple times, this is just becoming a range, right? This is a consolidation.
So, how do we approach consolidations? Well, we'd want to see the high or the low of the range be taken out and then a continuation or an order block form there. Here you can see we sweep out the high in this consolidation or previous days high.
We now have a protected swing form and then we could look for price to continue lower here. Now, I just wanted to show this example because one, if we are not going to form a continuation, it doesn't always occur. That is where price will then form a consolidation.
and then I want to avoid it until one side of the range is taken. If I do want to trade something like this, this is trading a reversal day, which is a bit more complex. But that is how I would approach it.
Now, let's say I did want to get on side here. Well, I can still look to trade a continuation. So, if I go down to the 15-minute time frame here, you can see we have that sweep and the close through and we form another continuation or this breakdown here, which I could trade the breakout of.
But this is not an example of something that I want to trade. I was more so showing this to show you that when price fails to form a continuation and you are looking for it or it is just messy. Don't try to force yourself on the market.
Focus on those examples that are really clear and focus on trading those versus trading something like this because it's just a bit more complex. Now, if you did enjoy this video, please let me know in the comments below and I'll see you guys next week. Have a good one.


![Carlsen's 10 Simple Rules to Win [Copy His Easy Strategy]](https://img.youtube.com/vi/T8GaQhVpbJg/mqdefault.jpg)