Elite prop Traders discover and deploy trading indicators that most retail Traders don't know of or don't understand in this video seasoned SMB Trader Garrett dryan Reveals His secret indicator that helps him trade with much better precision and accuracy I'm Mike Bella Fury and we're one of the top proprietary trading firms located in New York City since 2005 and proud to have developed numer seven and even eight figure per year Traders we we hope you agree that you have found the right place to learn I can't tell you how many times I've been in a situation
where I'm looking for a turn in an overextended stock and I exhaust myself on the front side way too early only to see the stock go much further than I thought before it completely reversed or bu an option looking for a directional move and the price of the underlying stock moves in my direction but I don't make any money but then I started to look at things differently I looked deeper into why these things happen and things started to click and my trading began to flow significantly better what I found is that it often comes
down to a key metric called implied volatility and it's a very simple concept once you understand what IV is measuring so now implied volatility is a huge deal because it measures the amount of f future volatility the market is pricing in for the stock you're trading and almost everyone on our desk tracks it and just like price implied volatility moves in Cycles what this metric reveals to us is the emotional level of the participants in the market and directly relevant to what we're addressing here in this video ivy can have huge implications for turning points
in the market or how your option might move with or against you but if we don't understand IV it will be tough to get this right so by the end of this video you will have a solid understanding of what implied volatility is why it's perhaps the most important variable of the stock you're trading and you'll learn about some free tools that help us track implied volatility and how to use it to your advantage when trading stocks or options you don't have to be an option Trader to benefit from understanding implied volatility and I'll show
you why so I'll go into detail about how to use this metric in the second half of this video including the indicator that we look at but first I'll lay out the foundation of what exactly implied volatility measures so that you can internalize how important it is to your trading and build on that knowledge in order to trade better so implied volatility is a metric used in options trading that represents the market forecast of a likely movement in a Securities price implied VA measures the Market's expectations for how volatile a stock will be in the
future IV is the only input in the options pricing formula that is not known this is why IV is the wild card we know where the underling is trading and we know how much time we have until expiration but we don't know what kind of move our stock will make in the future and this is what IV is attempting to price into the options premium and this is why options premiums and the price of our options can sometimes be considered cheap and sometimes be considered expensive on a relative basis that juicing of our options premium
all has to do with how much IV is priced into the option now even though the price of the underlying stock and the time to expiration are also key factors in determining the price of the option ultimately the buying or selling pressure in the options contract itself will determine the price of an option just as in any other market so think about it if an option with the same expiration the same current price of the underlying and the same strike price increases in value this increase due to the demand of the option reflects the Market's
opinion on the kind of move the stock could make in the future Market participants are willing to pay more for an option contract if they think the underlying can make a big move and this change in the options premium is reflected in the implied VA now implied VA has a value so what exactly does this value represent implied volatility is expressed as a percentage this percentage represents the estimated one standard deviation stock price move over a one-year period statistical terms a one standard deviation range covers about 68% of possible outcomes around the mean and in
this case of implied V the mean here is the current stock price so for example if options on a stock you're trading have an implied B of 20% it means the market expects a 68% probability the stock will fluctuate within 20% of its current price in one year therefore the one-year expected range formula is the stock price plus or minus the stock price times the implied volatility so if implied Vol expands so does the expected one-year range this is how IV works this value is always annualized meaning no matter what expiration your option has the
IV values always represent the volatility over a one-year period now of course this does not mean the stock will not trade outside this range within a year the IV value just represents what the market thinks the stock will do based on the prices of the options so if we're looking at option contracts for two stocks both stocks are trading at $100 both options are out of the money 120 calls and both options expire at the same exact time the option with the higher implied volatility will be more expensive than the option with the low implied
volatility because the option with the higher IV according to the market will have a higher probability of reaching that 120 strike and there have more value than the 120 strike of the option with lower implied volatility and we can use this implied volatility Dynamic to alert us to key moments in the stock we're trading which we'll go over in a second now most Traders know about the VIX Index I would guess that this is how most Traders are familiar with implied VA the vix is often referred to as the fear gauge and it measures the
30-day implied volatility of S&P 500 Index options so when we look at the Vic we're looking at a chart of implied volatility the vix is often used as a gauge of Market sentiment particularly fear and uncertainty the applied B of the S&P 500 tends to be low when markets are calm and Traders are complacent and tends to spike during times of Market stress or uncertainty so think about it if the market begins to tank and Traders are fearful Traders will be willing to pay more for options contracts because there's more urgency to hedge positions and
directional Traders are expecting bigger moves so know this is often a misconception that implied VA Rises only when stock prices fall well this is common and often more aggressive on the downside especially when looking at the vix implied EV of individual stocks can rise just as easily when prices rise at an increased velocity because remember the definition of volatility is movement over time so it works both ways and I'll show you some indicators that help us track the implied Vall of the stocks we're trading there's often a correlation between a stocks recent volatility which people
call historical volatility and the level of volatility that is expected in the future AKA implied VA this means that typically options prices will be cheaper when the stock is experiencing low levels of volatility and option prices will be more expensive when the stock is experiencing high levels of volatility there's one important caveat to this Dynamic that's important and that is the effect of upcoming earnings reports or other known events in the market that could generate a high level of volatility in the future so for example you'll see implied volatility increases ahead of earnings reports because
for those option contracts that expire after the report the market will price in the potential for big moves and then of course IV will get crushed once the report comes out and why is this so important to us even if we don't trade options so to put it simply the options Market is often run in the show right many of these big moves we see in the market are due to options volume in fact ever since 2020 options volume has frequently outpaced stock volume in the overall market so it's important to understand this Dynamic and
even more so it's important to be able to track implied volatility now how can we know what high premiums and low premum premiums are how can we know how high the IV is in a particular stock relative to its historical levels of implied volatility it's a great question and it's often overlooked and we have a great tool for tracking this and of course you can track the IV yourself if you're very in tune with the options chain on a particular stock dayto day and month to month but not everybody is going to be watching the
options chain like a hawk and not everybody is going to be trading options in the first place in order to benefit from tracking IV so there's a great way on most platforms to visualize implied volatility so on thinker swim it's called IM volatility and on trading view it's called implied volatility Suite so this indicator takes the implied Vol of the stock you're watching and averages the IV across many different contracts and it plots this IV below the price bars so here's a chart of Tesla the IV is plotted in blue below the price bars so
notice how implied EV spiked when Tesla experienced a sharp sixday selloff to new lows and notice how implied Val spiked when Tesla broke out of 200 and ran sharply for six days or so this is an example of when volatility comes into the market Traders are expecting big moves and are willing to pay more for options and the call options on that Tesla 200 breakout did very well because not only did the underlying move in the right direction but IV expanded as well helping the premium on those options increase so one rule of thumb is
that IV usually expands with the direction of the volatile move so naturally Ivy usually comes out when that move unwinds or slows now this first move also had an earnings report right so remember that Ivy will also get sucked out after earnings and we see that here in Tesla this is something to be aware of but we're not going to focus on that right now so recently we experienced some pretty incredible Market volatility this is the kind of volatility that is going to spike in plied Vol aggressively so just take a look at the vix
so here's the VIX Index on the left and the QQQ chart on the right and as the market sold off hard the vix spiked and this was a a pretty incredible Spike um especially on that final very large gap down in the market that we had and here's a chart of envidia on the day of that gap down so notice how the IV for NVIDIA spiked at the open due to the very large gap down and then then this is key notice how ivy for NVIDIA got crushed as the stock bounced hard so this is
the ivy unwinding as the giant down move that caused the spike in IV mean reverted now imagine what will happen to your options when this move happens so I know a Trader who did the right thing and got long Nvidia near the open on this day and it should have been a big trade but he chose the wrong way to express it so what do I mean by that well he bought calls and even though the stock moved sharply in his Direction the IV on those options got crushed and he actually didn't make any money
when we're playing for a reversion to the mean after a move that expands the implied volatility of the stock we're trading it's often not a good idea to express that with long options sometimes it's a much better idea to express it with stock so that you're not subject to the IV Crush that occurs when the stock reverts and of course owning the puts on the on the way down in this move would have paid tremendously at the open here because IV expanded in a big way juicing the premium on those options now this is a
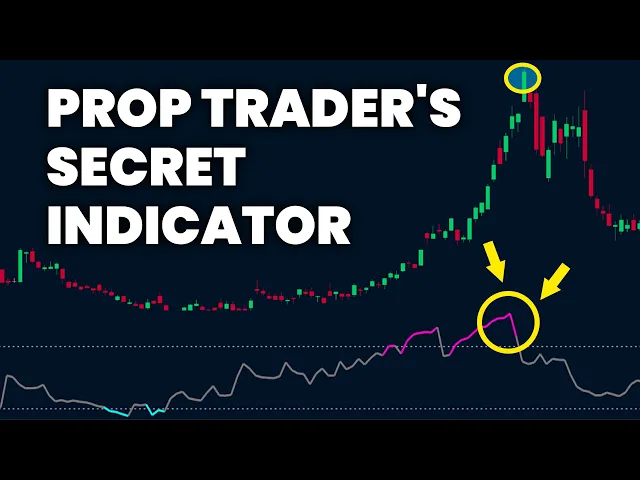
great example of how tracking IV can inform us to how to express an idea but how else can we get some signals from implied volatility so let's look at some overextension plays and examine the idea of timing this exhaustion so most Traders are only looking at Price Right Price and volume and we know what price can continue to do right it continue to rip longer than we expected like especially on these good ones like way longer than we expected so sometimes Traders have issues waiting for these trades to truly capitulate right that's a key factor
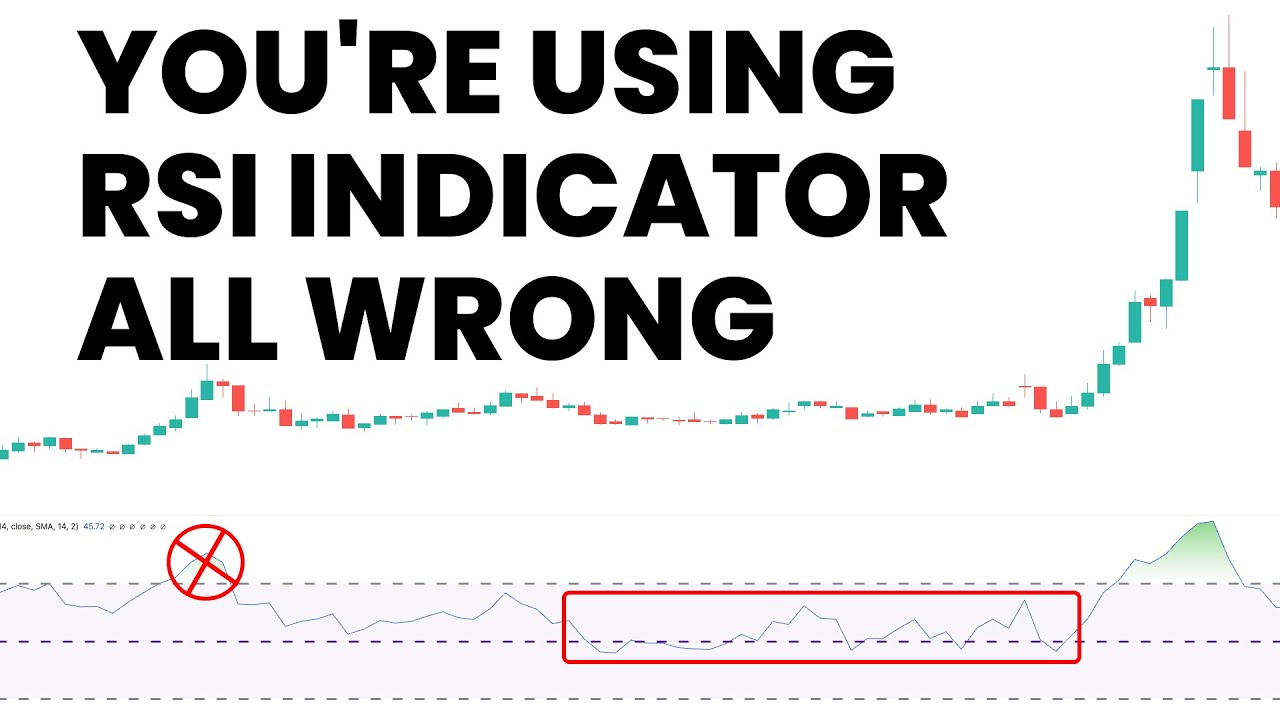
in these trades so these truly large moves tend to break price based indicators right what I mean is that like your RSI is going to go nuts way early and all the other like overbought oversold indicators are going to go nuts so they will get overbought early in the move and this is the part that I really love because if we track the IV of the stock we're Trading and identify areas where IV gets to extreme levels where it has historically been maxed out then we can gain another layer of understanding of when the stock
might be ready to turn because remember when Ivy expands aggressively so do the prices of the option contracts so there may become a point where these options are just too expensive to play right Traders have been pricing in bigger and bigger moves until bam the whole dynamic cracks and becomes unraveled and these option premiums come back down to earth and they come back down to earth fast so let's look at our Tesla example here's a Year's worth of price action in Tesla and I want you to notice the levels where Tesla's implied volatility was maxed
out and had a hard time going higher and there are a few different ways to visualize this Dynamic then there are a few more indicators we can add in order to see this so let's take a look at the historic smci run earlier this year this move lasted longer than most people anticipated we can do what we did before and look at where IV is compared to where it's been in the past right the first IV Spike was due to earnings and the second IV Spike was due to expanding volatility in the stock price of
smci and we can use an indicator called IV rank to quantify where the IV is now compared to where it's been over the last year this indicator will give us the percentile of the current IV within its yearly range or whatever time period you want to look at and I like to change the color of the plot when it gets over the 998th percentile because that's really what I'm looking for here in order to see that implied volatility might be exhausted so you can see here that IV got above the 998th percentile the day before
smci cracked and this is a great alert right you can even create a watch watch list based on IV Rank and get all the stocks that are reaching this level so now there's one more creative way to look at this Dynamic I created an RSI indicator for IV so rather than measuring the momentum of price I'm measuring the momentum of IV to identify areas where it might be overbought so let's take a look at M right the Bitcoin minor from the end of last year when it went from 15 to 30 in less than a
month all right A lot of people looking at this mean reversion trade now we got our IV rank signal here as it topped out but what if we measured the IV using the RSI notice when the IV RSI turns pink this is when it gets above 70 right the most common level where Traders consider the RSI to be overbought now where did the price RSI get overbought on this daily chart well pretty much during the entire move so we can see what an advantage looking at the IV can be when we're trading these outlier types
of moves so look I'm loving these signals I reference them only for big plays like this big overextensions and it's something to consider adding to your toolkit but just like any signal nothing is Gospel you have to combine things with other factors like price action make these setups your own right control your risk no matter what nothing works 100% of the time I always say that if anyone tells you that they're lying to you so I want to show you an example of when this doesn't work when Ivy stays extended relative to historical levels longer
than expected so here is mstr from its wild run in March right this shows us that implied volatility for mstr options stayed elevated for a very long time and I remember how expensive these options were it was pretty nuts right and this is unusual but it does happen so these signals in particular are outlined in detail in our bionic Trader meetings on Tuesdays where we dive deep into how to build and read these indicators in fact last week we added the IV RSI to our toolkit because I'm realizing more and more how important this is
and how much Traders are connecting to this concept of implied volatility and how much of a lwh hanging fruit it is to start looking at the market in this way for some people so if you want to join us on Tuesdays take a look at the inside access link below so you're an active Trader not doing as well as you want not doing as well as you deserve and you just can't figure out why you can't become profitable no matter how hard you try well let me show you why this is your competition the traders
in this room this room right here is full of elite Traders some of whom are making seven and even eight figures a year in fact our top guys have made nearly 20 million each in net trading profits in a single year let's head to my office so I can share more so you're probably used to seeing videos of lavish Trader Lifestyles trading gurus trading off of a laptop for an hour a day heck maybe even 15 minutes a day and then them relaxing on some secluded beach for the rest of the day well all I
can tell you is that our Traders train like pro athletes they live and breathe the markets and are continually working on their trading skills because at our firm that's what we found it really takes to make it in this game I'm Mike bfury co-founder and managing partner of SM SMB Capital One of the world's top proprietary trading firms located in Midtown Manhattan and we're always looking for trading talent to hire and develop and not just to trade inhouse on our desk but also to trade from their own home entirely using our firm's capital and we
have numerous Traders doing just that allowing them to make upwards of seven figures trading the firm's Capital without risking their own money but to even get a shot at something like that you need to have the right training that's why we're doing a new free online presentation in which we share how you can get an interview with SMB to become an in-house a remote Trader trading firm Capital without risking yours and getting access to all of our firms coaching and resources and the best part you don't have to be a profitable Trad Trader yet in
fact we prefer to mold profitable Traders with our methods and our techniques that's why we have just three simple criteria that can earn anyone in interview we're looking for highly ambitious and determined traders who fit our culture first and foremost so if you believe that could be you sign up for the free one-hour online presentation by clicking the link that's in your top right corner of your screen now
![The most beautiful equation in math, explained visually [Euler’s Formula]](https://img.youtube.com/vi/f8CXG7dS-D0/maxresdefault.jpg)