All right folks welcome back I do hope everyone's doing well so we're looking at episode 12 this lesson and lecture is going to be on the topic of Market structure for precision technicians now admittedly going into this this is an advanced price action Theory you're going to have a lot of questions it's going to cause all kinds of anxiety for those that just feel like you have to learn it the first time you Watch a video trust me you will not and you cannot learn this in one video okay this is actually going to be
a lesson even my paid mentorship group has yet to see okay so I want to give you something that's fresh something that is deep that will allow you to go into your charts and start studying a little bit more well deeper than the normal higher high higher low idea that is made up of the retail view of Market Structure all right here is the NASDAQ March contract for 2022 I already hear some of you already hissing and moaning the Forex traders in my group when are you ever going to talk about EUR dollar well let
me remind you what I'm teaching Works in Forex okay it works in stocks it works in bonds it's up to you to decide what asset class you're going to work with Okay so I'm teaching price this is the asset Class that's moving around nicely so I'm using it as a medium okay you could just as easily go into a Aussie dollar you know or pound Yen chart and you'll see these things happening as well okay trust me we'll get into Forex again okay I haven't abandoned forx I just want to mine this vein that's available
in volatility right now with the index fatures all right so obviously we can see with the benefit of hindsight that the things we were looking for in price Action has come to fruition we were looking for the Run below these lows in here we got that we were looking for a run and rebalance back up into this fair value Gap it did so handsomely broke lower overnight with all the wartime things that are going around the globe and you know what I'm referring to uh that caused a little bit of excitement on the downside and
then we're back Above This short-term low I Am not convinced at this point that we have made a low so that way we can put that the bed right now I'm not in the business of picking tops and bottoms so if you feel like you're going to go out there and do that just letting you know that I teach my PID group not to do that and I don't go out there actively trying to do that either but we're going to go into a deep dive of Market structure inside this area now before I do
this I want you to understand this part this is The part that seems boring this is the part that gets the most complaints from those individuals that will never ever do well or succeed in this because they want five minute Trainers for something that's extremely Technical and you just can't strip it down to very easy ideas Okay so it's going to take a little bit of study thinking and homework of you going through old price data and you'll start seeing these things but I promise you this video will Cause a light bulb movement for you
and you'll start to see things that are in the charts all the time but you are not aware of it and it'll also allow you to go back into Old moves and see that this is in fact very true and you can use it to confirm or negate a price move I get a lot of questions through trading view people posting hey you can you answer this for me can you answer that for me I don't make it a business of doing that because I don't have a lot of time for It but I use
those questions in these talking points in my lectures not only in this mentorship but in my private group so the questions I get a lot is how do I know if I'm going to sell above an old high how do I know it's not going to keep going higher well that's the underlying Market structure and the trust in the factors that I'm going to kind of like teach you tonight me teaching it to you is not Going to transpose my trust that has to be developed in your learning curve it's going to take time how
long is it going to take I don't know all of you are going to do it differently but you're going to arrive right on time exactly when you should that's when you're going to get it all okay and it's a matter of how much time and effort you put into studying it because these candlesticks you can make them say Anything you want you beat on them and they'll submit to anything but you want to know what they're likely to be hinting at and I'm going to give you those Clues tonight but in here we're going
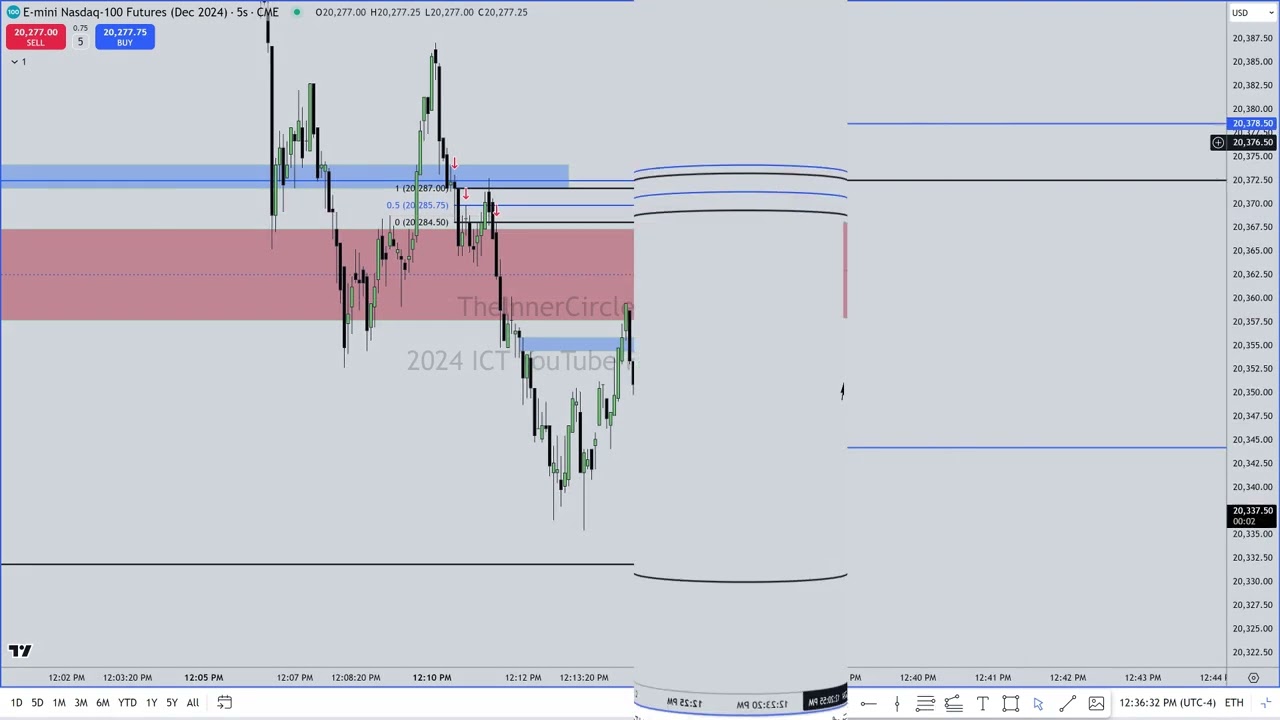
to take a deep dive into that price action right there all right so we are looking inside that fair value gap on the daily chart this was the high end of that fair value Gap and this was the low end of that fair value Gap the time frame on this Chart as you can see here 1 hour and I've outlined Market structure in the idea of long-term High long-term low short-term High short-term low and in between those two swing points there's an intermediate term High and an intermediate term low when we look at Price we're
not looking for just the simple higher high higher low therefore it's a bullish Market or uptrend that that's not what I'm looking at I'm Looking at does the market have a reason to go up for buy side liquidity or buy stopped or is it likely go up to rebalance an imbalance which is like a fair value G or is it likely to go lower to sweep out short-term lows for sell side liquidity or sell stops or is it likely to go down to rebalance and old inbalance or a fair value G below market price that
Is the number one question that I have before I sit down in front of my charts that's what I'm looking for what is the current market narrative what is it likely to be doing right now I don't care about patterns in price action I don't care about anything harmonic I'm not looking for any kind of Elliot waves I'm not looking for any kind of ratio idea I'm not looking for anything that you can attribute to a retail Mindset nothing except for those two questions is it likely to go up for stops or go down for
stops or is it going to go higher to rebalance or lower to rebalance balance now how do I arrive at that idea is is it going to go higher is it going to go lower because that kind of like leans on that question I told you many times if there's one question I get asked the most it's teach me bias in other words you want to know Where's the market going next and that's good that's the next draw on liquidity but the daily range will not always submit to that bullish or bearish right from the
opening go higher or rate from the opening go lower sometimes you'll have consolidation Inay and you may have been trying to take a trade that was based on an idea that you came to that would be bullish and maybe it did give you an opportunity to be in a trade that was profitable for a period of time but You held on to it thinking the daily range was going to keep on going higher and it turned on you these ideas I'm going to teach you in this lecture here will help you identify the likelihood that
your idea is probably been proven inaccurate but you have to be receptive to the clues that price has given you that's the number one reason why I abandoned indicators and if you have anything on the charts that cover up Candles or Draw your attention to something that you're putting on the chart and I call that you know factiously lipstick okay that's what this chart is showing here it's this lipstick it's me communicating how I am internalizing this price structure this fractal and price I'm looking at it with this idea now I'm looking at it in
a matter of seconds I come to this conclusion I'm looking at the highs and I'm looking at the relationships between Each swing High each swing low and I'm coming to a conclusion studying one swing at a time and I'm going to come up with the idea that it's likely to go lower because that daily chart we I called it in front of all of you I outlined it told you where it was going to go so that way we understand one I'm teaching something that I already proved before the fact so it's not like me
coming back to this area here because if you haven't watched the videos proba Let say you just found this YouTube channel and you're watching this one it sounds like the typical guy that comes on YouTube and says here's something that happened you know and I can sound and look and appear smart because it's already happened and I have no real risk in being wrong I told you it was going to go lower from here and it did now I'm going to take you inside that price section and outline what it is that I look for
What it is that I looked for at the time and how I felt confident it was going to go lower okay so right away we know that price has traded up to the high end of that fair value Gap and again this level here is that daily chart let me go back up one chart that's this level here okay it's on this candle that low and the low of the fair value G is this candle's High dropping down in to the hourly Chart that's the high end of the fair value Gap this is the low
end of the fair value Gap again on an hourly chart so that way we have our bearings so when the market traded up into and just above that fair value Gap high this red level here once it started to break down and go lower it traded back down into this candlestick's high so we're trading back inside this range and we're range Bound since I am expecting the daily chart to be the parent of this price structure all minor lower time frame swings are going to be subordinate to it and what does that mean this now
is a long-term High I do not expect this High to be broken to the upside should it be broken to the upside that means that my daily analysis expecting this level here to hold price and to be a factor in the algorithm repricing and going lower at a later Time if it goes above that then I'm probably wrong in my analysis so therefore I demand more information by studying more price action and sitting on my hands or if I have a trade on it means that I have to admit that I'm wrong and the stop
out that may occur is just me managing risk it's a losing transaction does not mean your model is flawed it does not mean that you're a failed Trader it just means that that transaction was not a profitable one and It's just a cost of doing business but as long as price remains below this High my idea is this is a long-term High because it's framed on what a higher time frame resistance level if we're want to talk in terms of retail idea so that way we can understand something in a simplistic manner but we'll build
on the ideas that will help move you away from simple support resistance ideas so this long-term high should remain Intact and no's price should not go higher than that we trade down to the discount level of the low end of that fair value Gap and it starts to find support rallies back up trades near the high but does not take that out very important once it starts to break down and consolidate in here retail ideas will see a lot of trust in the idea that's potentially a bull Flag I love seeing those patterns because I
like to fade them so that's a false bull flag and when we see price break down like this and then rally back up every single time this is important this is the part where you start writing down these details every single time price rebalances an imbalance like we have this candle's low this candle's High we have that one single candle passing down like that once that Rebalances by going up here that swing high from this high this high and this High that's a swing high right there I immediately label that in my mind not on
my chart because I don't want anything distracting me if I have these things written on my chart at the time it's going to be a distraction to me but the way I'm internalizing it and you'll see what I mean as I go through this lecture every Rebalance of an old imbalance That Swing that's created at that moment I immediately label that in my mind as an intermediate term high or in this case as we came back down and filled in this by dropping down here that's an intermediate term low what does that mean what's the
significance of that typically what you'll see is intermediate term low has a higher Short-term low to the right of it and a higher short-term low to the left of it this immed term low forms by rebalancing but it has a higher short-term High here but then the market trades over here off of this short-term low it rallies up but it fails it fails in here we're going to anticipate that failure whereas if you're looking at this low high higher Low failed higher high higher low so what's forming here a pennant or a triangle pattern right
how do you know which side's going to break out that was one of the questions I had all the time as a developing student back in the 90s 1992 1993 I was buying every book and get my hands on and I got the book the John Murphy technical analysis of the financial markets book which is the retail Traders Bible okay that book is so useful in terms of just reading it and knowing what not to do because that's what the 90% crowd follows when they look at Price action still to this day because it's always
regurgitated in some way shape or form someone's teaching that same idea uptrending trend lines which are so subjective how do you know what swing lad attach for a trend Line there's lots of Swing lows in here how do you draw it it's all subjective so you have to have a way to reduce it down to I hate to say it like this but it really is no better way of saying it but you have to break it down into a science we don't do technical analysis we do technical science okay you have to be able
to relate to certain things way out and measure what these factors are within price action which is not based On hypothetical guesswork or some kind of a harmonic animal pattern which to me makes no sense you have to look at the relationship to price action and the relationship of how it behaves what is it indicating what is it showing the market has traded higher then Consolidated we failed to go above this important high back here that's a long-term High then we have an interterm High Why why is this a intermediate term High because we have
a short-term High here and a short-term High here so between two short-term highs the highest high between those that's an inter term high but the main takeaway for your notes so far is anytime a imbalance like this big candle up is rebalanced that becomes an intermediate term low just as well on the opposite end this down move here that's a fair value Gap soon as it rebalances there that's what I classify As an iment term high now here's where we take a huge step forward classically defined by Larry Williams and you can see where I
made a departure from his works okay it was very influential in the beginning of my development and it was a point of argument internally with me when I was watching him teach it on his VHS course the future millionaires confidential trading course that idea of his approach to Market structure he teaches a little bit of it in this book okay so it's long-term secrets to short-term trading by Larry Williams um there's not a lot of books I have over 2,000 some books and I can tell you literally there's a handful of books out of all
my collection that are useful and I can't bring myself to throw them away way because number one I paid a lot of money for him and it's just Nostalgia you know me chasing all that Stuff in books and it's just always the same stuff that never really works the ideas that he teaches in this book here they were taught in a early work by him in regards to Market structure how to internalize price structure how to look at Price not just from a higher high higher low because that's too myopic okay it's a Pursuit especially
in this generation today it's a pursuit of Simplicity for the sake of Simplicity Alone not for the sake of getting to the truth or the heart of the matter and that's what makes me a stumbling block for many of you that are younger because you want right now instant gratification you want instant reward for the minial time that you invest when it's surprising to learn that you're going to take a lot more time than you first thought it was going to take to learn how to do this exceptionally Well but for an additional view on
how I built this understanding in price action it originally came from his idea of Market structure but if you study what I'm going to show you in this video lecture here my paid group has never seen this before and you're seeing it for the first time okay so when you hear people talk about Market structure and they're looking for a higher high higher high higher high and having Successive lower lows behind them and then you have a failed higher high and then it breaks the swing low right before that failed higher high they look at
that as a change in Trend uh not all the time many times that's a good buying opportunity for me because really that's just coming back down to a deep discount and I'm going to buy those and continue higher so it's a little tricky if you Don't understand the higher time frame which is what these red levels are that's higher time frame the erarchy in parent to child price swings okay so that way the subordination that the smaller time frame price swings adhere to from the higher time frame is directly linked to the order flow on
those higher time frame charts so in other words what am I saying The daily chart has the bulk of the volume that's coming into that Marketplace there isn't a lot of volume coming in on a one minute chart that's not to change the importance or reduce the importance rather of an of a one minute chart within the proper context and Market structure that's underway so you can use a one minute chart to navigate because as a smaller retail Trader which is who we all Are but we don't trade with retail logic there's a there's a
separation from what we're trying to do in price versus the collective out there that learns from books and things like that now that may sound like an Octor because I'm pointing to a book right here on the screen but the ideas that he teaches early in this book about Market structure I think is the whole well the only I found useful in that book I have a lot of respect for This man but out of that entire book his discussions about Market structure that's the only thing I find that is useful from that book so
if you're reading anything else in that book you know great if you like it but my only addition to this for more research for more of a foundational idea where I got this from um you're going to hear people say um he teaches Larry Williams Market structure no I don't the ideas that came early on in my Learning came from this man's interpretation of Market structure but I want to take you into the chart now and show you what he's not teaching in that book what he hasn't taught in any of his works and it
gets a little bit closer to the heart of the matter and you'll find it it's it's really interesting so if we have a imbalance that's rebalanced and we have an intermediate term High shouldn't an intermediate term High have a lower Short-term High to the right of it and a lower short-term High to the left of it yes Mr Williams says so in his book also would I discovered in my own study no one taught this to me okay I kind of pioneered this idea see a lot of these Instagram guys after saying they p neared
something in the last two years of trading the idea of a intermediate term High not being higher than the short-term High to the Left of it or the short-term High to the right of it in other words it's going lower this an ideal scenario should be this high should be above both short-term Highs but it's not it's not so what what is it doing it's only rebalancing this and where is it likely to go well if you're thinking in terms of a pennant or Triangle pattern it's indicating to me soon as this candle starts to
go up like this this candle and this candle why not this candle too well this candle only has this low here this candle is an up close but this starts the last two up closed candles right before this move down this is important because we're going to look inside this shaded area and how we can use highly precise ideas within this order block I'm anticipating this run up with These candles forming an order block where everyone else is teaching the idea of the last up Clos candle before the down move that is not my order
block that is not my order block so you need to stop teaching that because it's not accurate call it something else but don't call it order block this movement here these two green candles that are going up I'm watching these as they form live with the expectation because this imbalance has Been rebalanced here this swing high is an the intermediate term High I do not I do not expect this High to be taken out so I'm already forecasting and anticipating a failed price swing in here every time this green candles are forming I'm looking at
that as a bearish order block so from the beginning at that candles low I'm looking in time on Lower time frame charts lower than what well this is a 1 hour chart so what's the time frame below That I dropped to a 50-minute time frame now before I get any further just know that the range between this long-term high and this long-term low that range is going to be used for targeting purposes and I'll get into that in a moment but these up closed candles from the hourly perspective that's the range for my hourly order
block inside that range I can be hunting fair value gaps light Bulb I don't need to see the market trade down below the last highest up closed candle I don't need that because I understand what I'm looking for inside Market structure actual Market structure not just higher high higher low I'm looking at the underpinnings of the marketplace and I'm examining what is it doing High to high low to low within a higher time frame premise remember the premise was we were Going to go up to this upper level level here rebalance and then eventually trade
lower down below sell side liquidity in this fractal I'm using this one here just to illustrate the idea so in other words up here it's going to make a short pattern something bearish to get short on then work towards going down to that low now clearly you can see it here does so nicely but I want to take you into this price action right here before I Zoom in look closely what do you see pause the video I'm not ping at the do ICT and you can't make me all right right in here you can
see a small little imbalance this one single candle like that right there that's the same thing that was occurring in this move here on the hourly chart that gets rebalanced there here we have a small version of it that is a fractal that's something that Repeats on a smaller or higher time frame that's similar in its formation it won't be identical but it's closely related to the general idea if it trades back to this candle High don't worry I'll zoom in in a moment that's your entry right there that's aggressive and I don't have a
problem being aggressive if I know what I'm looking for but there's also an imbalance in here and it rebalances that right there see that now once we Establish the market structure on that hourly chart I'm not going down into the lower time frames below it and marking out all the swing highs and swing lows either that that's Overkill I just need to know what I'm looking for on the time frame I'm trading on the logic is based on that daily chart that it's going up into this imbalance to go lower the hourly chart frames my
trade it gives me what I'm looking for to start hunting entry Techniques now the 15-minute time frame that's the Bell weather this is where it's going to give me the actual get in get out but I might not like the risk parameters that's required on this time frame so I can go down into lower time frames should price go lower and break lower I'm looking at that short-term low here and that INR term low there if we have a short-term low taken out and an intermediate term low taken out or just an intermediate term low
taken out Then we can go back to the previous long-term High long-term low now a long-term High long-term low is generally going to be linked to a higher time frame daily chart that might be a price range it might be a high to a short-term low in this case I'm framing the idea and logic around that fair value Gap that I outlined in front of all of you saying it's likely go up there rebounce and then go lower and take out that old daily Low there's lots of ways you can frame your trade but you
have to have something directly linked to that daily chart because the daily chart that's exactly what institutions are working off of that's exactly what banks are working off of that's where the money is that's where your bias is going to be determined that's going to be what makes or breaks your Trend continuation that daily chart So the majority of your time in study should be on determining where that daily chart's going over the next day or two or a week but you try not to forecast longer than a week not that you can't I'm not
suggesting that anyone can't do that I'm just saying if as a developing student you want to keep your perspective limited to a 5-day time Horizon and don't be upset if you don't have the Entire weekly range forecasted correctly that's not important right now you're growing you're trying to learn how to do this and it's highly technical no one gets it overnight it took me six years so but it pays off if you stick with it so if we have a break below and any return low then we have what a significant break in Market structure
this is something that's more significant just simply than going into a chart saying Okay well it took out a short-term low there it is uh-uh see how much more detailed this is what this tells me is then I can start using this range high and low and start getting projections down I can get a measurement of measuring this High to this low and start replicating that going down and it'll give me price targets they're generic price targets if you don't want to use that targeting Method this long-term low to interterm high if price breaks below
here as it does here you can simply take your Fibonacci anchor it to the highest high down to the lowest low and this is what you would get here why am I using that why am I not using this here to here because this returned back up this is where all of this move starts right there this is just the beginning of the the framework this is where the swing begins on the Decline follow what I'm saying I'll say it again this high and this low that's your framework the retracement that fails that starts the
decline begins here at that intermate term high so if you anchor your FIB to the interm term High down to that low which is a long-term low the projection is -1 1/2 standard deviation and there's your low how much lower than this can it go that's one way of determining it now I know what you're Asking what is your FIB settings ICT there's my FIB settings okay I don't toggle everything because I don't need all the lines but I'm looking at measurements like this with logic behind it it's not just me randomly going in there
because I get a lot of qu when I was on baby Pips I got lots of emails all the time and people would post in the form why are you anchoring your FIB to That Swing high and not in that swing high and not this swing high this is What I never taught this is what I'm showing you today this is Advanced Market structure this is not something you're going to find in books Mr Williams I'm sure doesn't even know it like this he's rather simplistic in the way he does things that's the only thing
I've really gleaned from him he's he's a legend don't get me wrong but he does things rather simplistic but but because of my background is computer programming and computer science and I Have obsessive compulsive disorder I need to know why things do what they do and I need to know everything now I don't know everything but my pursuit of knowing everything led me to look at markets like this and internalize how what the algorithms are doing because there has to be a rhyme and reason right like to suggest the idea that these markets are operating
under an algorithm and they're going up and down based on and AI artificial intelligence is Controlling this it's not your buying and selling pressure I've said this many times before but if that is true and let's suspend your disbelief if you don't believe there's an algorithm just for the sake of this conversation let's just say for a moment that you do subscribe to the idea if there's an algorithm that means it must follow some form of logic and how does it reference how far to go up and how far To go down it cannot see
your stop it doesn't see Michael stop it doesn't see Renee stop it doesn't see Juan stop it doesn't see Brian Larry that's outside of its capability but it knows where people will have their stops based on these ideas is short-term High short-term low interterm high interterm low long-term Low long-term high and where the imbalances are now I already know right now at this moment right now your heads are spinning you're probably sitting here looking at man this is crazy how did he come up with this and how the hell am I going to use it
exactly you're going to take time learning this line upon line precept upon precept here a little there a little it takes time to do this okay but I got requested to teach Market Structure and this is my interpretation of Market structure because I'm leaning on algorithmic principles that are in the marketplace that can't be taught to you but I'm creating a language so that way you can see it visually in your chart and you can measure and reference certain things not exactly like the gthm does but very very close to what it's doing which in
my mind doesn't really step on anybody's toes now does it so if we're looking at this little shaded area Here I want to zoom in now and get down to the heart ofest teaching this is the same 15-minute time frame and just zoomed in a little bit more this is an aggressive entry for going short now that hourly chart was showing those two candles going up in the 15minute time frame it's obviously more cand so in this up close candle series of 1 2 3 4 five candles in that range if I Get a fair
value gy form with a breakdown like this notice I don't need a swing low broken notice that on the model I'm teaching you you have to look for what the short-term low being broken that's your Market structure shift then you see price go up into that imbalance and then you can go short or vice versa when you're going bullish if you understand Market Structure with this perception looking at it from a higher time frame and anticipating a breakdown but then starting to classify each imbalance and swing high and swing low inate term highs and lows
are formed at the rebalancing of an imbalance everything I already said in the video okay I'm just reiterating if the intermedi term high is not higher than two short-term highs that is telling you that the market is Very weak and the algorithm is tipping its hand to those people that are looking at it like this who would be looking at like this smart Money traders someone that's not looking at a chart with harmonic ideas nothing Elliot wave they don't even look at support and resistance that's not a factor that's not a factor at all when
Bank Traders sit down they're not looking at support and resistance They care less about a trend line they don't care about moving averages crossing over none of that stuff they're looking at imbalance rebalance and liquidity that is it that's it that's all they're doing now framing that within the context of Forex they would be utilizing the fundamental idea of interest rate differentials which I'll talk a little Bit about not in this lesson but I said we go into Forex but right now we're teaching price through this medium and index Futures but this stuff works in
Forex period okay there's no reason to question whether if it's just only going to work in this it works in all markets this is your aggressive entry you don't need a swing low being broken because you have the idea based on Market structure suggesting that this is Exceedingly weak if it's exceedingly weak that means the next short-term High how do I know it's going to be a short-term High I don't know because I'm studying the up closed candles because that's going to be an order block later on now everybody else knows how to look at
these candles after it goes below it and comes back up and bumps the bottom of that right there so the bottom of that rectangle that's the classic ICT bearish Order block the advanced interpretation of an order block would be using Market structure like this which is unconventional but you start seeing the imbalances inside the order block when you're already expecting it to sell off see this interent term High I already know that this rebalance here classifies this in my mind as an interent term high that means it should not trade above that High just like
this short-term high and this short-term High did not trade above this interent term High why is this an interent term High when it didn't even rebalance anything didn't think I'd get to that question did you he's reading my mind here's a long longterm High here's a swing High over here a swing High over here see that long-term high right intermed term High short-term High short-term high or if you want to use This one I'm using this one not classifying this one because this is energetic it moves lower you could have easily had a short-term High
marker there but I'm using this one because it has that run lower to rebalance the IM term High has a lower short-term High to the left of it and a lower short-term High to the right of it so intermediate term highs there's two classifications it is a short-term High that has a lower short-term High to the Left of it and a lower short-term High to the right of it or and this is the main one here it trades back up to rebalance and imbalance that immediately becomes an interm term high now the usefulness of that
is if we're bearish and it rebalances like this the next shortterm high should be lower than that intermed term high if it trades higher than that then your trade ideas probably flawed Don't force that trade again wait for Market Structure to get back in sync with what you're expecting something bearish that's how you keep from blowing your account or forcing your will in the marketplace now let's go back into the order block inside these candles as it's going up I'm looking at lower time frame TR and this is a 15-minute time frame we see it
break down it doesn't take any short-term low out but it's inside these up Clos candles which is an hourly order block of two candles Each the imbalance trades up into that's your aggressive sell your stock could be right above that High classic lowrisk High confirmation short entry is the classic return back to an order block after a trade down below it here's your little Gap here trade into it there's your short where's your stop Above This candle's High there you Go now you can go down into the charts deeper with your 5 4 3 2
and one narrowing down to a smallest time frame you can see see that the last two candles here right for the turn inside the order block the order block is the Shaded pink box but these last two candles here with The Gap that low is exactly to the quarter point as that candle's high right there don't take my word for it go into your Charts and you'll see that is exactly the perfect delivery to that candle's low what's so why am I pointing to that candle because the order block is one consecutive series of up
closed candles it's not the last candle before the down move you can tell where these folks learned what lessons I taught from and where they pared from but order block theory is much more than just simply the last up close candle before down move or The last down closed candle before the up move that's not it this is it you have the up closed candles together here with the imbalance inside of a larger order block within the bearish market structure because we have an inant term High here then this run up is going to fail
to go back Above This high now I know some of you are like this is too much they there's no how am I going to be able to go into the chart and be able to do this you're not going to right away but you need to go back to your data and your charts and start breaking them down and classifying them like this you have the benefit of hindsight that's how I began to trust it because I would go through old data and start breaking them down and looking for these things right here that's
how I bridged what I learned about how the Algorithm prices and books price and then I made a language within price charts that communicates very closely what it's doing this is the language that I created for all of you to understand what it is I'm trying to interpret to you that have never seen this before the imbalance here it goes over a little bit that's okay but inside this range in here more specifically the order block the hourly Right here that's where your fill would be or aiming with your limit order and the heat on
the trade would be on this candle's movement there but your stock would be above here but you're aiming for a very large downside objective so the risk from entering here at the bottom of the hourly bearish order block which is again represented by the bottom of that rectangle here you're entering there the Heat or The draw down in the trade is limited to just that candle but your stop has to be here and you're expanding lower for a Target that's many times over what your risk is dropping down to a 4-minute chart here's that same
order block from the 5 minute perspective it's a little skewed now because we're looking at four minutes each candle's four minutes in duration Market trades up into that hits it perfectly not that it's link anything On the 4-minute chart but it's lengthed again to that 5minute chart hits it right there beautifully trades lower comes right back up trades into the top end that fair value gap on the higher time frame before we started dropping down we have a little bit of movement above it and that's okay because this Market is very volatile right now you
can't demand the markets to always deliver with this level of precision Sometimes you get this little coloring outside the lines and that's okay that's a matter of experience and time studying it and doing it you anticipate a certain measure of imperfection and still submitting yourself to the idea that just because it went above that level doesn't mean it broke it and it's going to keep going higher it's likely to do that and if it does don't freak Out then the market trades lower and reaches where there's targets now what I want you to think about
is when you see these patterns for entry now ton I taught you how to look at Market structure from an advanced perspective I already know some of you are going to be very confused by this lesson and I understand your confusion but that confusion is reduced by you going in and looking at Price data and start studying it and looking at It the idea is this when you see an imbalance get rebalanced the high formed as it rebalances that high should not be violated by Price going higher than that if you're bearish if you blend
that with institutional order flow what is institutional order flow when you're bearish all of your up closed candles should keep Price from going higher than them what does that mean we have an imbalance here the market trades up into the bullish candles that were on the five minute chart we're on a 4minute chart that's that red level here let me go back up to say you know that's this one here this is a down close candle right there these are the last two up close candles before the displacement here and then balance Market trades back
up into that right there there's your bearish order Block it's aggressive but if you know what you're looking for that's very very fun to do that on the 4-minute chart there's that same return back to that 5-minute beish order block Watch What Happens Market breaks lower so we have up close candle and up closed candles the market trades higher yes but does it overtake this up Clos candle no it just trades back up into it a little bit but doesn't Go above it wow that's important because if it doesn't overtake these up closed candles here
or here it doesn't even need to get to these because it hasn't even overcome this one so it acts as real resistance that's institutional orderflow your Market when it breaks again from the consolidation in here all of these up closed candles never get reached into again here at all but notice what we got over here we have up Closed candles the market leaves it then it comes right back up does it overtake these up Clos candles no so it's going to remain heavy so in short I've taught you tonight to look at the markets from
a market structure perspective by breaking down the price swings labeling them specifically in inbalance that's rebalanced that intermediate term high or Low should not be violated that's a key high or a key low that sets the stage for a market move at that should unfold and deliver to a higher time frame objective in this case as we outlined in the beginning I showed you last week in the week before that that we were looking for weakness in NASDAQ to take out its daily low if you combine that logic with Market structure and the imbalance rebalance
becomes intermediate term Highs and lows those key highs and lows with them not being violated if they are violated that means your idea is wrong and you cancel the idea and you don't try to go in and force it again and overtrade and blow your account while the market is moving in your favor you're going to continue to trust that move and hold on to your trade because if you're bearish up Clos candles should keep price below it or them if it's multiple up closed Candles they're speed bumps they may come back up and touch
them and act as a what bearish order block but you do not want to see them traded above if you're bearish and vice versa if you're bullish when price is moving higher generally the candles will be predominantly Green in my case because I'm looking at Green candles when it's going higher whatever your candle color is on your platform predominantly there's going to Be more up closed candles when it's bullish but down closed candles should support price if it trades back down to them them it's going to act as a support structure for an order block
so I've given you two mean components to Market structure and institutional order flow how to know when the move is still good and not be afraid and how do you know when the move is likely to be dynamic and how do you know when the idea is probably flawed And your interpretation or your analysis is wrong if that intermediate term high or low is broken after your trade idea becomes possible if that in term high is broken and you're bearish then you got to move through the sidelines and don't go in again wait for more
setups in the future it may be in the same trading session or it may be in the same trading day or it may require you to trade in the following week you just can't force it I Taught you institutional order flow which is again I've already mentioned this in the previous lessons where we we're bullish and we're expecting a price swing higher generally there is not a lot of down Clos candles in that price swing higher but those down closed candles should support price should it trade back down into them and not see them overlapped
in other words going down below it if it does it's only Permissible if there's a short-term low in close proximity to it and it's then lik like just go down and take out some sell stops if it's bullish and then reaccumulate and go higher if there is no swing low there would be no swing low with cell side below it so there's nothing to concern yourself with just look for down Clos candles to support price higher so in other words price swings that are bullish down closed candles are Your support in price swings that are
bearish up Clos candles are your resistance now if you blend these ideas together you get a perspective on price that cannot be gleaned from other teachers Educators Traders authors gurus or whatever but these are my responses to folks that ask me how do I know what swing high and what swing low to use as you can see it's not a question that I can go in and say in one simple Statement this is what I'm doing it takes takes deeper thought it takes study and it has to require supportive lessons that there's still going to
be needed for the majority of you that are sitting here listening to me and you're saying okay I can see what you're saying I can see it but there's no way I would have came to that conclusion on my own nobody would expect you to you're too new you haven't been doing it enough and frankly I've never taught this before this is what I've kept close to my V but I want to give and I want to share but you're not going to understand this in one lesson but because I am trading and I'm sharing
and I'm teaching I will show you more examples that way you can see the logic behind it but I want you to go back to your charts and look at every time the market rebalances classify that as an interterm high or interent term low if it's you know with a rebound That's been moving higher than went down balance that and then watch how prices stay away from violating it and if you can frame a context around a price swing that's linked to a higher time frame chart like the daily then you have a wonderful model
that has higher time frame order flow behind it that is Paramount for your trade to work if you can't see it working or following suit to what the Daily chart's likely to do or in layman's terms if you're trading against what that daily time frame or daily chart is likely to be doing you are absolutely asking for failure you're asking for it you're begging for it that's not to say that you can't go long when the daily chart's going lower but why would you want to why would you want to swim against the Tide why
would you want to be the salmon the salmon that fights its way up against the current just to get to the top of the river spawns and then dies you got there but failed in the end you want to be working with the tide you want to be moving with the EB and flow of these markets on a high time frame because that daily chart if you understand that daily chart let's go back up to it If you're doing all of your analysis and linking your trade ideas based on the logic behind this time frame
here you're going to avoid a lot of losing trades now you're going to lose you're going to have losing trades I have losing trades but you're going to avoid the silly mistakes that the majority of retail Traders make you're not going to to See why on a 15-minute time frame or a 5-minute chart why it's not turning around and reversing intraday when it feels like it might be doing so because you'll have these small little you know quick Dynamic little Pops in the direction it's counter with the daily chart suggesting those are just little traps
they're little moves that get people caught up in oh it's going to go reverse let me get and Chase that and then it Just creates another selling opportunity when the daily chart is like to continue going lower so you have to submit yourself to what this daily chart is doing what's it reaching for and when it reaches it stop get a lay of the land again check your barings which is what I'm going to close this video with now we were up here we rebalanced I said all of this Here is just normal for us
to anticipate a run down below here this is is this rebalancing for another leg lower to go down here so we have had that in price it's delivered but now we're back above that low so what does that mean for us well on the daily chart it's been bearish but we're back Above This Old low that is in my mind do nothing we're neutral right now why why would you be neutral can you Still be bearish yes can you be bullish if you want to go against the trend of the daily time frame well it
just brings with it a greater measure of risk now there's going to be times where you can go back in the charts and say but yeah look at this time anybody can do that I'm looking at the hard right Edge right now and my paid mentorship group is hearing this video Just Like You Are I Am neutral right now I am not taking any trades there's a lot of things going on globally there's a lot of confusion right now money is Running Scared in the marketplace and I don't see where we're going next with a
great deal of certainty so what did I just say to you publicly I don't know what are you say ICT just said he don't know something he doesn't know what the Market's going to do right Right now I don't know so if I don't know and if I can't classify it based on the things I'm looking for in price yes it could possibly go a little bit higher this could be the low it could be some kind of reversal they could you stop doing what you're doing over there in Europe and in Ukraine and everything
becomes happy and nothing happens bad again for a couple months and the markets go higher I don't see that right Now I don't know if it's is going to continue going lower where it's at right now neutral because I can't justify it one-sidedness okay this is how I teach my my pay group the things I teach them if you can't go into your charts and line up an idea that's bullish and have no way to frame it on a bearish stance in other words if you can very easily communicate It in your analysis that it's
likely to go higher but it's a real hard stretch to sell it for a bearish idea that's high probability if you can frame it bearish but have a hard time defining it in a bullish perspective that's high probability now how many trades have you taken in your time as a Trader where it could go either way but what the hell I got time I'm in front of the charts let me just get here see what Happens and you enter a market and then you lose what happens after that you have a lot of regret and
you know what you're thinking I don't even know why I did that that was dumb why' I get into the marketplace everyone's done that everyone has done that and I have blown accounts doing that 1990s I was Reckless did whatever I wanted to do and none of it was really hinged on Sound Logic it was me discovering risk because I didn't Respect it when I first went into it but I found out real hard that it hurts and you don't want to go through that so this brings this lesson to conclusion tonight and I am
absolutely certain that you have a Litany of questions and concerns and confusions all of those things get answered over time spending time with me looking at examples and you'll see it over time it cannot be understood in one Lesson it absolutely cannot happen and I know some of you young guys are going to want to post in the comment section I understand exactly what you said I've seen this 15 times before don't I I don't look at those messages and think to myself wow and I'm not going to let that message be posted to the
video comment section I'm not looking for you know messages that fluff me up I'm just looking for ones that I like okay And if it's something that I think that would be been official to the community I'll use it but if it's something I just thought it was funny or useful that's the one I like out of all the comments it doesn't mean that all the comments that were not selected were useless or uh less important because some of them are questions I am using your questions in the way I'm teaching so that way I'm
covering a lot of the bases that you Guys are saying I'm stuck with understanding this but just know that there's a lot of the questions that you're asking that will be answered in the normal progression through the lessons I have planned for you it may not feel like it it may feel like you're being ignored or that I don't care about your question or I'm somehow avoiding it because I don't have an answer I have answers okay I have answers to the questions you have not had aise in your Thoughts yet but you just got
to relax and go through the natural progression of it this is very technical stuff folks very very technical you don't need to be this technical but I was asked to teach Market structure and there's a lot of folks out there especially on YouTube that pretend to know about Market structure but they have no real idea what they're doing the only thing they're explaining is what's already Happened in the price charts I'm showing you something in Greater detail what I outline to every one of you in this YouTube channel everyone in this YouTube channel watched me
outline this market right here and it moved 14,500 points based on that logic that's a lot that's a very significant price move and it behaved exactly how I'm teaching it to you that should Be reassuring number one but also it should be intriguing because if I'm able to sit down with you and this was not a CH how many times have I put out suggest sus either in the comment section of my community tab or in video how many times have I said something and it didn't come to pass they're not cherry-picked I'm showing you
things that are based on the logic that I'm teaching you okay so it removes the necessity for Blind Faith Okay don't believe me because I'm ICT believe what I'm teaching you and that you're seeing in the charts yourself when you're back testing and watching it it live that's where the proof is discovered cuz I can do this every single day and there still going to be people that's going to doubt and the folks that are convinced already they don't need any more Assurance they just want to learn and that's what I'm doing I'm teaching you
I'm teaching you exactly what's going on on that hard right edge of that chart and right now at this moment I'm teaching you a greater lesson when not to do something you may have an account open you may have time to be in front of your charts you may have an idea some kind of inkling that you think the Market's going to do this or that I'm telling you personally I am not touching this at all I'm not trading Forex I'm not trading Futures I'm not trading crypto I've never traded crypto and I'm not touching
stocks I'm not touching bonds I'm not trading anything right now I'm going to let the rest of February transpire without me engaging it's done exactly what I outlined for all of you it was a nice price move it was logical it was precise it delivered exactly as I outlined beforehand and tonight I taught you the internals behind that in a very Structured detailed way your infancy as a student under me is going to be an impediment to you understanding everything and even my paid mentorship group are probably scratching their heads tonight too because there's gaps
in their understanding because I just literally introduced this for the first time they have they don't have this in any of the lessons they had none of them no one has seen me teach this it's the first time I'm unveiling what it is when I look at Market structure what is it I'm doing how am I framing things I'm using a top down approach from the daily down to the lower time frames but the time frame I'm framing the setup on which was the hourly chart using higher time frame logic and the order flow in
other words I'm bearish because that daily chart suggest that it's going to go down below here when it Was up here this went down too quick and why do the market even creating a fair value got why does the market go up here because this Market dropped one-sided right here it just went down there wasn't a lot of give and take back and forth It's one candle that went down like that because it's one candle it's one day one interval it's going to have the likelihood not it must always not that It's going to do
it immediately but the expectation is it's likely to go back back up into this area here with an up candle balancing out the movement lower it's going to go back up to offer buyers an opportunity to buy at those prices it matters not if those buyers are correct in their assumptions about this Marketplace the algorithm is allowing efficiency for Price delivery and in layman's terms it means it went down to too quick it wasn't Offering enough time for anyone that wants to buy it so it goes back up once it does that it rebalances right
there spends a little bit of time and then displacement again and then right to where we outlining it the question I want to leave you with is this why does it respect the levels I'm teaching here in the logic from imbalance to liquidity if everything is based on trend lines Moving averages harmonic patterns Fibonacci this Elliot wave that if those things were real and they had factors that really made price go higher or lower answer this for me this is the riddle you need to figure out okay how does the market know which discipline it's
going to f follow any given day is it going to follow harmonic animal patterns or is it going to follow Elliot wave or is it Going to use supply and demand or is it going to use volume profile is going to use white cof is it going to use the patterns that's found on range bars is it going to use what's in ichimoku you getting the point it all of those disciplines do not agree all of them they're at odds with one another one discipline's going to say wait for this one discipline's going to Say
wait for that so how is it that the market determines which discipline it's going to use for that given time period or that day that's nonsense that's you being religious any of you that subscribed to those ideas and I did you are under a faith-based premise that what you're learning should work when it's not based on any of those Things the Market's only book and print these candles based on two principles liquidity going above old highs for buy stops going below old lows for sell stops or rebalancing or creating imbalance so it's imbalance rebalance run
for liquidity that's it it does not do anything else the algorithm is not looking at harmonic patterns it's not thinking well you know I haven't used a Bat pattern in a while so let's drive them batty it's not thinking I want to scare the living hell out of them and create a shark pattern it's silly it is silly and I know some of you trade like this okay and I'm not trying to make fun of you I'm just asking you to be highly critical about a perception of what it is that we as Traders do
and how much a fallacy it Is when you strip all that stuff away and it sounds like I'm biased because this is what I'm teaching you but noce what I'm doing I gave up millions of dollars a year to come out here and teach for free I could still be making millions there's many of you are still asking can I just join on your page no you can't join be happy I'm teaching I'm teaching mentorship right here come on what's in it for Me I'm already rich I already know how to trade a lot of
people like what I do I don't need to be doing this I just enjoy it but why is the market doing what I teach so precisely so consistently maybe it's because this is the market maybe it's because this is the algorithm I'll leave that with you to decide enjoy your weekend be safe and I'll talk to base with you on Tuesday