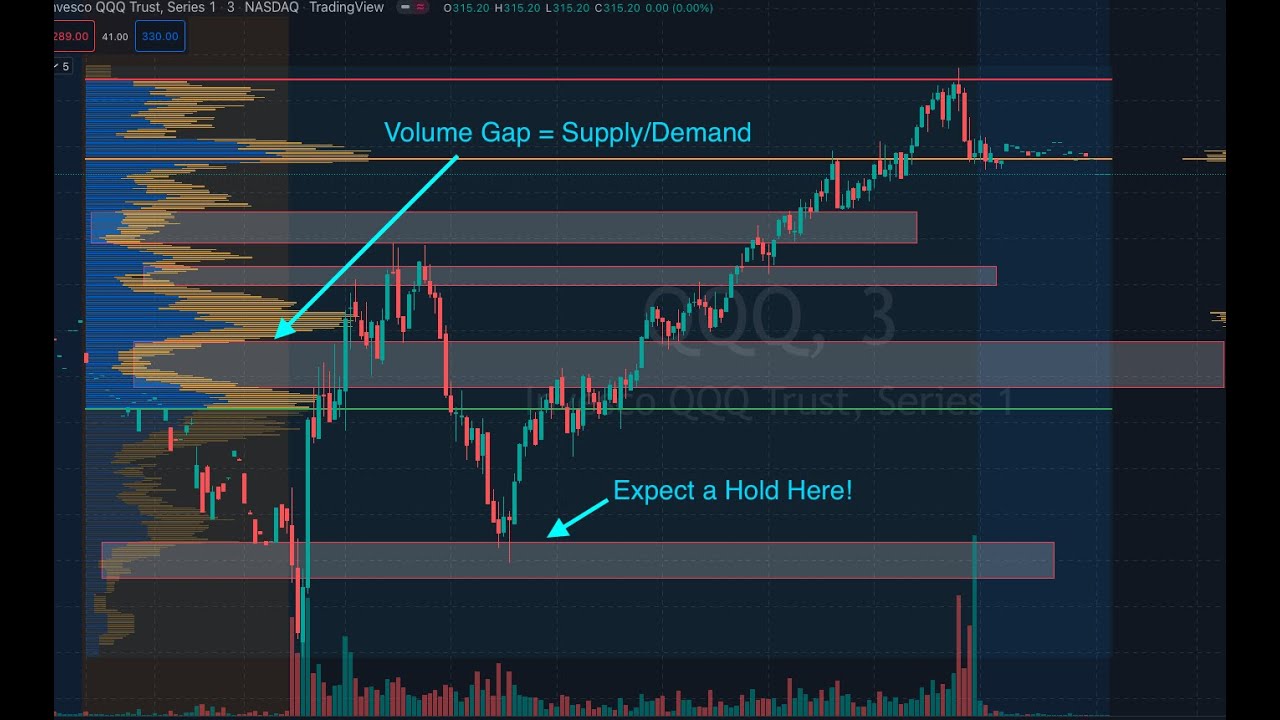
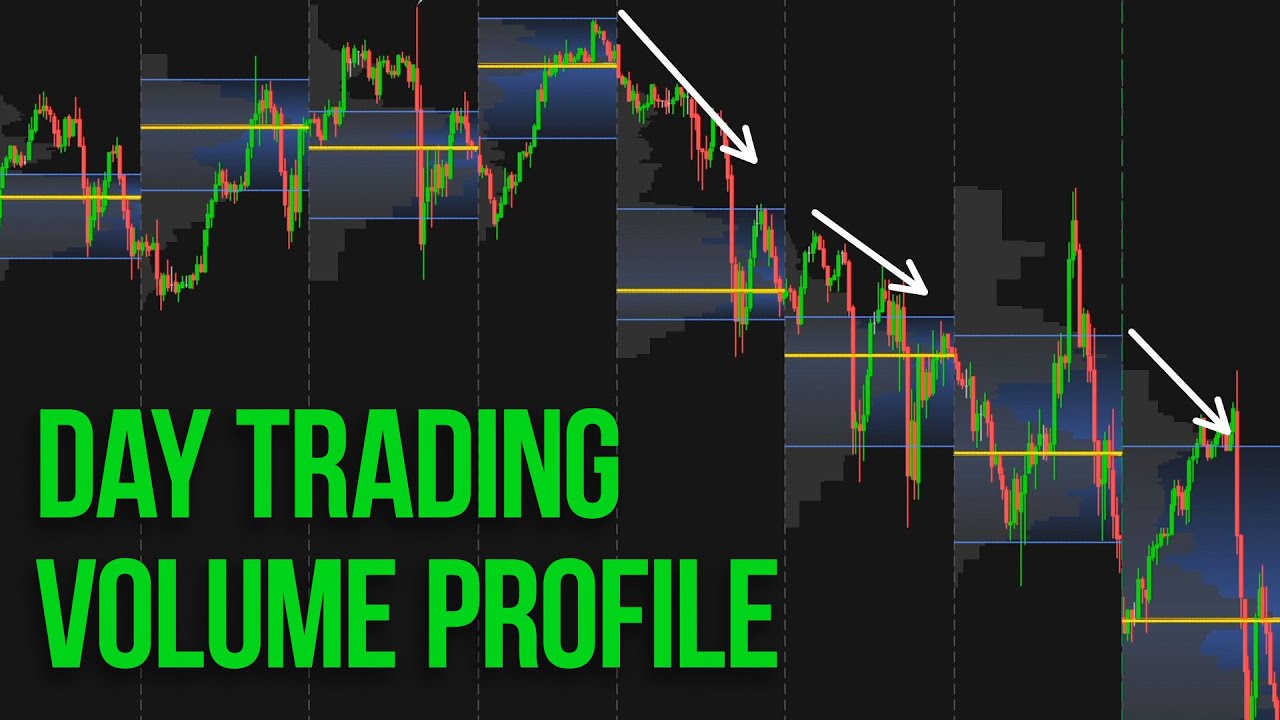
to the questions that we're constantly trying to answer as we are identifying where value is developing is where is Price being accepted and where is Price being rejected think about Acceptance in terms of presence and volume so when you look at an individual rotation so an individual daily session where price is being accepted the most is within the value area so where seventy percent of the volume took place from a present standpoint and a participation standpoint since we're looking at both the TPO and the volume profile within the structure so where price is being accepted
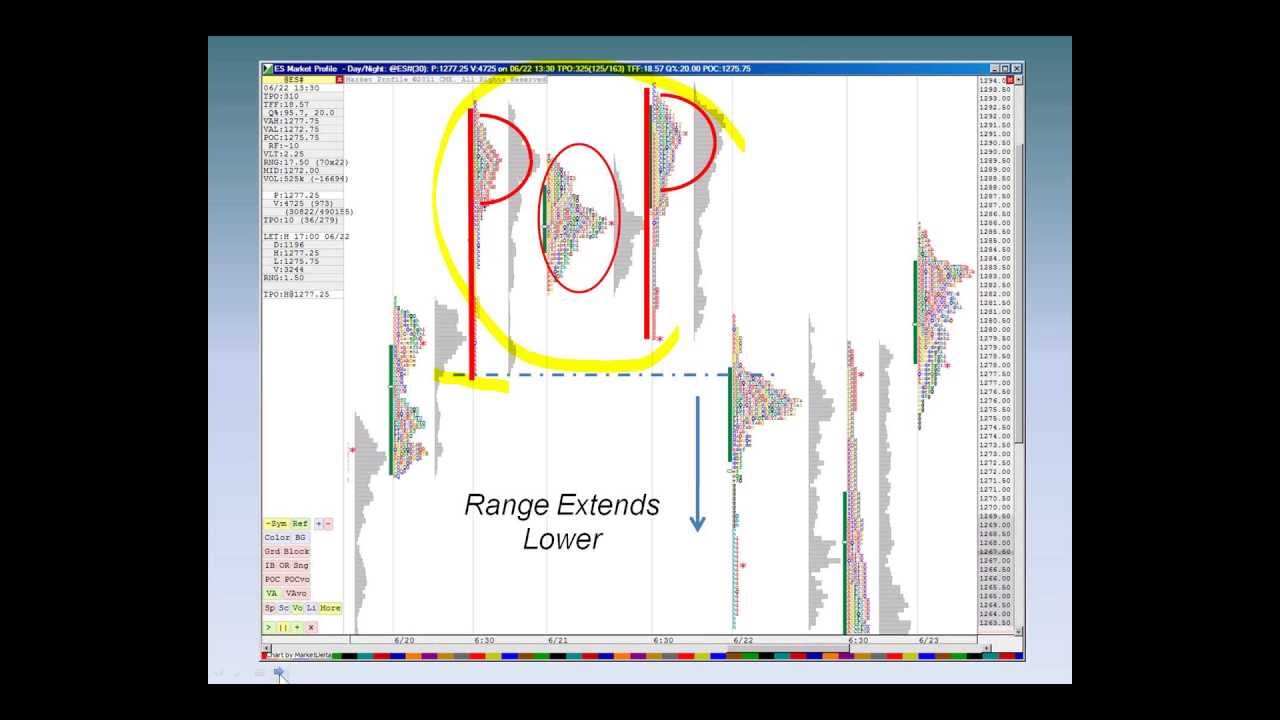
meaning where it's spending the most time where buyers and sellers are in most agreement where they are most balanced where there is most two-way trade that is where price is being accepted now that's on an individual day if we were to combine multiple profiles within a range of acceptance so remember if we look at a structure like this every day might not be balanced but we could say that over the course of these four days price was in relative agreement within a range so when we look at this structure and let's say that currently we
are closing out this day right here so let's imagine that this following day none of this has transacted when we look at how we are in relation to the prior structure we can see that we're still in a generally accepted area we're still within fair value nothing really has changed and from this area we wouldn't be looking for any kind of significant change to occur we would only expect change to occur in areas where we were previously not accepted within so previously where we did not spend much time so where price is being accepted it's
where volume is it's where participation is it's where we are most present where price is being rejected is pretty obvious right it's if you're looking at a Candlestick chart it's where you have a ton of Wick right where you have a large Shadow or a large Wick if you're looking at these individual tpos we immediately know a few areas where price is being rejected right so if we for example let's just look at the single prints so we know that from this general area price has not been accepted below this low price has not been
accepted at these previous levels up here price also has not been accepted so we have some areas immediately that we know did not allow us to spend much time with it not much volume was transacted in there was not much two-way trade whatsoever it was very one-sided and to the upside it was very one-sided on part of the sellers to the downside a little bit less one-sided right we have a smaller tail we have more tail at the high but it is rising so you could say that yes price over time is being rejected higher
but there's very clear areas of rejection to the upside side so we know where price is being accepted we know where normal behavior is anticipated and now we know where price has been previously rejected so what we were looking for rather what we're going to be looking for is a change in Behavior right so moving forward we see okay this level between 6800 and above is a level where we previously were not allowed to interact with right for not much time that's the benefit of looking at a TPO we could see that price barely spent
time in here there was barely any volume transacted in this level so now we have sort of a baseline to compare any future interaction with so what we would do is combine this into a range so we're combining this into a composite and ultimately what we would get is something that looks like this right ultimately this is the area that we were confined most of our time within we had some presence above here but the next day that we transacted through this level we were completely rejected again so we have a general area within this
range where price has been accepted and if we combine these we'll see that even this drawing is even this loose drawing is likely pretty accurate so it is slightly lower but we get the idea this is where the bulk of the activity occurred so now we know that this is the most recent level from which price was rejected so we'll look at this level moving forward now if we get a change in Behavior through this level that's significant right because this is a significant level now it's the last level where price has been rejected so
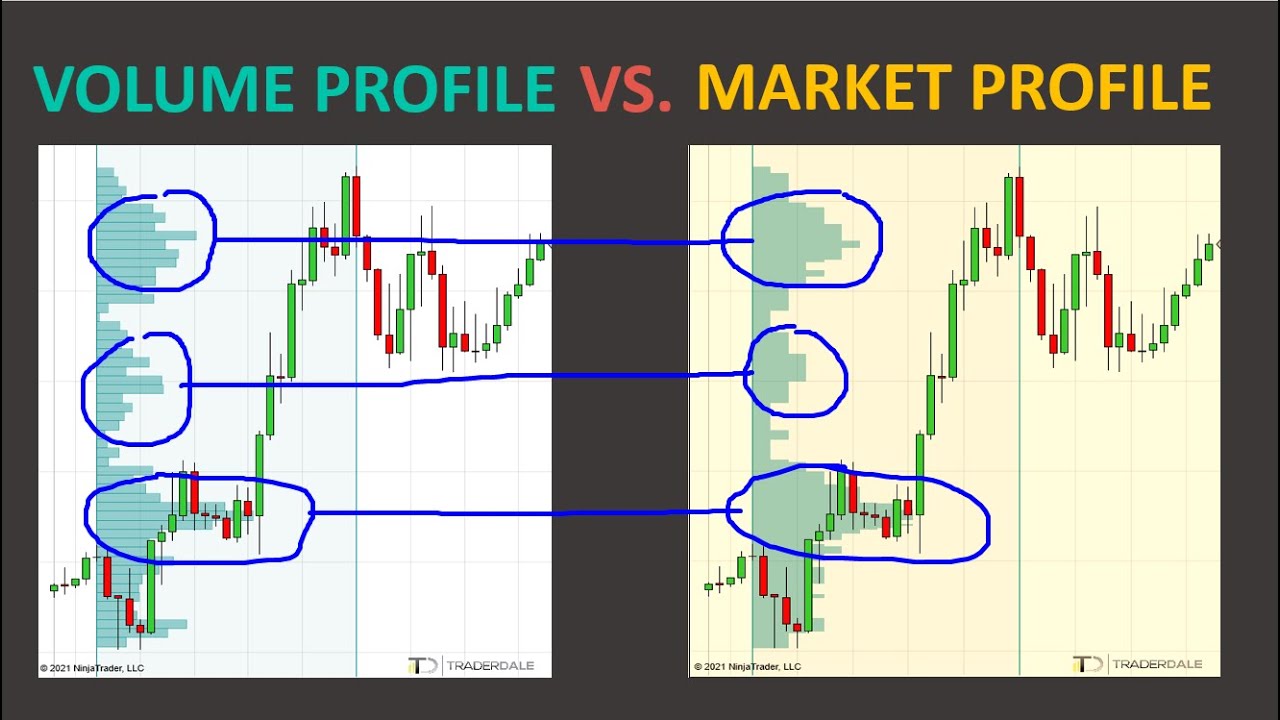
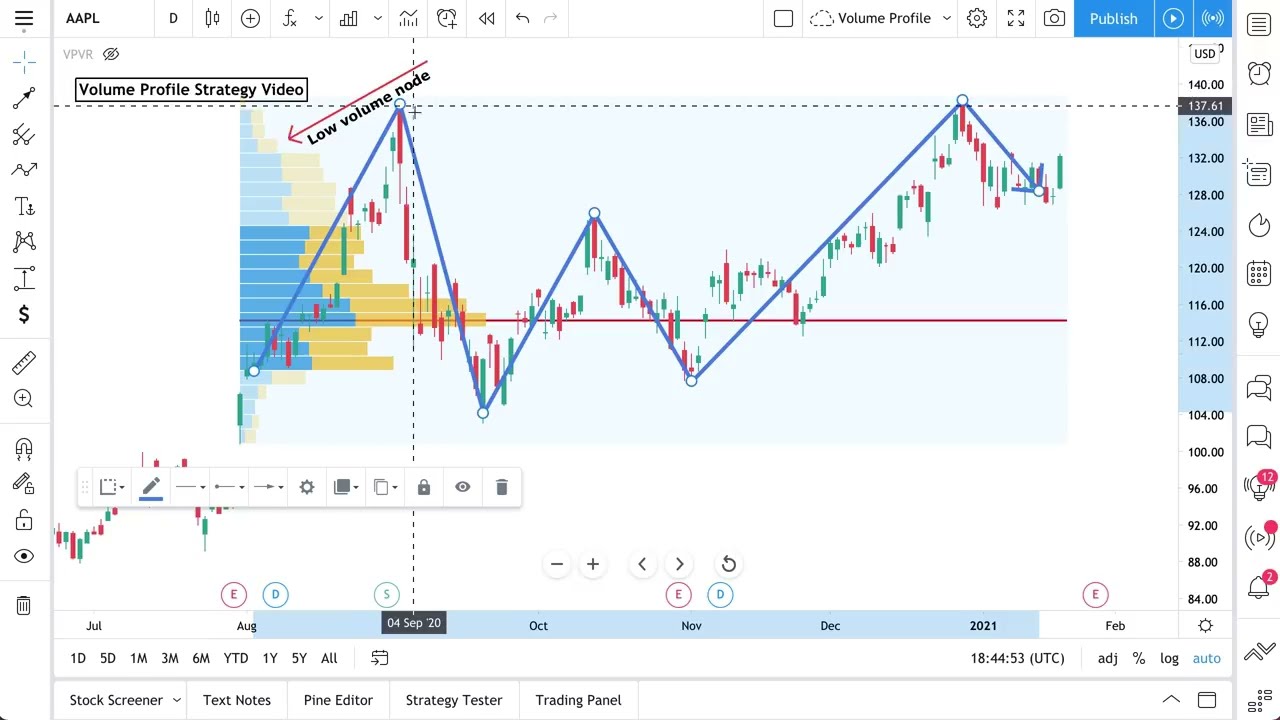
price being accepted what that means is that we are starting to see an increase in volume an increase in the other side of the market compared to previous points so if we see that over here is very one-sided the next time that we're transacting into this level you could see that there is no immediate response whatsoever if we were to open these two up and look at the volume profile for example so we'll open this up we'll see that the volume profile here is also very thin so we're focusing on TPO Market profile right now
but the volume profile shows that there's barely any presence here so this point moving forward things have changed right this is an area where we were previously rejected and now suddenly we have two-way trade we have buyers and sellers increasing volume in this level where previously that did not occur so meaning that as price is moving through a level that previously rejected us outside of balance they're becoming more and more happy you could say to transact at these levels they're willing to do business here rather than spending just a brief amount of time here and
moving back down to where it was originally within this accepted level fair value because remember over time the value area is the area where fair value or rather the area that is closest to fair value which essentially would be the point of control over their structure so acceptance that's where the bulk of the activity occurs right this is if we're looking at this is a perfect range for this example because we have back-to-back days that are essentially inside days for value and then up here you have the same thing so we know that this is
an accepted area right there's a lot that has occurred within this general area prices generally accepted within this level we can see that clearly there's been no attempt towards the high so we don't know necessarily whether we are rejected or have rolled over but immediately when we're looking at the tpos we get an idea of where price uh was rejected because immediately we see something like a tail range extension this is not really two-way whatsoever this was price dropping pretty violently but you have a tail up here you know you get your idea of where
trade was not facilitated where a trade was not necessarily allowed even so over here you have your single prints so this is what we're looking for when we're looking for developing value we're looking to answer these two questions where is Price currently being accepted and where is Price currently being rejected