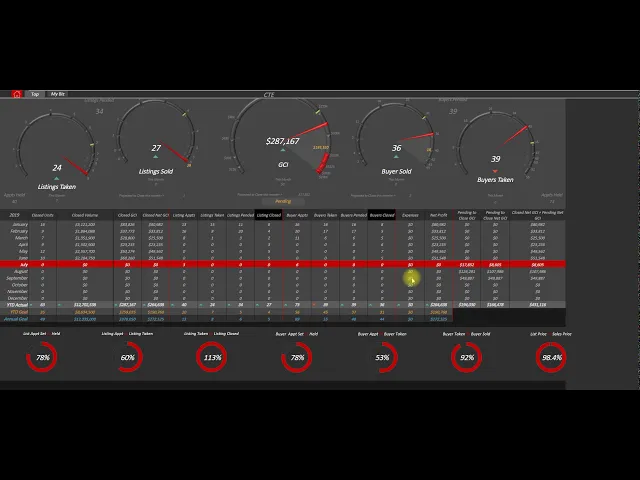
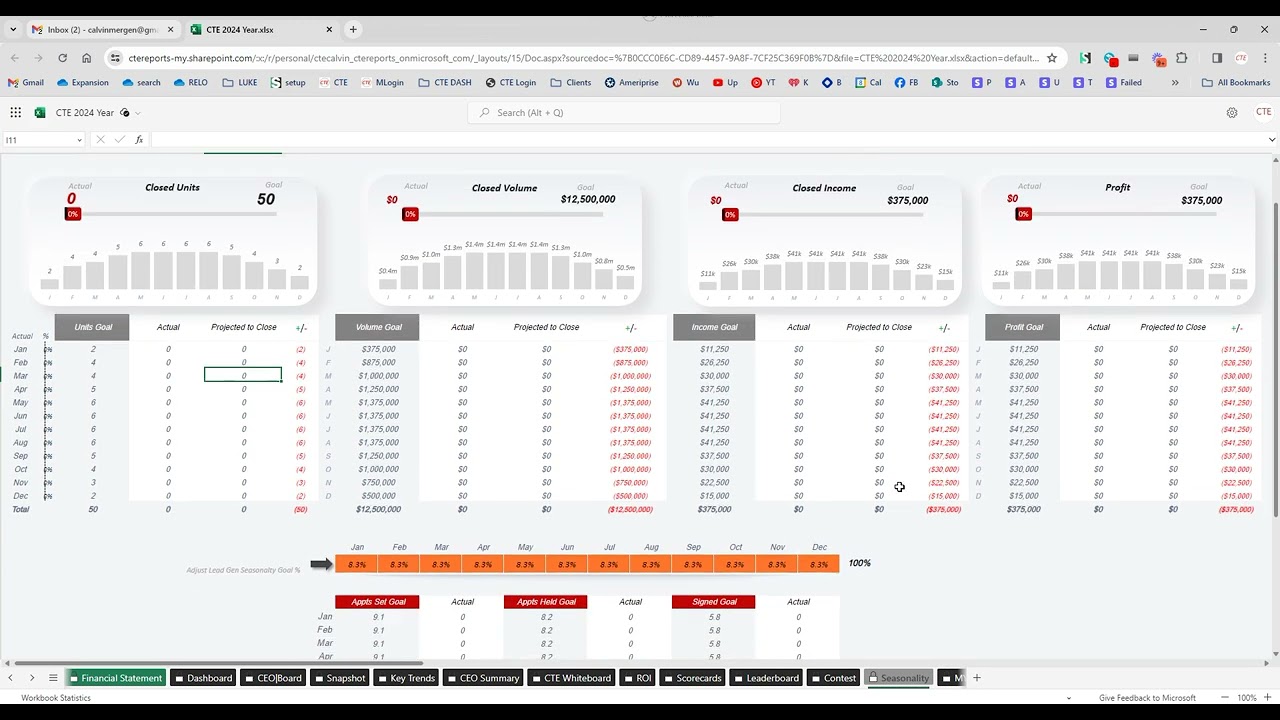
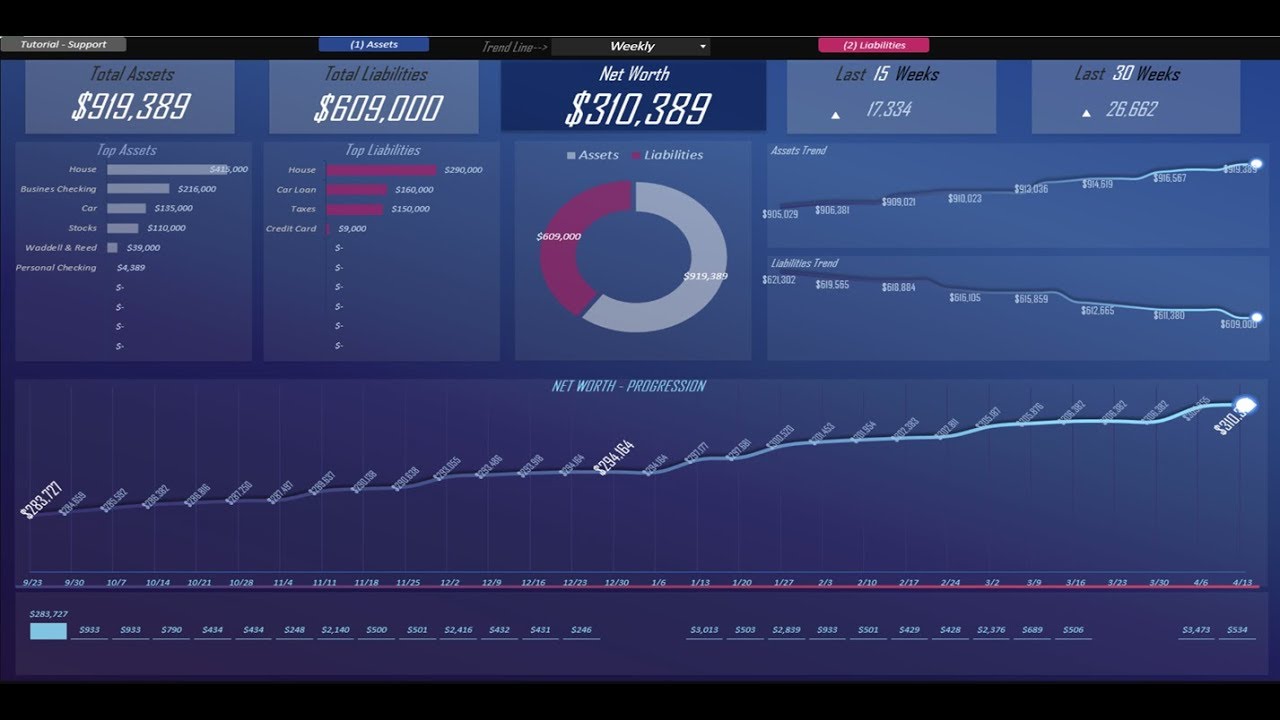
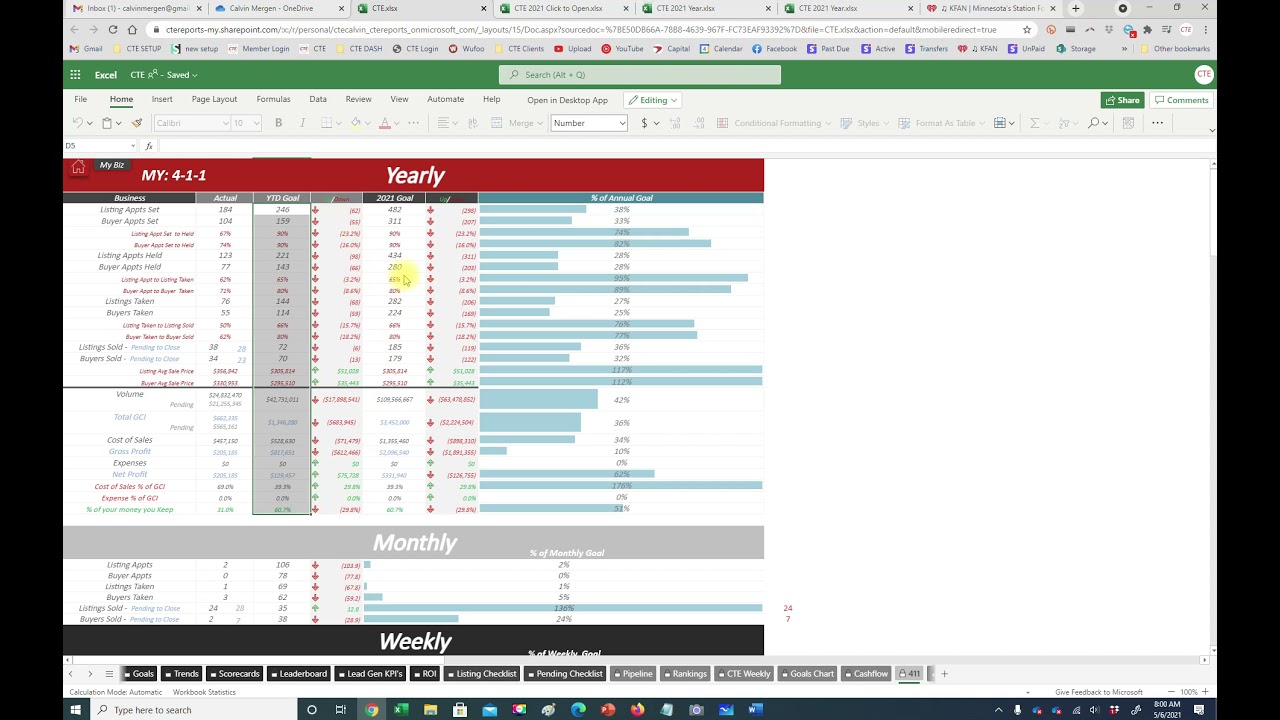
all right guys we're gonna get back to doing a little bit of the reports here and I want to touch on some things here real quick as we are in closing out the month of July on your home page you guys should be able to see real quick where you should be at and where are you based off of your business plan and then your actual closed see if you guys are ahead of pace by the end of July and every month this little needle will move to the next location that you guys need to
be at so you guys can always see if you're on pace to hit your destination and my goal destination is 370,000 and it also gives you an idea based off of your current pace where you will end up by the end of by December 31st so I can see that my goal is 370 if I stay at my current pace I'll end up around 400 16,000 which would exceed my goal for the year so that is a very important number to take a peek at right now to see where you guys are looking at for
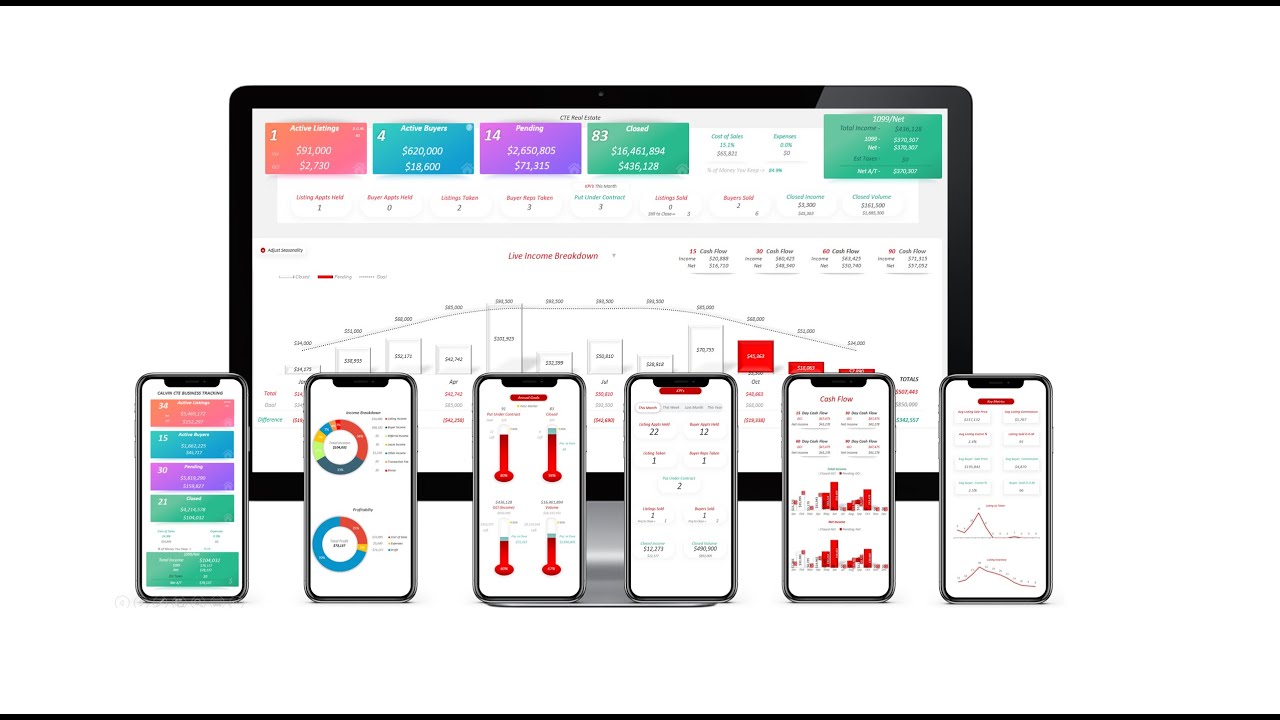
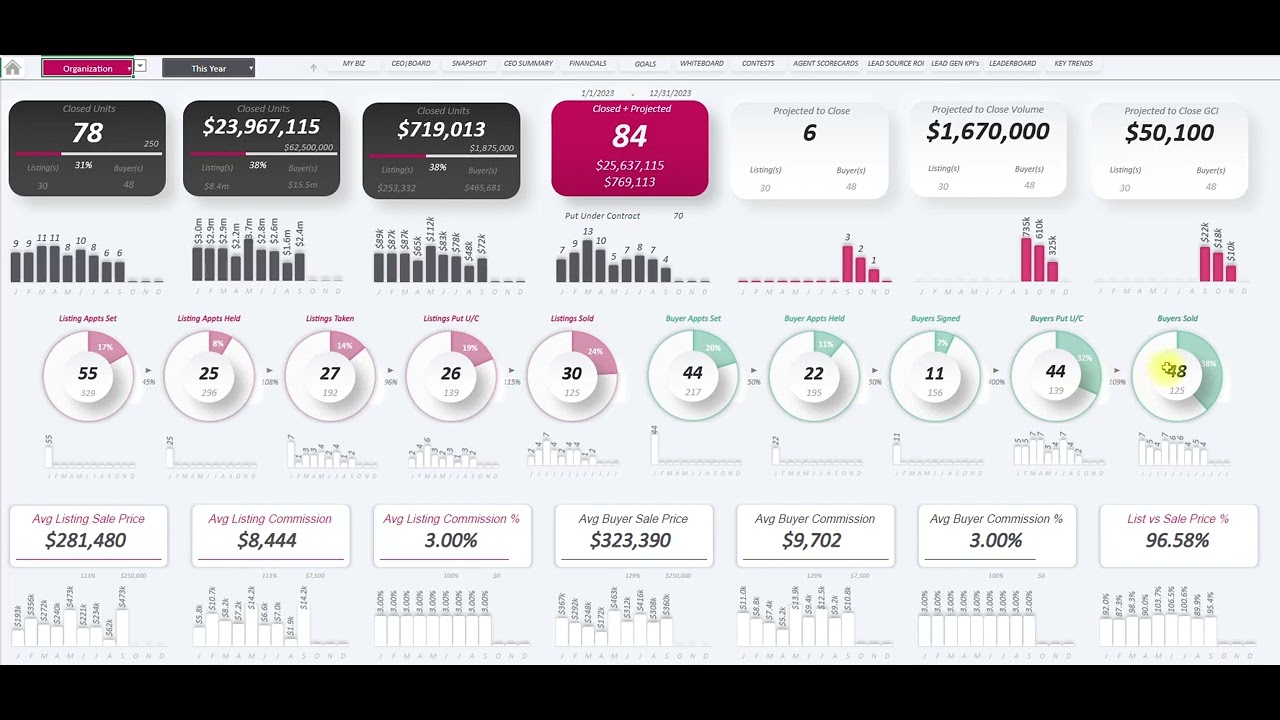
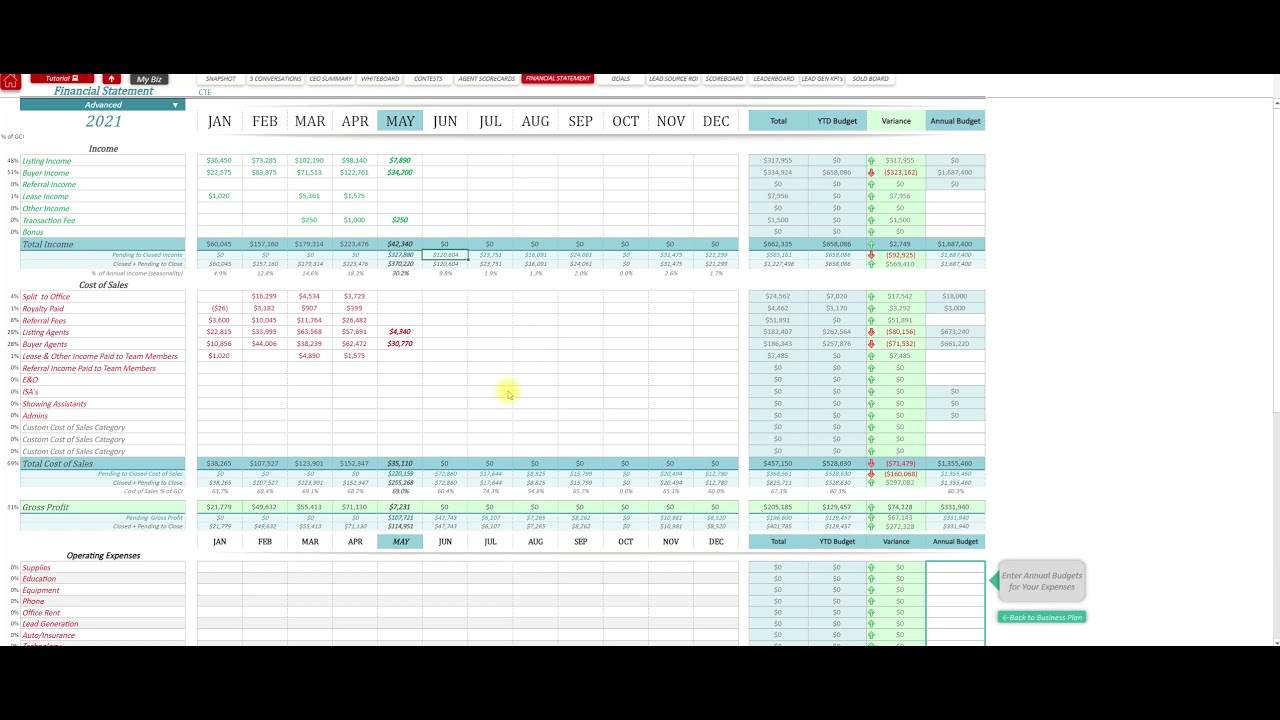
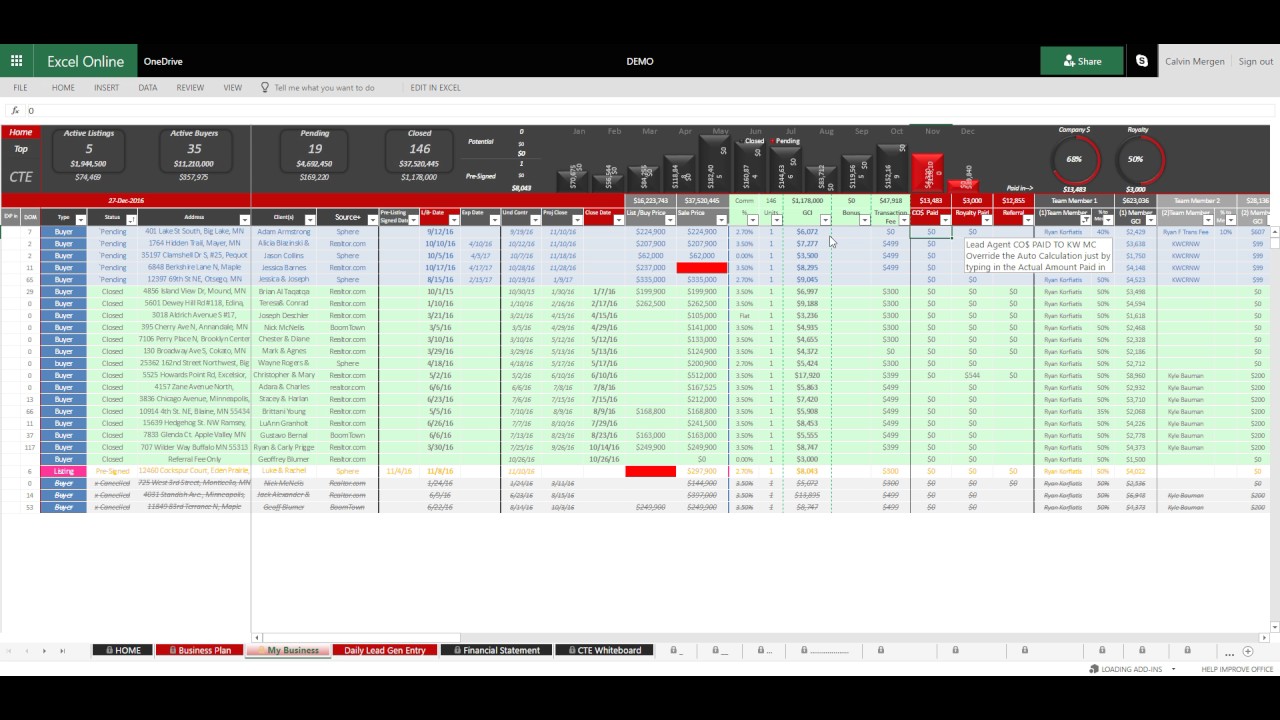
the end of the year the other one I want to touch on real quick here is your CEO summary this has all of your data here so again all of your fuel in your tank is right up here on the top left shows you your pipeline pre-sign active listings active buyers your pending and then what you actually have closed so far this year total income your cost of sales along with the percentage see very important number to know the percentage of your business that is going up to cost of sales if you have your expenses
put in it'll show you that as well your gross profit your net profit you're getting your average listing sale price average buyer sale price and also your average commission right down below and then another thing to look at here that is very important to know of your business is what is my next 90 days looking like so next 15 days it shows me my GCI and then my net 30 days GCI net 60 days and then my 90 days so I can see exactly what's coming into my business over the next 90 days and farther
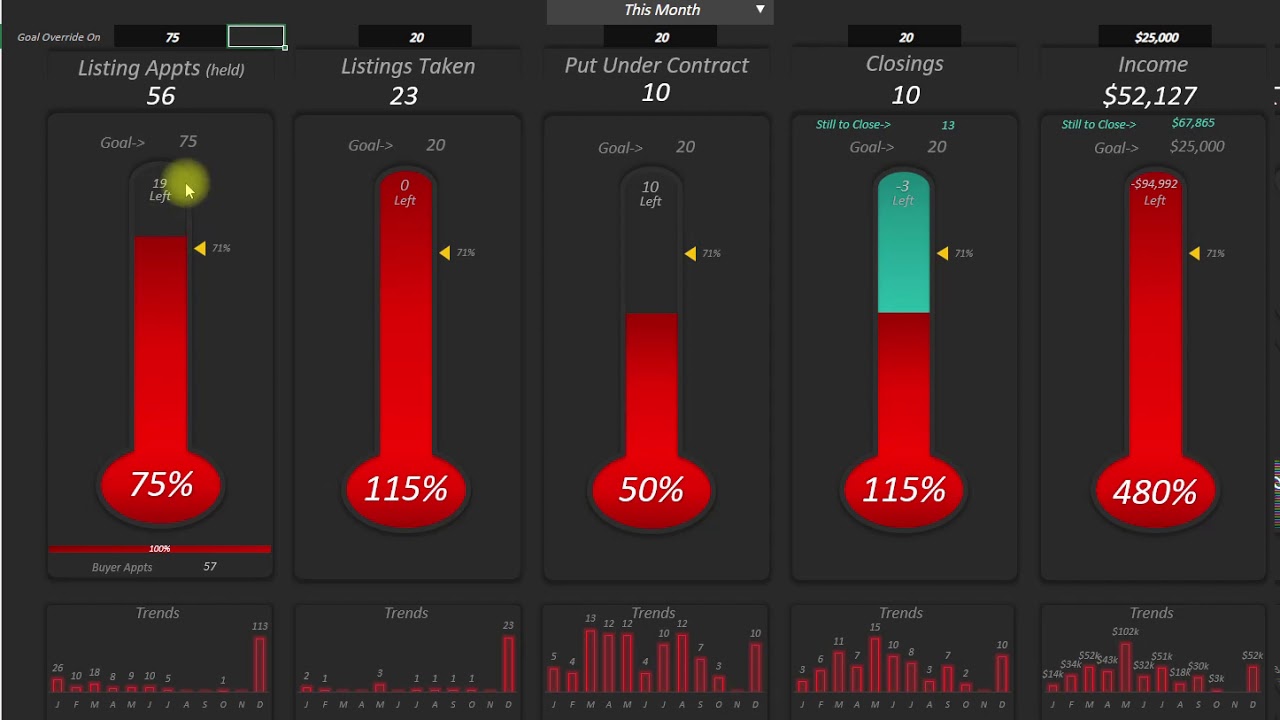
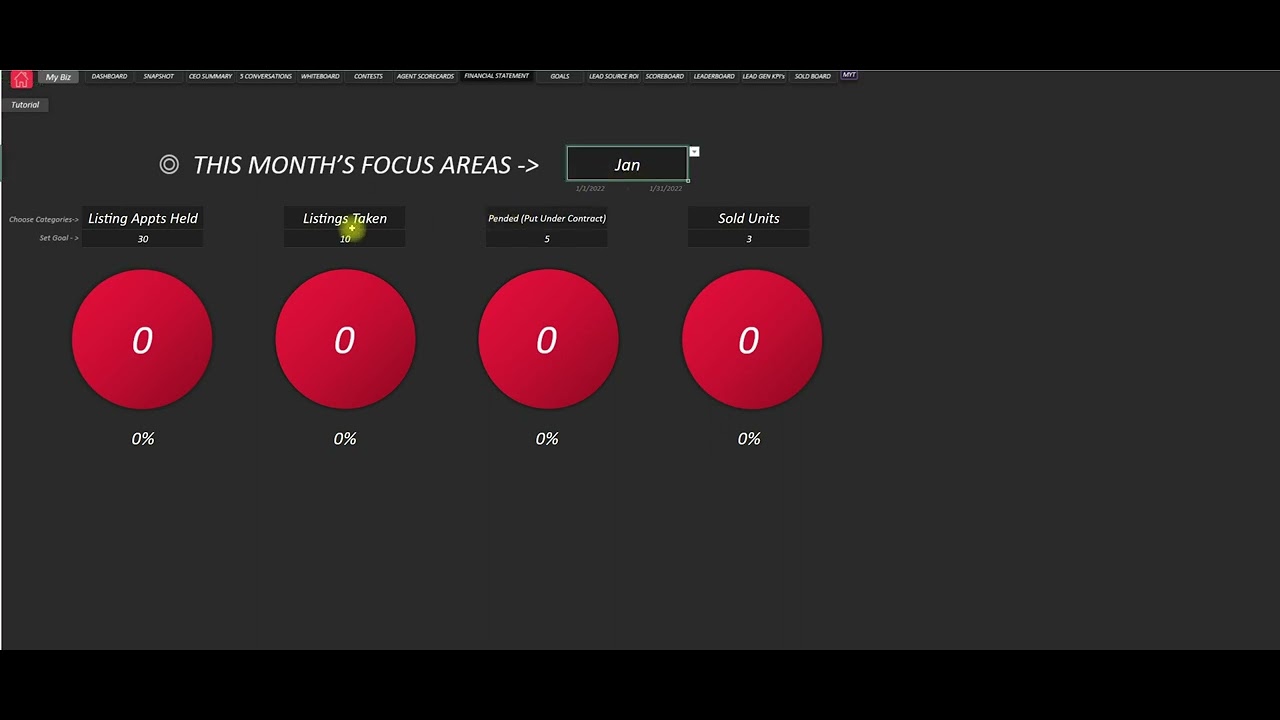
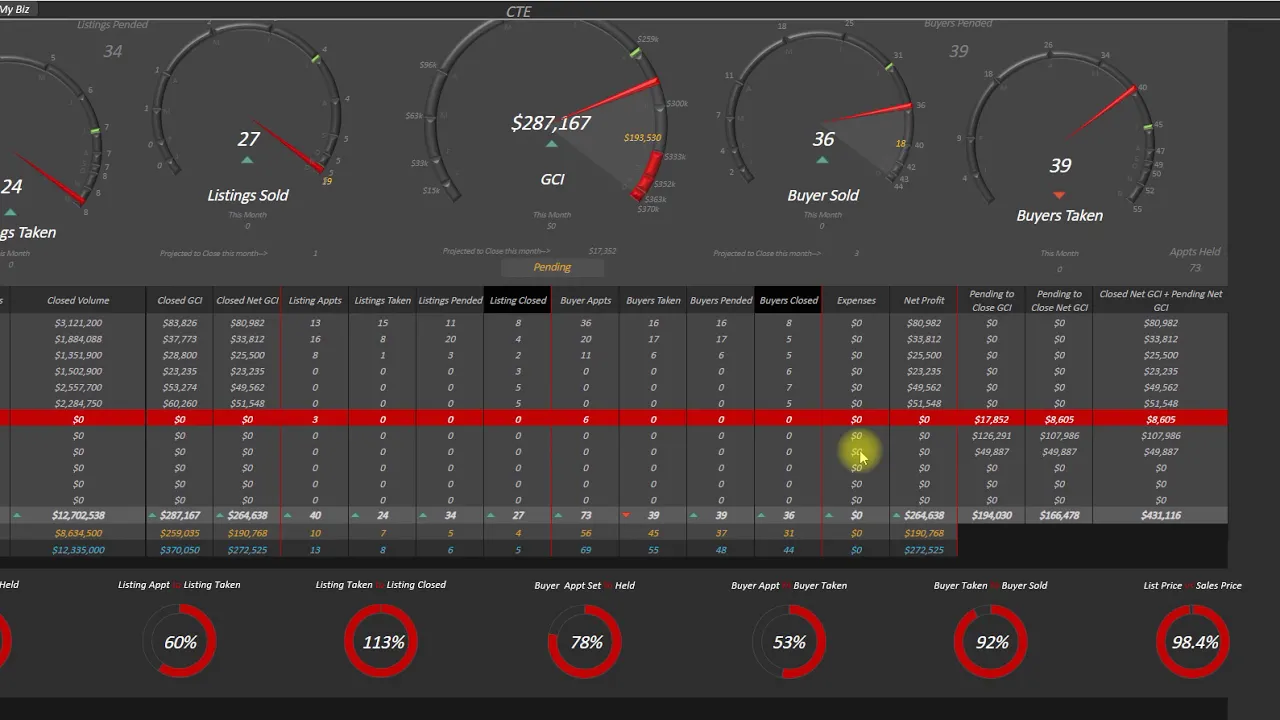
I'll show you some charts here as well and then the key areas of my business are gauged out right in the middle and then I can see details of each month what did I do in every section of my business very important to be able to see these key indicators so do your closed units volume GCI your net GCI after paying out all of your splits and cost of sales your appointments that you've gone on for listing so this is a key indicator of future business and making sure that this is staying up if this
is dropping that is something to keep an eye on so you can see your appointments and then your listings taken so you guys can see okay how many do we go on how many did we actually take and then how many do we actually put under contract how many did we ped and then what do we actually closed and then the same thing on the buyer side by our appointments buyers taken by our spended buyers closed your expenses your net profit each month and then it obviously it highlights the current month that we're in and
then what's really powerful is that show that your pending to close GCI for your future months so what does August look like what does September look like October has nothing in it right now so that's something that I need to be aware of shows my pending and that also shows me my pending net so of that closed GCI how much of it am I going to keep so I can see my profits for those future months right on the CEO summary and that all of my conversion rates are right here as well breaks it down
by quarter in all of those categories so I can see what I did each quarter and then this week last week and two weeks ago so you guys can see all of that right on your CEO summary all of your newest listings are on here all of your upcoming closings and then a charted income total GCI and then your net GCI so this is what you're actually going to keep and then a very powerful little section of the CEO summary is all of those key indicators you can see charted on here so you can see
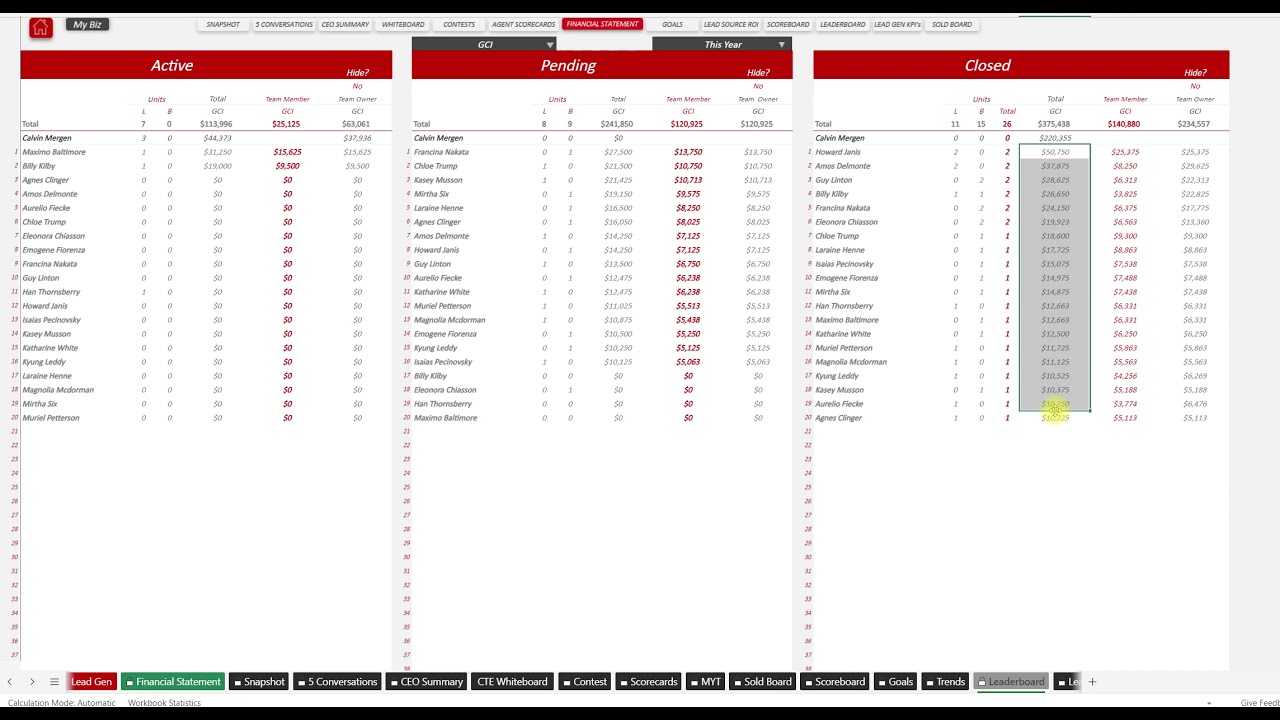
how you're trending in each of these sections so again something to keep an eye on because all of these are going to be key factors of future business so here's one listing inventory so this actually shows me my inventory and it actually forecasts it out based off of your expiration dates what that will look like you can see your buyer appointments set held your conversion rate by appointment held to sign by reps taken listings fended buyers pended sold and then your income cost of sales your percentage each month your expenses and then also a leaderboard
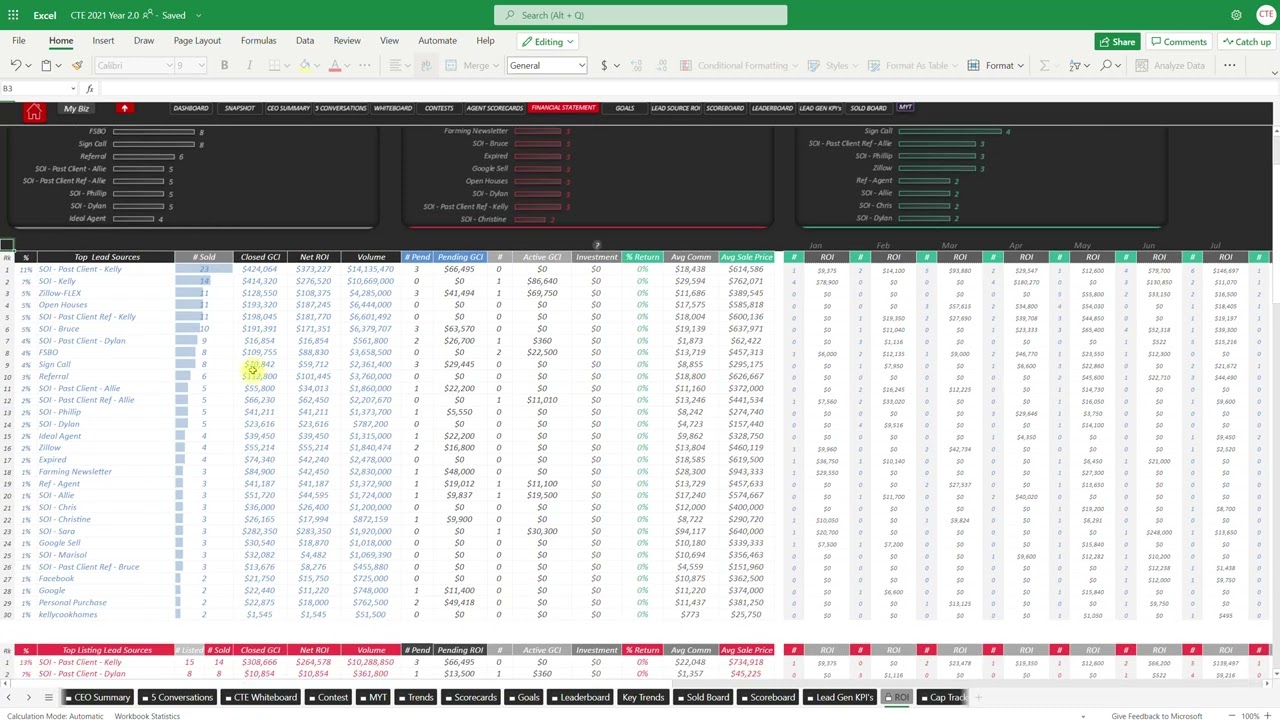
for your team all of your top lead sources so where is your business coming from sphere of influence past clients open houses shows you your closed ROI and it also shows you what you currently have pending with that lead source as well and then your income breakdown - 65 % listing 35% buyer and then here are my missed opportunities so canceled transactions expired and then sales that have failed so very powerful little reports to look at CEO summary and then also just your homepage as well to keep an eye on