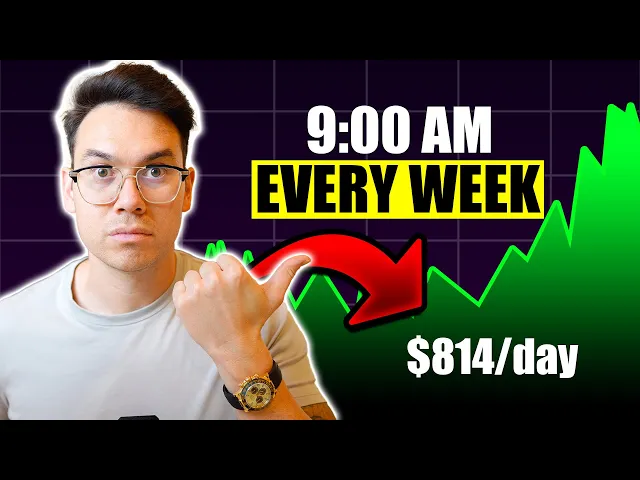
I've been able to make $814 every single day for the past five months using a simple swing trading strategy that most people aren't talking about and I want to show you exactly how to do it but first to prove to you that I've actually done this we're going to take a look at my account right here this is the realized gain loss financial statement total gains 132,000 10K in losses and a net gain of $122,000 in the past 5 months as you can see right here with a 92% win ratio and I've been able to do this utilizing a safe and simple strategy that you can Implement today now let's go ahead and jump into it before we do make sure to hit that subscribe button and the Thumbs Up Button if you get any value out of this video and if you want my free stocks and options plays directly in your inbox go ahead and click that first link in the description also if you have any questions throughout this video you could either comment down below I answer all comments or you can message me on Instagram it's Ryan hildr or even on Facebook if you don't have an Instagram I answer all my messages as well so let's go ahead and dive into it how I averaged $814 a day in the last five months using a simple swing trading strategy now remember this is using swing trading so I'm not cashing out an $814 profit every single day I'm usually taking a trade that lasts anywhere from 5 days upwards of 35 days and averaged out that has calculated to $814 per day for the last five months in the Live account that I actually show here on YouTube I have many accounts but that one $814 a day okay so how this works my strategy follows three simple principles okay number one two indicators that are going to help you with your trading but are not going to be the end all Beall of should you take the trade okay it's just going to assist you in your calculation in your um thesis of should I take the trade okay two indicators I don't like to have more than two because it just makes the chart look all funky and cluttered okay I like simple strategies with two simple indicators okay so we're going to keep it simple for you so you don't get too confused number two I scale into my trades according to vix levels now if you don't know what the vix is this is why I'm going over it because most people on YouTube aren't talking about the vix in fact I don't know why Traders aren't talking about this I believe the vix is is one of the most important indicators you should be looking at when trading options and that's why we're going to get into number three the principle of option selling strategies so the reason why I sell options and I'll show you how to do it if you've never done it before I'll even you know go in play some trades and show you exactly how I do it but the reason I sell options is because it allows me to be directionally wrong but still profit on the trade and be right okay it allows room for error it also allow allows you to make money when stocks go up down or sideways and the lastly is time works in your favor so if I have to stay in the trade longer that's okay each day that goes by I'm making money on that option because I sold it I didn't purchase it okay so we're going to get into the exact option selling strategies that I Ed to swing trade and I'm going to show you exactly how I was able to clear six figures in the past 5 months so let's plug in the indicators live and I'm going to show you exactly how I set up my chart so this right here is trading view I take a look at trading view just to kind of get you know the average prices and and kind of my entries and exit points now I don't use trading view as far as like placing trades or anything like that it's not connected to my brokerages um but I like to use it just to look at the charts I think this is the cleanest platform okay so let's go ahead and go to indicators we're going to place the first indicator which is is going to be the Ballinger bands all right so you're going to type in Ballinger and that should pop up Ballinger bands we're going to go click on there all right and mind you the what we're looking at right here is QQQ okay this is the investco NASDAQ ETF this is follows the NASDAQ 100 all right and Bas basically the biggest 100 companies in the stock market tech companies but there's a few in there that aren't technically tech companies like Coca-Cola right but I love QQQ that is my ETF of choice all right and we're also looking at the daily time frame so every single one of these candle sticks is one day the reason I have that daily time frame is because we're taking swing trades so we're going to be in the trade for longer than a day so we should be looking zooming out and kind of seeing the whole picture so we could participate in these big upward moves rather than kind of zoning into like a 15minute candle and time frame and and just you know not really being able to see the full picture all right so indicators I got the Ballinger bands just make sure you can go here to settings um we're going to go there and make sure that the Ballinger bands say standard deviation two okay that's what you want there now what that means is for the top and bottom Ballinger bands right here all right the stock is going to stay within those Ballinger bands 95% of the time all right and then 5% of the time it will sometimes breach as you can see right here back in April we breached but we sucked back in okay and every time we do breach a Ballinger band that's a perfect time to actually enter a trade because frankly it's most likely going to go the other direction all right so two two standard deviation Ballinger bands that's the first technical indicator the next one we're going to go here and we're going to type in relative strength index there we go okay relative strength index RSI all right and the RSI basically shows you it's a momentum indicator and it's going to show you if the stock is overbought or oversold if it's above 70 this Top Line as you can see it was overbought here and if it's towards this 30 line that means it's oversold right and there's a good chance it's a good time to buy or get into the stock and as you can see it kind of correlated right here we breached through the lower Ballinger band and we became oversold on the RSI this was a good time a good risk to reward to actually get in the stock for an upside swing and that's exactly what happened you would have got a nice upside swing here and you know the rest is history okay so we're going to actually as you could see we're starting off in July okay um of 2024 but we're going to press the play button and let this play out okay and we could speed it up to I'll I'll go to like um three times let's just see that as you can see boom we broke the Ballinger band right there and again this would have been a good time to get in but I'm going to keep pressing play so you could see okay so that would have been a perfect opportunity we became oversold on the RSI we literally touched that lower RSI level okay and we broke that lower Ballinger Band by a lot I know we broke it back here and that still would have been a good time to take a shorter term swing trade because it did recover but this one was a major opportunity on both the RSI and the Ballinger band and as you could see if you held that swing trade you got in here you would have made a lot of money and I did okay I did on uh QQQ and other individual stocks because the overall Market was showing that it was going to recover okay so we'll keep pressing play and just kind of see how this plays out and then I'll show you kind of how these option strategies work okay so again this is you know we're going through October here the market was kind of trading a little bit sideways all right and we dropped a little bit there and then elections happened and we pumped up made new all-time highs okay and then we made more new all-time highs in December towards the end of the year and now we are at 20 25 okay so what the strategy that I do okay with selling options I'm going to kind of draw this on the actual chart so you can see how I'm doing this all right let me go ahead and minimize this now what I do is I will go ahead and sell an option that's down here all right that's below the Ballinger band way down here and as long as the stock stays above that okay it could trade sideways like it could trade all the way sideways and be here by expiration but as long as the stock trades above that by expiration I collect the full profit okay now I do that here I would do that here I would sell an option that's below the Ballinger band here right and the stock came down sold an option here as long as it doesn't go below this line by expiration I make a full profit right and I rinse and repeat I even do it on the short side so I will go ahead and sell calls that are up here right and we'll get into the exact strategy so don't worry about it I'm just kind of going over the an overview of how you can make money through options through option selling utilizing these indicators all right so I'll sell options up here up here up here and as long as the stock doesn't go past them I will collect a full profit okay so let's go ahead and dive into the next we have the indicators now we have Ballinger bands we have the RSI on the chart okay let's let go ahead and talk about the next most important indicator which is the vix all right so the vix the vix is the fear and volatility index it measures the amount of fear in the S&P 500 options so you can literally see how fearful fearful people are and if you follow the principles of Warren Buffett you got you have to be greedy when others are fearful all right and I follow that I'm a contrarian when everyone's afraid that's when I know it's the best time to get in at a discount so vix levels now most Traders don't talk about this they talk about oh you know go all in when it's when you know the trade setup looks good and just set a stop loss I don't use stop losses I don't go all in when the trade setup looks good because what's going to happen is if you aren't if you weren't looking at the overall picture of the market and how much fears in the market right you could be you could end up in a situation like 2020 where the vix was at an all-time low we were super greedy everyone was greedy the market was at an all-time high vix was at an all-time low and then bad news happened and boom fear spiked the Vick spiked and a lot of people lost a lot of money a lot of people were overleveraged I even lost a lot of money back in the day because I wasn't looking at the vix okay so let's look at the vix I want to show you exactly how this works all right we're going to compare it to um we could compare it to QQQ that's fine even though it's not the same product I guess we will go into spy all right so we're looking at the S&P 500 now let's look back at August or July 16th okay and then we're going to look at August 5th so let's go to the vix July 16th the vix was trading at uh let's see 13 okay so almost an all-time low right 13 August 5th the vix spiked all the way up to 67 which was the highest level since 2020 if we go back to 2020 the Vic spiked all the way up there we had that we had that level of Vick Spike August 5th okay and you could see how the market what happened to the market boom it crashed it went down quite significantly my Nvidia I was in Nvidia the shares were down like 35% okay so if I wasn't you know if I didn't look at Vick's levels I could have been fully allocated it and then my portfolio would be down a ton of money right just seeing the portfolio down and then also if I didn't have cash on the side I wouldn't be able to take advantage of that wonderful opportunity and because I was paying attention to the vix I took advantage of it so this is how it goes all right when the vix is between 10 and 15 25 to 50% should be allocated of your of your cash right so you could be 25 to 50% invested now mind you this is based off my risk tolerance you need to do this on your own as far as how you have your risk tolerance this is not Financial advice okay this is just how I do it vix 10 to 15 I'm 25 to 50% allocated vix 15 to 20 that means the fear is a little bit higher okay there's a little bit of fear in the market I'm a little bit more allocated 50 to 75% allocated when the vix is between 20 and 30 the fear is there there's a lot of fear there's some something going wrong right and I'm usually 75 to 100% allocated as far as cash goes and then vix over 30 I'm not only 100% allocated but now I'm adding new cash into my brokerage account from savings checkings anywhere I could find some cash right so let's go ahead and look at the vix and show you exactly how that looks so right here okay from uh April 19th all the way to July 7 17th right the vix was going down and then it stayed between 15 and 11 okay or 12 right between 15 and 12 for like 3 months straight and the market just went straight up if we look at spy it just went straight up right so this right here would be a good time when the vix is trading between 20 10 and 15 is to have some cash on the side because you never know if there's one piece of bad news and you you're 100% invested at these vix lows that's not good that's everyone's greedy right and then one thing happens like this and now you're down on your portfolio and you're down on your trades because you were 100% allocated and you have no cash to take advantage of this opportunity okay so that's why you need to study these levels if you need to screenshot this pause the video write these down this is what you need to pay attention to okay so this is exactly how I trade options because when the vix is high options premiums are also high so I'm selling expensive overpriced options to people who are buying Insurance because they're scared all right so right now how I'm approaching the market we um we had a nice little Spike last week um prior to New Year's and I took full advantage I went all in 100% invested and now we're doing pretty good okay because now the vix is between this you know 10 and 20 Level which is where I'd like to be pretty much almost all the way allocated and I just you know I'm just going to let the vix kind of go down the fear go subside and I am going to start taking some trades off and getting some cash ready to redeploy when this SP type of Spike action happens again okay so that's how I approach the vix all right so let's go ahead and get into the option selling strategies let's talk about cash security puts so I sell puts on stocks that I love okay big huge companies Apple Amazon Google Nvidia Tesla um even paler that's a smaller company but I even sell cash secured puts on palente here now how a cash secured put works is I will sell a put let's just say the stock is trading at 60 okay I will sell a put at 5050 meaning the person who's buying it from me thinks that hey if the stock goes down to 50 at least they have a placeholder to sell their shares to me okay um and and they have to pay me a premium as well they also have to pay me money for that option so as long as the stock stays above 50 right because let's just say I'm selling the 50 strike price put I get to collect let's just say 500 bucks okay 500 bucks so let's just say in 30 days the option expires the stock trading at 57 I collect 500 bucks and I do it all over again okay but let's just say in 3 months I'm doing this consistently collecting income on cash secured puts and let's just say the stock again is trading at 60 I'm selling the 50s and the stock goes down to 47 all right now I'm going to be forced to buy 100 shares of the stock at 50 which is great I'm getting a discount I'm willing to do that because that's why I sold the put so so I can get it at a discount or just collect premium and now I own the shares at 50 but the stock is trading at 47 now I own shares that are slightly at a loss but I got paid a premium and now I could also collect income by selling covered calls against those shares okay and we'll get into that later but for now this is exactly how cash secured put works when selling your first cash secured put always ask yourself do I want to own this stock do I want to own this stock at this price if if the answer is no then do not sell a cash secured put all right if the answer is yes then I would sell a cash secur put at 25 to 35 Delta and I'll show you the strike prices and everything and if you have no idea what this means because you don't know what options are there is a link in the description below okay you could click that it's a full options for beginners tutorial but if the answer is yes I would go 25 to 30 Delta sell the strike price 30 to 45 days out and you could either wait until expiration collect your premium set it and forget it or you can close out early at a profit that's really going to be up to you I'm not going to get into the nitty-gritty of what I do but most of the time I'm waiting closer till expiration to close out the trade all right now let's do a live example back test of does this strategy actually work okay so we're going to do a back test here in tasty trade all right this is one of my brokerages another brokerage I have um with six figures in it we're going to go to back testing symbol QQQ the NASDAQ 100 ETF we're going to look at the past 12 months just you know just to go back past 12 months and we're going to sell a put a cash secured put one contract every 30 days uh at the 35 Delta okay and we're going to run the back test and see how that plays out cool so this is how it plays out total profit 16,500 your return on capital is 33% now if you were to just have purchased QQQ purchased 100 shares right your Buy and Hold strategy would make 27% so you outperformed by what is that 6% so you outperformed um and you know you basically got to sell options collect income every month and you outperformed QQQ by selling cash secured puts okay so this strategy works right the strategy is a bullish strategy and it works very well and I've been doing it for quite a while now all right um now let's go ahead and go back and we will go ahead and place a cash secured put trade so I'm going to show you exactly how to do it now this is another brokerage I show live here on YouTube 704k right now and as you can see I have a lot of cash secured puts this is I practice what I preach this is exactly what I'm doing as a Trader okay to generate income for my myself and my family right um so what I would do is let's just go to Nvidia I love Nvidia I have a huge six-figure position on it selling a lot of cash geared puts and I would go to the options chain I would go let's just say 30 days out we'll go 27 um actually let's go 34 days okay 34 days out and I would sell the 35 Delta put if I really like the stock I don't mind owning it if it if I get assigned and I want to collect more premium okay so let's do the math on how much you would collect from the 139 strike 35 Delta put all right so that's you're going to collect $4. 90 so 490 bucks divided by the strike price which is$ 139 because if you got to sign the shares you'd have to purchase 100 shares at 139 which is 13,900 so 139 that's about a 3 and 1 12% return in one month okay that's pretty good if you're doing that every single month month and this is not compounded but if you're doing it every month you're going to make somewhere between 42% to upwards of 50% if you compounded okay so that's exactly how I'm making 45 to 50% per year on my money in my entire portfolio because I'm doing the strategy all right now if you want to be safer you would do the 25 Delta so you'd collect less premium but you'd be able to go further down at 134 so let's do the math there 286 / 134 right and that would that would generate you a modest 2% return again annualized you'd be somewhere around 25 to 30% okay so still a you're beating the market and you're being safe you're getting further away from the stock and if you do get a sign you got it at a fat discount this would be a what a 10% discount okay and you got to collect income every month so that's exactly how I do the cash secured put now what if you don't have enough money to buy 100 shares well that would be a bull put spread so you would do basically the same thing okay we're just going to place a trade here in tasty trade it's a little easier we do a vertical short putut okay let's go here and press go there we go and we'd make it um f so basically what you're doing is let's go back here basically what you're doing is you're selling a put let's just say the Stock's trading up here you're selling a put down here and then you're buying a put but here to cap your risk because technically if you don't have cash to buy 100 shares you have unlimited risk to the downside by selling a put unlimited risk okay if the stock went to zero you'd lose a lot more money than what you sold the put for but because you bought a put when this go when the if the stock ever goes below your sellp put this buy put is making enough money to cover that loss so you're only losing the width of of the strikes so if you sold the 130 and bought the 125 you'd be risking 500 bucks all right so I'm going to show you how to do it 20 Delta or lower 30 to 45 days out always close early on a bull put spread 25 to 50% Max profit and only open the spread when the stock is down I traded spy as my first live trade with a bull put spread so um again we're going to go down further so we're going to go all the way down here to the $20 Delta to be safe 130 we're going to sell the 130 and we're going to buy the 125 and our Max loss is 413 bucks to make 87 bucks so let's do the math there so 87 / 413 what we're risking that's a 21% return right 21% okay times that by 100 21% in this trade so you're going to make 21% on your money and the probability of profit is 79% and the probability of 50% of profit so if you made $43 that's 87% okay so your probabilities are in your favor if you're doing this for many years many occurrences you're always going to win so that's exactly how that works all right so that is the bull put spread I like tasty trade it's better for beginners especially when placing these um vertical spreads is what they're called okay so that's that now covered calls so we talked about you selling cash secured puts the stock goes below your put price by expiration and now you have to buy 100 shares okay so you get assigned now what well what you're going to do is you're going to start selling covered calls okay so basically what that means is you're going to the Stock's trading at uh let's just say 170 you're going to sell the 185 and as long as the stock doesn't go above 185 you get to collect that whole premium if it does go above 185 right above your call strike by expiration you will have to sell your shares at a profit and you get still get to collect premium so it's a win-win situation that's why I love covered calls so I like to do the 30 Delta 7 days till expiration to collect weekly income and then hopefully you know get your shares called away so you can start making some put premium again all right so let's go into a live example um I have let's for instance on my Nvidia I have 200 shares here 200 shares here and I sold the 152 and a halfs and the 155s okay these are covered calls I wanted to collect let's see 200 bucks here 160 here on these ones uh 250 and 160 okay now let's just say you have shares you got to sign shares um let's just go let's just go 13 days out okay okay let's just say you got ass sign shares today at 144 all right what you're going to do is you're going to go to the 30 Delta which would be the 152 all right so the math on that like let's just say you sold the covered call the which is the 152 you'd collect 200 bucks all right so 200 divided by 144 which is what your Shares are worth all right that's a 1. 38% return in income right that's that's pretty good you're still going to beat the market there right 16% in a year from covered calls but let's just say the stock goes above 152 it's let's just say it goes to 153 now you'd have to sell your shares at 152 so you bottom at one or you bottom at 144 but we're going to go 152 minus 144 8 divided 144 right so you now made a five .
5% return on your shares appreciating and you having to sell them at a profit so 5 A2 plus 1. 3 on the covered calls you made 6.