my two previous videos showed how to estimate volatility first under the basic standard deviation approach also called moving average it had a weakness though in that all of the returns that are signed the same weight so we showed next level up in sophistication the exponentially weighted moving average or ewm a approach to an estimate of volatility and it had the feature of allowing us to assign greater weights to more recent returns in the historical window this video takes a deep dive on the next level of sophistication the GARCH 1/1 which generalizes the ewm MA also
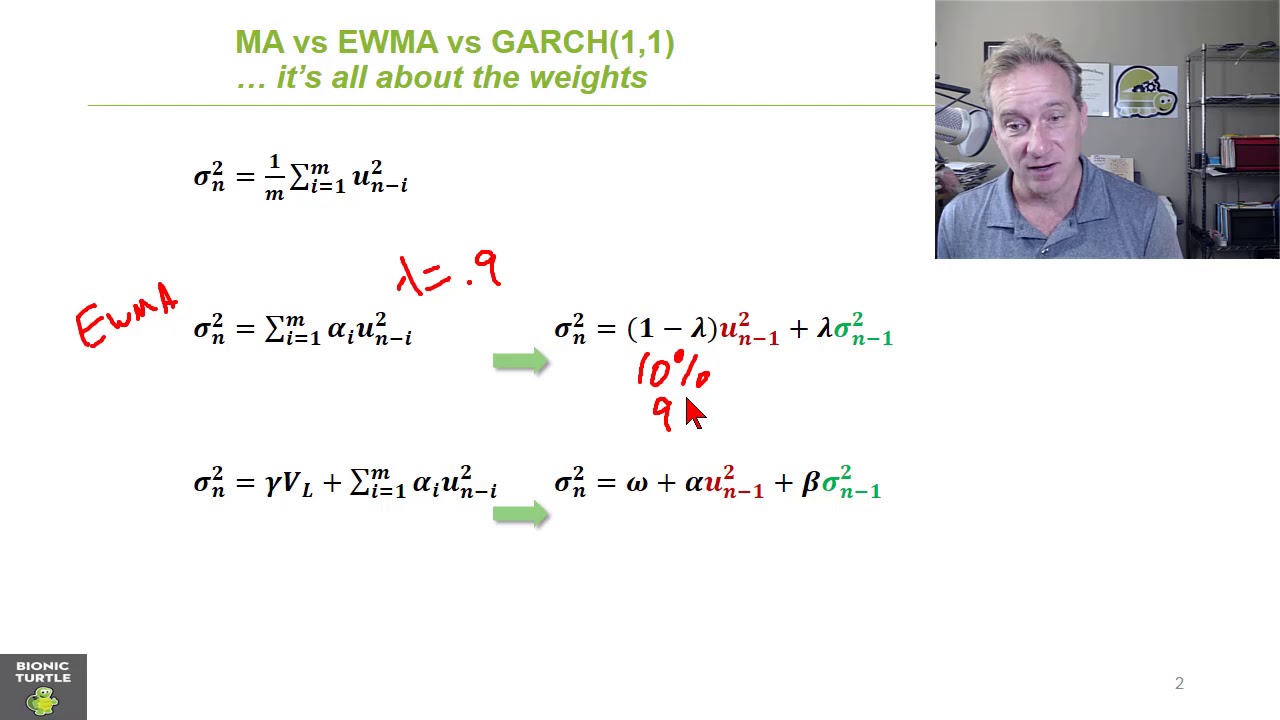
assigning exponentially declining weights but in addition to that allowing us to model a long-run variance toward which the series has a tendency to pull or gravitate toward so this video will take more of a deeper dive and then the next video I'll take a more superficial approach so just watch this if you want to really technically understand more about GARCH 1/1 [Music] so here is the most familiar version of the estimate for today's variants under the GARCH 1:1 model and we're estimating today's variance is denoted by Sigma squared that's variance today is day n and
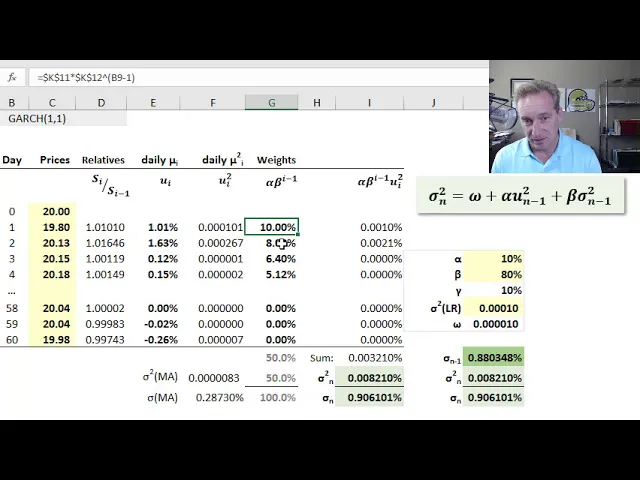
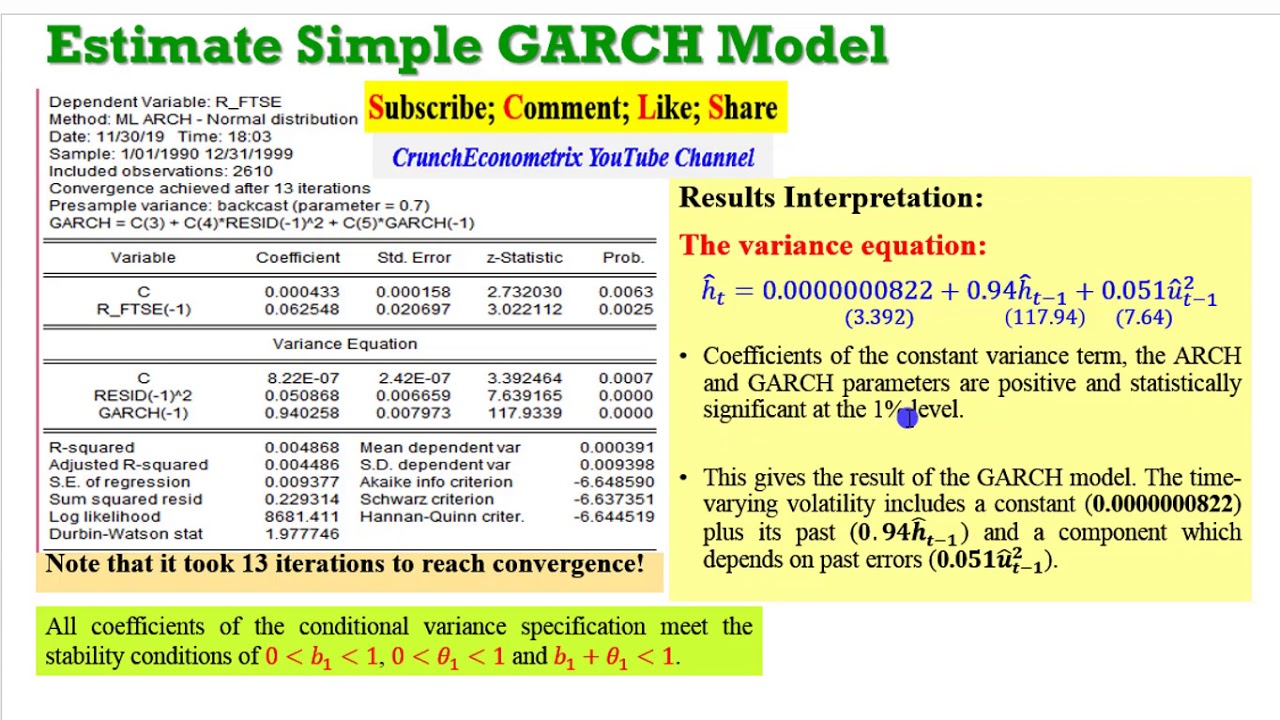
GARCH 1:1 says it is equal to the sum of three parts Omega plus alpha which is the weight assigned to yesterday's squared return mu ru is the return it's squared but it's day n minus 1 plus beta the weight assigned to yesterday's variance so Sigma squared but day n minus 1 so it's a recursive because we're estimating today's variance as a function of yesterday's variance this model can be fit with an algorithm like ml e but i'm so we do need to specify the parameters and I'm just using some round numbers here I have an
alpha of 10% that's right here I'm using a beta of 8% and usually most of the weight does go on the previous variance and then I have a the last weight there's three weights in the GARCH one one alpha beta gamma they sum to 100% that's my my my last gamma weight is not an input it's just solved for it's what's left over here and we don't see it immediately on the superficial formula because this Omega term is the product of that's this Omega is the product of the gamma weight multiplied by the long-run variance
so this is John wholes notation but we could imagine different notation so this Omega itself is a value in the model specification but is a product of a gamma weight and a long-run variance so I have assumed a long-run variance here of 1% squared so I'm assuming a long-run volatility of 1% this is also called the unconditional variance so this is the variance to which we expect the series to pull toward I think of it as a gravitational pull toward the long-run average and so the Omega then as I mentioned is the product of gamma
the weight in this case 10% multiplied by the long-run variance and so my Omega here you can see it's usually a very small number is point zero zero zero zero one zero okay so this recursive version however is based on a logic which is similar to the exponentially weighted moving average approach to volatility which I covered in the previous video so recall we started with the simplest idea of a volatility estimate and that is the standard deviation and then we showed the exponentially weighted moving average which improved on it and the GARCH 1/1 generalizes by
adding another theoretical improvement what we have in common is the daily price closes a historical window of asset prices which is really the key ingredient after volatility is a statistic based on a series of prices i've going back 60 days or three months times twenty days and i have some random number here's for prices may recall we divided a price by the previous day and that gives us the price or wealth relative and that's so that's a series of values that would be pretty close to one little above a little below we're only using daily
periods here and then the natural log of those price relatives gives us the series of daily log returns by definition continuously compounded and such that finally we squared the daily returns to get a series of squared returns and the average of those squared returns gives us an estimate for the variance under the simplest approach to volatility which is to just take the standard deviation of the historic a window if I take the square root of that variance I get the volatility estimate here under this approach also called the moving average and you can see my
volatility is about twenty eight point seven three basis points that's my daily volatility but the elegance of this simplest approach is how easy it is to say it under this simple approach of moving average the daily variance is just the average squared return and then the exponentially weighted moving average overcame the key weakness of this by assigning greater weight to returns that are more recent and lower weights or lesser weights to returns that are more distant in the past okay so the GARCH one one does that as well the guards one one has this in
common with the exponentially weighted moving average approach in that it also assigns exponentially weighting exponentially declining weights to the squared returns so here under my assumptions the weights turn out to be the weight on any given day is alpha times beta raised to the I minus 1 that means on the previous day's weight which is day one and minus one the weight is alpha times beta to the 1 minus 1 or beta to the 0 or 1 so the most recent weight is just alpha or 10% if I go back to two days prior when
my eye is 2 then its weight will be alpha multiplied by beta to the first power or beta so the 8% is alpha of 10% multiplied by beta of 80% or 8% and so on and so similar pattern to the exponentially weighted moving average what we have here is a constant ratio of consecutive weights notice I start with alpha of 10% is the weight assigned to my most recent squared return and then 80% of that beta percent of that is 8 percent 80 percent of 8 is 6.4 80 percent of 6.4 is 5.1 - my
weights are in constant proportion and that proportion is beta so my beta is analogous to the lambda in exponentially weighted moving average so I have here in theory an infinite series my series only goes back to 60 but that gets me pretty close to zero values here such that if I accumulate the cumulative weight in an almost infinite series my series is truncated my cumulative wager is 50% when I did this an exponentially weighted moving average I got a hundred percent well that's because so far we've just talked about what they have in common the
dwma and the GARCH 1/1 what they have in common is this feature of exponentially declining weights assigned to the squared returns which hopefully makes intuitive sense let's give more credit to more recent volatility or movement that's what they have in common now what they have in difference is the fact that the GARCH 1/1 includes this term to give weight in this case a 10% way to a long run uncle on run or unconditional variance so the series is getting pulled toward the variance in my case again that variance is 1% squared and so I'll put
this math in a link or in the comment but cumin ugly in the infinite series this ends up being the other 50% actually into these assumptions and so my weights to equal hundred percent but now I have in the infinite series really two things contributing to the pattern have these declining weights but I also have this unconditional variance that's contributing at every point in time and cumulative Li 50% so that in a pattern similar to the exponentially weighted moving average I can now take the product of the squared daily return in the weights so you
can see here all we're doing here is waiting each squared return and and summing it at this point in the exponentially weighted moving average we could have stopped because that's all we have but in the GARCH one one we need to add the contribution for the long run or unconditional variance and the formula for this happens to be my Omega divided by 1 minus beta due to its nature as a geometric series so I'm giving that credit for the or that contribution for the unconditional average and I'm then I'm getting my current estimate for variance
as given by the GARCH one one model for volatility I take the square root of it and I get the Sigma N or today's estimate for volatility and you can see it's ninety point six bases points it's three times higher and there's two reasons for that one just in my random numbers my I have more volatility in the region the more in the recent days than I do in distant days and they're getting greater weight but also importantly I have that long-run variance of 1% squared along with volatility of 1% and my my variance estimate
is getting pulled toward it if this if I lower this then this comes down but right now it starts below it and it's getting pulled toward the 1% so that's the rationale or logic of the GARCH 1 1 and then as with the ewm a approach this tedious math because it's an infinite Cirie's reduces to the elegant version here and just to show that that's the same off the page what I've done is estimate the volatility on day n minus one and it happens to be about 88 basis points so that's my Sigma sub n
minus 1 here and now if I have yesterday's volatility or variance estimate then I don't need to go back on the infinite series I can just implement the familiar GARCH 1:1 model and so I'll do that here I'll just recreate that right because we're going to say it's going to be the Omega plus my alpha weight of 10% applied to my most recent squared return plus my beta weight multiplied by the most recent variance and I need to square that because as an input it's a it's only a sigma and you can see that this
formula implements this recursive version I don't need to go back into the infinite series because that information is contained in yesterday's variance but I get the same result take the square root of that I get this 90 point 6 basis points as my estimate for today's volatility under the GARCH 1 1 the 1 and 1 actually stands for this one in this one lag 1 return squared lag 1 variance and just to recap my I have one thing in common with the exponentially weighted moving average and one difference the thing in common is that the
weights are declining exponentially and they are captured here both Garching and E what a WMA do that but the GARCH one one differences it adds this term and a contribution of a weight applied to the long-run variants and so the series gets pulled to this and that's the difference from the exponentially with moving average so I hope that's helpful if you found this video helpful please subscribe to the channel and we'll notify you with future updates