welcome to lecture two in business 355 data visualization this week we're going to talk about ethical considerations in data visualization so i like to think of this as with great power comes great responsibility policy makers and decision makers question do they dive deep into the big data or do they rely on data scientists to analyze and portray the findings pretty much the second one right we know that many policy makers whether they're legislators or state government local government those who inform a policy at universities these decision makers are not typically the ones who work with the data organize the data and then create the the graphics that we see oftentimes they're working with data scientists such as you and i to analyze and then portray the findings so how do you be sure how can you be sure i'm sorry to not misrepresent data when you are creating at this visualization and i like to think that this starts at the beginning of the research study questions come up such as do i delete this entry during the data cleanup right so you may work through the data it could be you know thousands of records and you're trying to determine if you should delete somebody who didn't complete the entire survey or whose record is not fully completed you also have to question as to you know whether or not you are succumbing to confirmation bias so each of us goes into a study with a preconceived notion of what we believe the data will tell us we have to be certain that we are not just listening to that and looking at the data seeing a confirmation of whatever we think it is without diving deeper to see if there are any issues with the data or if that's what the data is truly telling us or if there's something else that helps explain what it is that we're seeing you should ask yourself does my analysis unfairly bias a certain group do my visualizations fairly depict the data are my visualizations biased and does my visualization understate or overstate the message so you might be asking yourself well how could that happen i'm a good person i'm a good data scientist i would never mix represent the data but it's common it's more common than you think and in this course you're going to see many many many examples of misrepresentations in data in fact in assignments when you're tasked to find the good the bad the ugly many times you're bad and you're ugly might be misrepresentations in the data so let's think about what some of the common ones that we see are and we'll talk and i'll give examples of each of these one is broken scale omitting the baseline another is not normalizing your data a third is using artistic or skewed graphics the fourth radius versus area which one to use another is the misuse of aspect ratio inverting an axis manipulating the y-axis cherry-picking data and going events against convention so as i said we're going to go through each of these and i'm going to give you an example or two for each one i thought about including more than just one or two examples but then i recognized that since you guys have uh assignments where you're finding the good the bad the ugly i didn't want to pull all of them out for you so you guys will also get a chance to share what you think are misrepresentations of data so the first misrepresentation is using the broken scales or omitting the baseline so what does that mean it's in a scale such as this when you're looking at the left we see that the baseline starts at 34. well what does this mean then it means that a tax rate increase from 35 to about 40 percent looks like it's now quadrupled we know that that's not true and so when we read this type of a graphic we jump to a conclusion our eyes barely even notice that we didn't start with a zero baseline in fact what we see is whoa look at that increase now the one on the right is a depiction of that using a zero baseline when you look at the increase in the tax rate what you notice is that 35 to 40 is much much closer together it's not as huge a jump so graphs should always start at the zero axis otherwise they tend to exaggerate the differences and again when we're making decisions based off of a graph or a visualization we want to make sure that we're providing the whole picture not just a skewed skewed one here's another example the baseline on the left starts at uh 0. 4 the one on the right starts at zero so if we're looking at percentage of victories comparing the new york yankees to the boston red sox it looks vastly exaggerated on the left whereas to the on the right they look a little bit closer together and here's a third example where the baseline on the left starts at five which means that the gdp going from an hour from about 6.
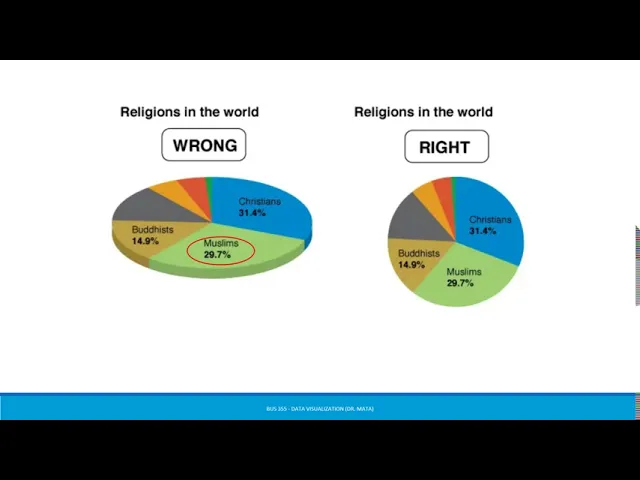
75 down to 5. 5 looks um looks exaggerated it looks like a huge drop but if we look at this on a scale starting at zero what we notice is that yes it's a decrease but it's not that drastic a decrease as is represented in the first graph on the left the second common misrepresentation is not normalizing our data so in a graph like this where we're talking about most dangerous cities on the left what we see is a look at total murders in 2014. well does the list on the left surprise you probably not given their highly populated areas i like to think that this is not dissimilar from when we see um cities with the most car accidents or the most um car burglaries right if we're talking about a populist area one would expect to see more so instead the one on the right gives a different picture a slightly more accurate picture in that it's telling a more full story right so the one on the right looks at that murder but as a rate per 100 000 people and while yes some of the same names appear on the left and on the right the one on the right is just a more complete picture the third most common misrepresentation is when folks use artistic or skewed graphics the one on the left this the one on the left and the right have the same percentages but when we look at the one on the left those percentages don't necessarily line up with what it seems that the pie chart is showing if i removed the the religion and the percentage one would look at this and think wow um you know muslims looks like a much bigger group here and that's because when you put something on a 3d like that you tend to skew the way that the graphic actually looks now some people will say you shouldn't have used a pie chart at all for this um you know others will say well it's it's fine as a pie chart just make sure that you don't use the 3d graphic with it the fourth common misrepresentation is with regard to radius versus area so what do i mean by this on the left you see the quantity pred presented as a radius well when we look at one and what the circle looks like the bubble looks like and when we look at 1.
5 1. 5 doesn't look one and a half times bigger does it it actually looks about two to three times bigger so again knowing what we know about how people read visualizations you're most likely not going to read the numbers that are on the x and y axis instead you're just going to look at the the graphical representation the circles and if we didn't have the one the 1. 5 you would assume that that 1.
5 circle is is greater so the one on the right is a better depiction the fifth common misrepresentation is with regard to misuse of aspect ratios okay so i love this one because it's really easy for us to do and not realize that we are misrepresenting information so when we make the x-axis and the y-axis different uh different shapes and we make them so that the aspect ratio is for example two to one versus four to one um the lines tend to look uh the slopes of those lines tend to look greater so the graphs here show the same data but they're plotted as a line chart one with an aspect ratio of two to one and the other with an aspect ratio of four to one the angle of the line is clearly greater in the two to one depiction and it can convince the viewer that the slope is therefore greater so if we were looking at something we might look at that and go wow look at that increase look at that strong positive relationship the sixth common misrepresentation is inverting the axis this is one that is very popular when people like to get creative with their visualizations so again in this one on the left notice that the zero for the baseline is not actually at the baseline it's at the top of the scale and the baseline is at 10. so the x axis goes in a positive direction and the y-axis actually goes in a negative relation in the negative direction so when you look at this again your brain doesn't typically read the y and the x axis instead you look at that line and you say wow what a strong negative relationship when in all actuality if we were to plot it the correct way which is what you see on the right you actually see that it's actually a net a positive relationship so let's see this in action there are a number of ones that are like this this is one of those graphs where it gets an a for color and an a for drawing the i and an a for aesthetics the problem is that again they had the baseline set as 1000 number of murders committed using firearms and they then they hit the y-axis axis actually decreases and the zero baseline's actually at the top so when you're reading this you're really not quite sure what the graph is telling you without looking at it and what you want to say is like that there's this increase up to two thousands um and then a decrease when actually what it's doing is it's reading um opposite of that the seventh common mis representation was with regard to manipulating the y-axis okay so on the left notice that the axis goes from zero all the way up to 40. now did we really need a y-axis to go all the way up to 40 probably not right we don't have any data in here that is higher than 15 it looks like so instead when we're looking at this this is misleading because we might say oh yeah i mean it's a it's a there's an increase but it's really not that strong whereas if we look at on the right what the right is telling us is when we truncate the y-axis and by truncate i don't mean you know taking out the zero baseline but instead not using um because imagine if on the left we had this go all the way up to 100.
the line would look relatively completely relatively flat right or maybe completely flat um on the right this gives us a better depiction of what's actually happening from 2019 to 2020 and so forth the eighth common misrepresentation is cherry picking our data on the left what we see is we're focused on a very short short short period of time now if that's what your study was about you really wanted to look at what the sales were or what the um the numbers were between may and august of 20 that would be one thing but we wouldn't want to make decisions based on that data once we look at the one on the right when we look at the data on the right what we see is yes there was an increase for a certain period of time between 19 and 19 2019 and 2020 but then what we start to see is a decrease so anytime we want to um display information like what you see on the left the best way to do that would actually be to use that data as a call out box where you note in the chart on the right maybe you would put a box around that area and then off to the right you would actually zoom in to what you see here the last one we're going to go over is going against convention right so again there's no one way to do no one hard fast rule for data visualizations but there are um some guidelines and some things that will help drive you in the right direction and when we go against convention we end up with a little bit of a mess on our hands so a good example of this is what you see on your screen now the one on the left is misleading now it'll take a minute to look at it to figure out why it's misleading but in the way we've always read these chloroplasts and that's what this is called is that the darker the area the more of something right so the darker the area the more individuals the lighter the area the less individuals but since we've gone against convention here on the left your mind would read that and make a different interpretation than what the data is actually telling us here so the one on the right is actually more accurate it's what your brain is programmed to read and it's what would make the message hit home quicker and i say to infinity and beyond here because that's just a few of the misrepresentations you in this class will spend time looking at good and bad visuals and i challenge you to share with me what are some more what are some other misrepresentations that you see um you know i'm tempted to give extra bonus points when you find something that fits outside of of the the nine that i told you so let's talk a little bit about alberto cairo's work so as i mentioned in lecture one we are you know we have a text and it's probably the best of all of the books on data visualization because it's more comprehensive and it includes lots of different things but for this one i for this class i really want to bring in others right there's other experts out there who have literally written the book who are good at what they do and so more exposure to them i think will only help you so i'm going to pull some stuff right now from how charts lie by alberto cairo so he gives some examples one of the things i love about his work is that he loves to place a misleading graphic and then he likes to correct whatever it is they did and put the more accurate one right next to it so that you can see the difference so on the left what you see is the original graphic which was looking at cancer screening and prevention services by planned parenthood and abortions now let's take politics out of this let's take what we believe about abortion out of this and just look simply at the graphic so if we're looking at this on the left we're assuming that it's the same y scale you know they don't present a y scale here but looking at it i would think it was it's only if i look further that i realized that we're talking about cancer screening and prevention services being in the millions and abortions being in the lower hundred thousands so when i put them on the same graph though what i start to see at the end towards 2013 is that there are more abortions than cancer screening and prevention services uh provided by planned parenthood so what cairo says is a more accurate representation of the data would be what you see on the right where we have a y-axis that's labeled and the y-axis may or may not have needed to be labeled in this situation but it is and what we see is the numbers and the data are more accurately placed there another example is this one and this is one that i pulled which is a just a different visualization of what we saw earlier as i could as you can probably tell this is one of the common ones when we're talking about misleading or misrepresented data um on the left we see the tax cuts right so again no zero baseline it starts at 34.