[Music] this is the city of lafayette louisiana it's a pretty typical mid-sized american city like most american cities it has that one nice old building that didn't get bulldozed in the 60s and like most american cities it's broke it's full of aging infrastructure in desperate need of repair and not enough money to maintain it but unlike most american cities lafayette acknowledged this fact and requested the help of strong towns and urban three a consulting company that helped cities better understand the economic impact of development their analysis in lafayette uncovered a harsh reality that should be
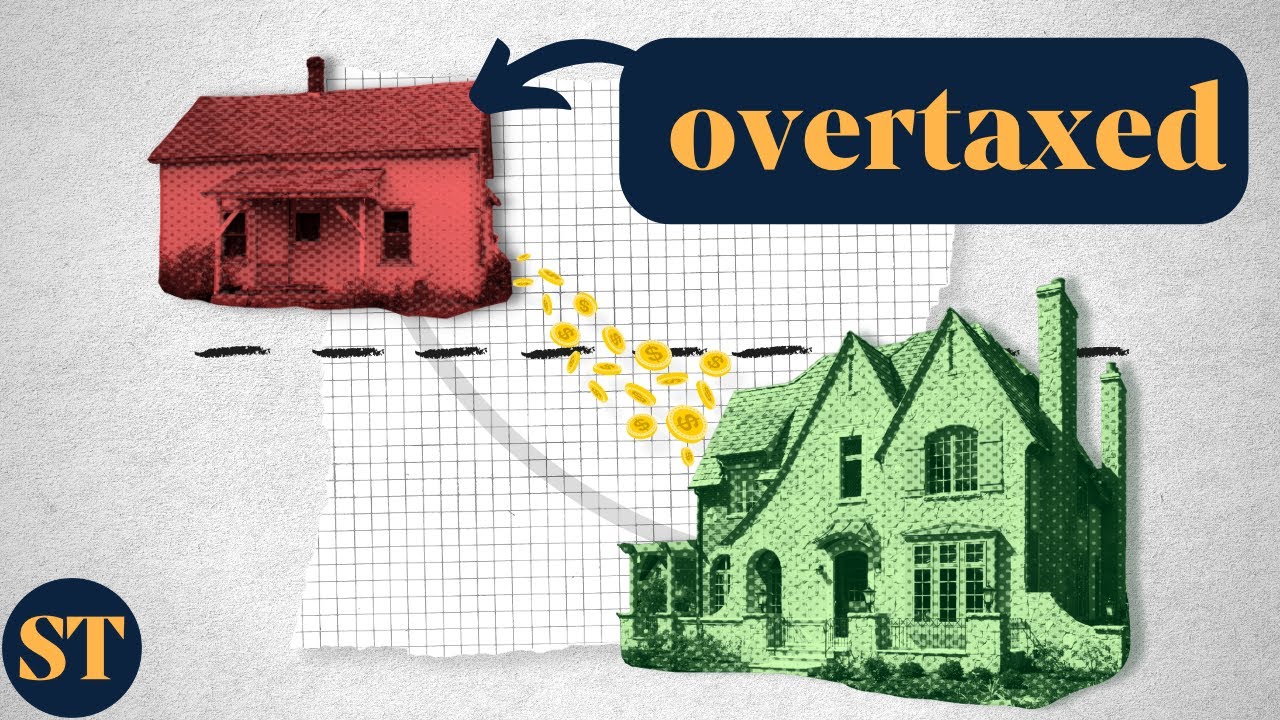
a wake-up call to every municipality in north america as well as any city emulating the american car-centric style of development but let's back up a bit in a previous video in this series we discussed how two identical lots in the same city have very different property tax revenue in this example a 100 year old commercial block built in the traditional style of development drastically outperformed a shiny new development created in the modern car centric style but despite the differences in revenue both blocks have the same cost of the city to maintain their infrastructure so by
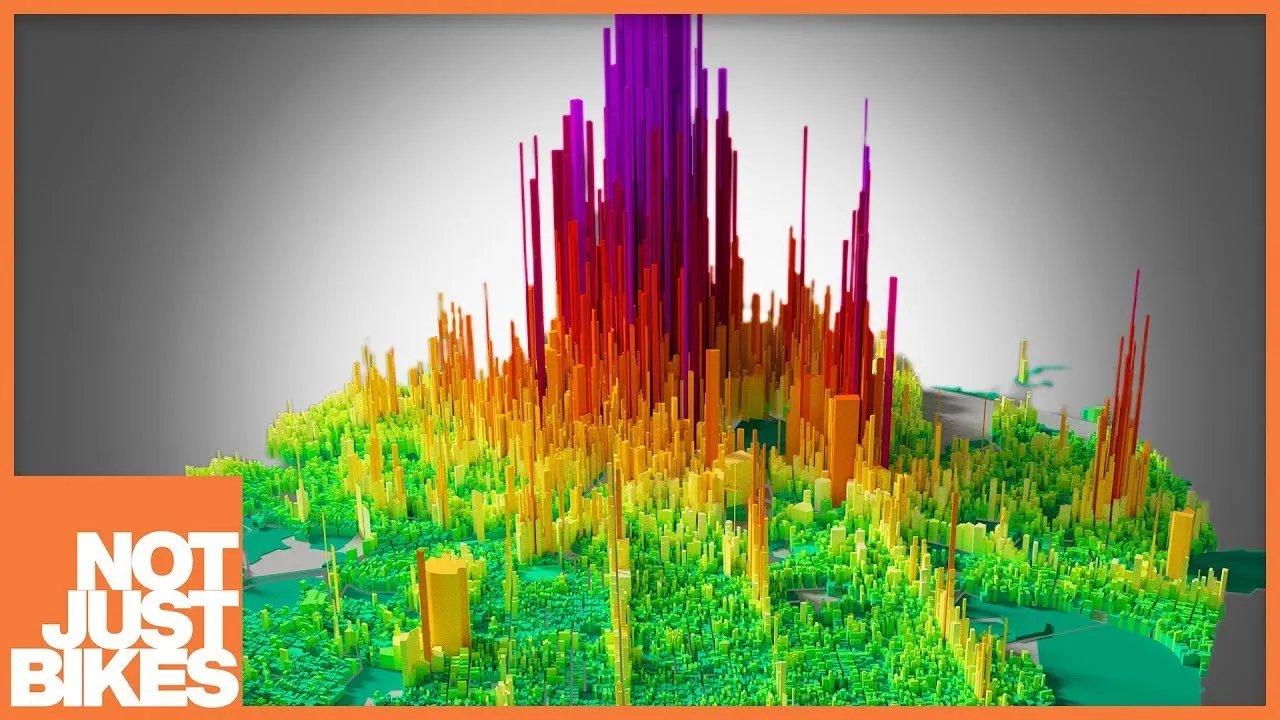
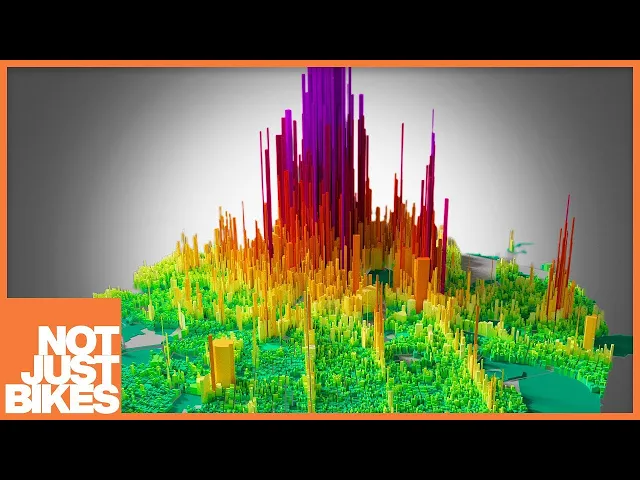
bulldozing an old block of shops to build this car-centric second-rate taco joint the city was destroying its wealth this example alone should be enough to convince anyone that the modern car-centric suburban style of development is broken but it's worth exploring this further does this hold up in other cities and what happens when we bring into account the cost of servicing these properties with roads water pipes sewers etc and that brings us back to lafayette this is a map of the revenue and expenses data uncovered by urban three so what are we looking at well any
successful business tracks its roi its return on investment when making a decision between two competing projects it's critical to know which one will result in the most revenue compared to the investment put into it and too many projects with a negative return on investment could bankrupt a company but in order to know your roi you need to know two things your revenue and your expenses urban three created a kind of municipal return on investment for lafayette this map shows the municipal revenue per acre so why per acre other than the fact that americans can't use
metric well every property in a city needs services and the majority of services get more expensive the more spread out they are roads are the obvious example the farther a parcel of land is from everything else the more asphalt is needed to get there the worst case scenario are kulsdesac which are basically just city subsidized driveways this also applies to water infrastructure sewers and all other physical infrastructure as well as the cost of policing fire department coverage and even the cost of providing education but while per area revenue is actually quite a good approximation urban
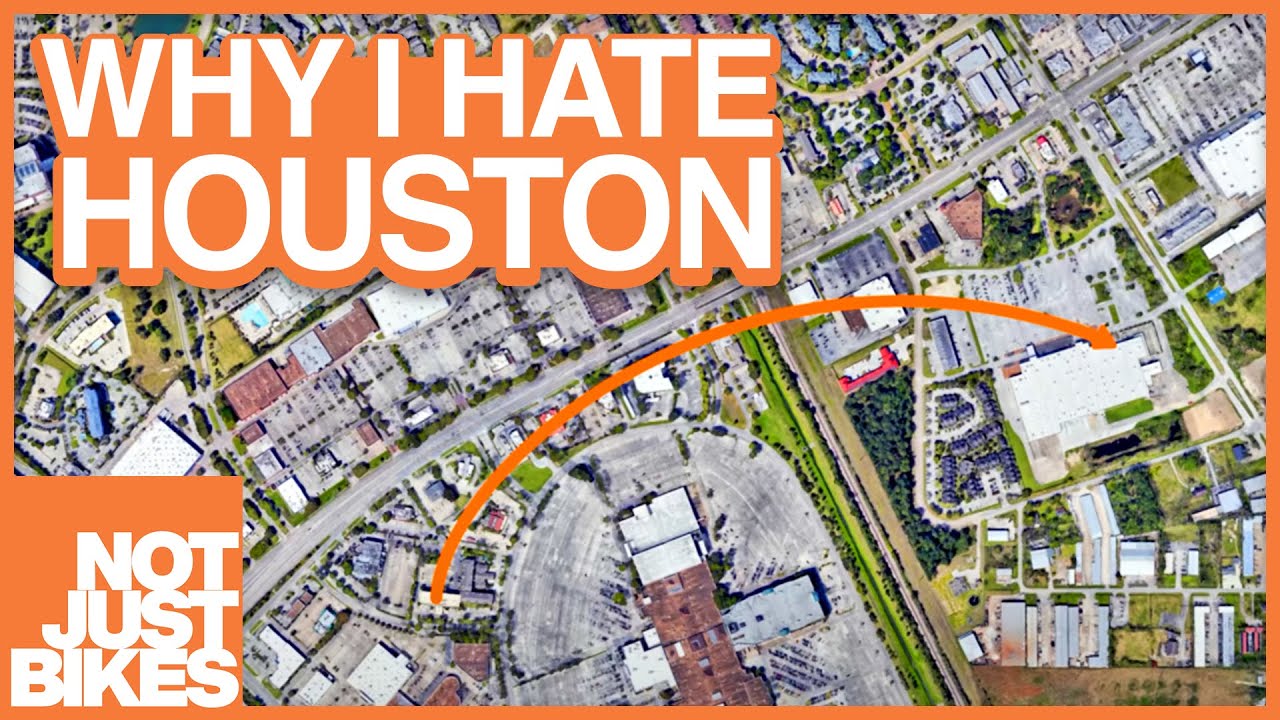
3 wanted to fully understand these expenses so they painstakingly calculated the cost of services for each parcel of land in lafayette it looks something like this this shows every area that's a net positive for the city in gray and every area that's a net negative in red and here it is in 3d this analysis has some fascinating results the first is that downtown is wildly profitable this is a bit surprising because there's nothing particularly remarkable about downtown lafayette it's certainly not bad but you'd never know from looking at these pictures that this is the economic
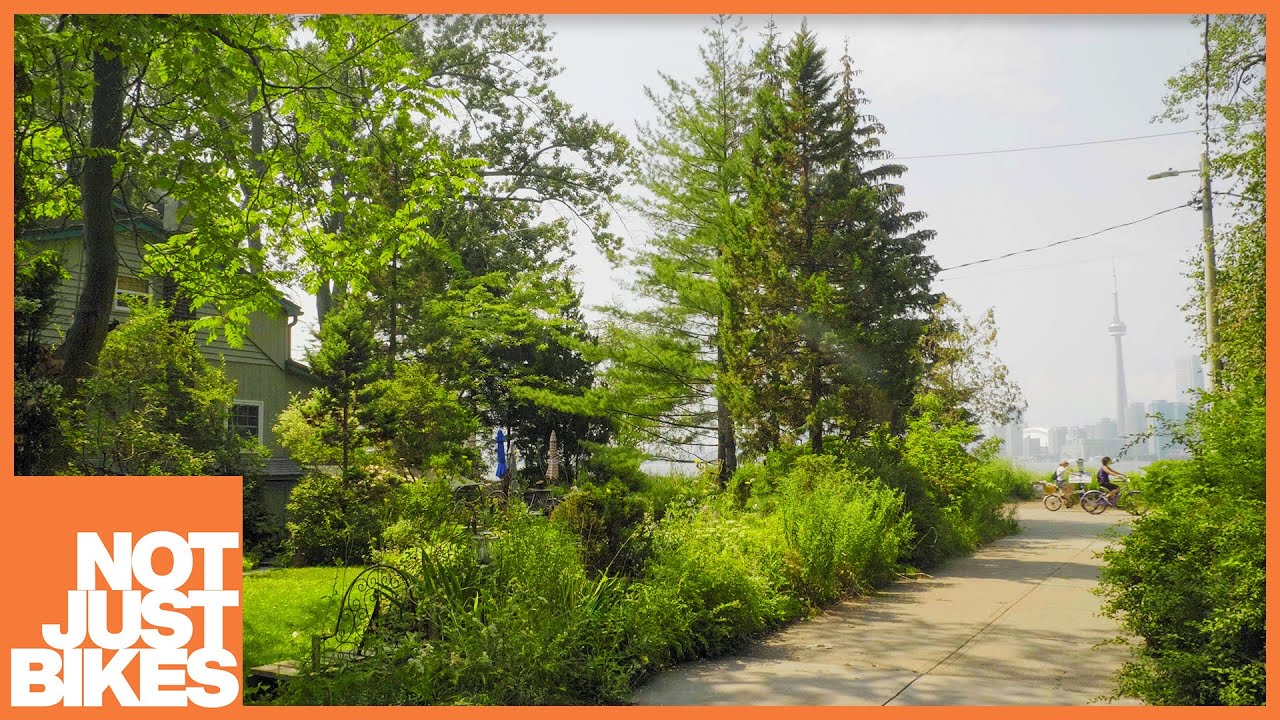
engine of the city while places like this are a drain on city finances but this shouldn't be too surprising when you think about it because there's an insane amount of asphalt and infrastructure here for a very small number of shops and for some bizarre reason the google street view car drove down every aisle of this parking lot but since they did it over multiple years you can move down this way and watch the toys r us go out of business most of these profitable grey areas are the historical neighborhoods built along the river but one
of the biggest spikes is this place a modern mixed-use walkable neighborhood called river ranch places like this are a net positive for the city one of the most shocking discoveries that strong towns discovered is that the replacement cost of all of the infrastructure in lafayette something that you would expect to happen over about one generation was about 32 billion dollars and that's just infrastructure not all the other everyday costs needed to run a city yet the existing tax base was much smaller than that in order to bridge the difference strong towns calculated that the average
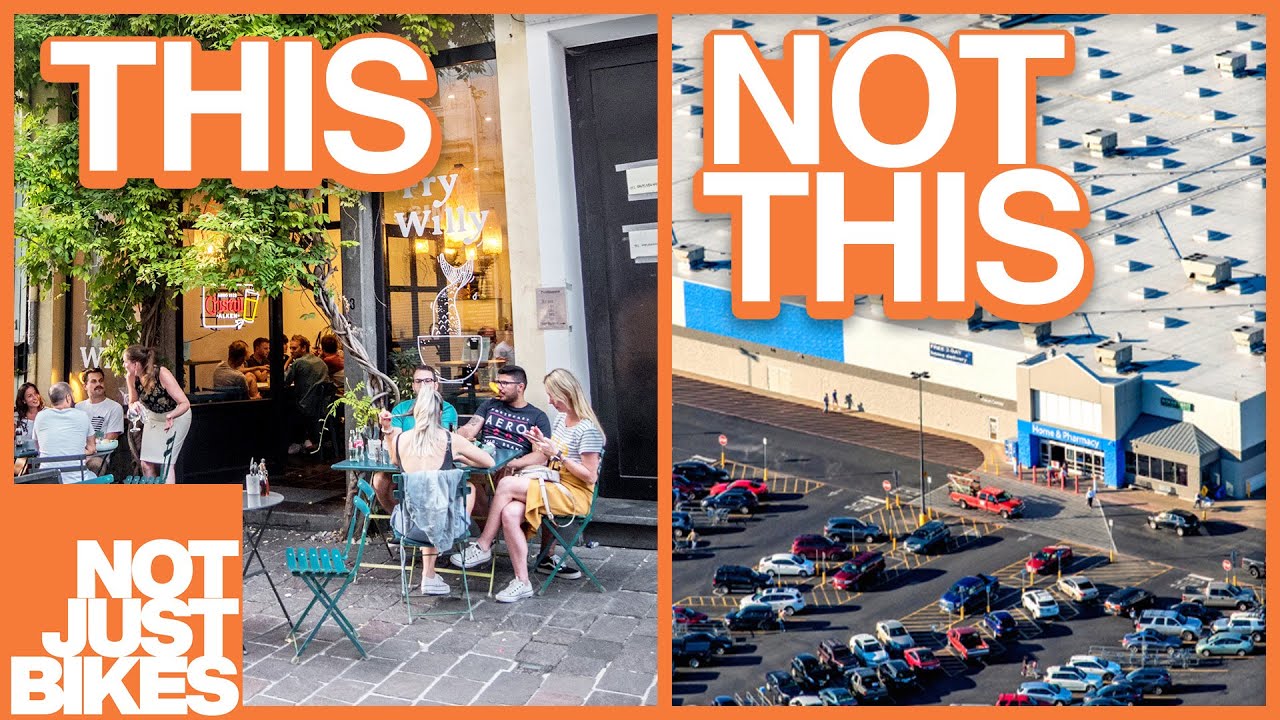
family in lafayette would see their tax bill go from about one thousand five hundred dollars per year to nine thousand two hundred dollars per year but the median household income in lafayette was only forty one thousand dollars at the time there's simply no way that can happen but those simple averages are hiding the bigger picture of who's subsidizing who because these gray sections are the poorer areas while these red areas are significantly wealthier so here's a fun quiz which of these two neighborhoods is subsidizing the other number one or number two yeah it's the first
one that's subsidizing the second the poorest people in lafayette are consistently subsidizing wealthy suburbanites but i don't want to pick on lafayette here as i said at the beginning there's nothing particularly unique about lafayette and these results are typical for most american cities well i guess in lafayette the suburban sprawl is built on former wetlands which results in unusually high costs for storm water management but otherwise it's pretty typical so let's look at another city that's not literally built on a swamp eugene oregon here's the urban three map of taxable value per acre once again
downtown is clearly visible and here's the 3d map of revenue compared to expenses it's still obvious where downtown is but you might be wondering about this little bump over here this is crescent village a modern mixed-use development because once again these kinds of mixed-use walkable neighborhoods financially outperform car dependent suburbia every single time by the way here's what that 3d map of eugene looks like from below the red spikes correspond almost perfectly to modern car-centric suburban developments a visual reminder that car dependent suburbia is being subsidized by productive urban places the data from urban 3
makes the subsidies visible and it makes it very clear who's subsidizing who in eugene urban 3 analyzed 9 categories of development residential mixed use and commercial in low medium and high density and here's what the average revenue for the city looked like after taking into account the servicing of these properties in the case of eugene the low-density suburban housing is being subsidized by everything else people may look at this and say but i want to live in a low density single family home and that's fine but only if you're also willing to pay for it
but there's a bigger problem this is what the land use map looks like for eugene oregon the majority of land is zoned exclusively for single-family residential which means that the majority of properties in the city are a net negative to city finances and this is a pretty typical result for an american city when you see results like this is there any surprise that american cities are broke here's the tax revenue per acre for south bend indiana see if you can spot downtown or here in charleston south carolina or in saint paul minnesota and here's the
entire state of new hampshire with all of the traditional downtown neighborhoods clearly visible in every case in every region urban 3 is analyzed traditional mixed use walkable neighborhoods dramatically outperform car-centric suburbia but in north america we've made it difficult or even impossible to build new neighborhoods this way because of modern zoning and other car-centric regulations of course these mathematics apply outside of america as well here's a map of auckland new zealand you can clearly see the increased city revenue along transit lines and you need to zoom out significantly to see downtown because it is so
financially so what do we do with this information well our cities through their policies can decide what kind of developments they encourage the city of guelph in ontario canada not far from my hometown is an excellent example in 2013 guelph needed more room and like all canadian cities they were considering expanding their borders and sprawling but after running this kind of roi analysis they decided to focus on infill developments by making it cheaper and easier for developers to create buildings that encourage walkable neighborhoods like this one here's with a revenue per hectare because canada looked
like for guelph in 2013 not bad in general canadian cities are better with their finances than american cities but here it is in 2016 and in 2019 this is what a financially solvent city looks like so which path will the financially struggling american cities choose for their future they can decide to make it easy to build mixed-use walkable neighborhoods making good use of land and encouraging walking cycling and public transit or they can build more of this garbage and go bankrupt seems like a pretty easy decision to me i'd like to thank my supporters on
patreon who pay me to mathematically annihilate the suburbs in 3d if you like this kind of content check out strong towns in urban 3 and if you really like this kind of video visit patreon.com not just bikes you
![Would You Fall for It? [ST08]](https://img.youtube.com/vi/n94-_yE4IeU/maxresdefault.jpg)
![How Bankrupt American Cities Stay Alive - Debt [ST04]](https://img.youtube.com/vi/XfQUOHlAocY/maxresdefault.jpg)