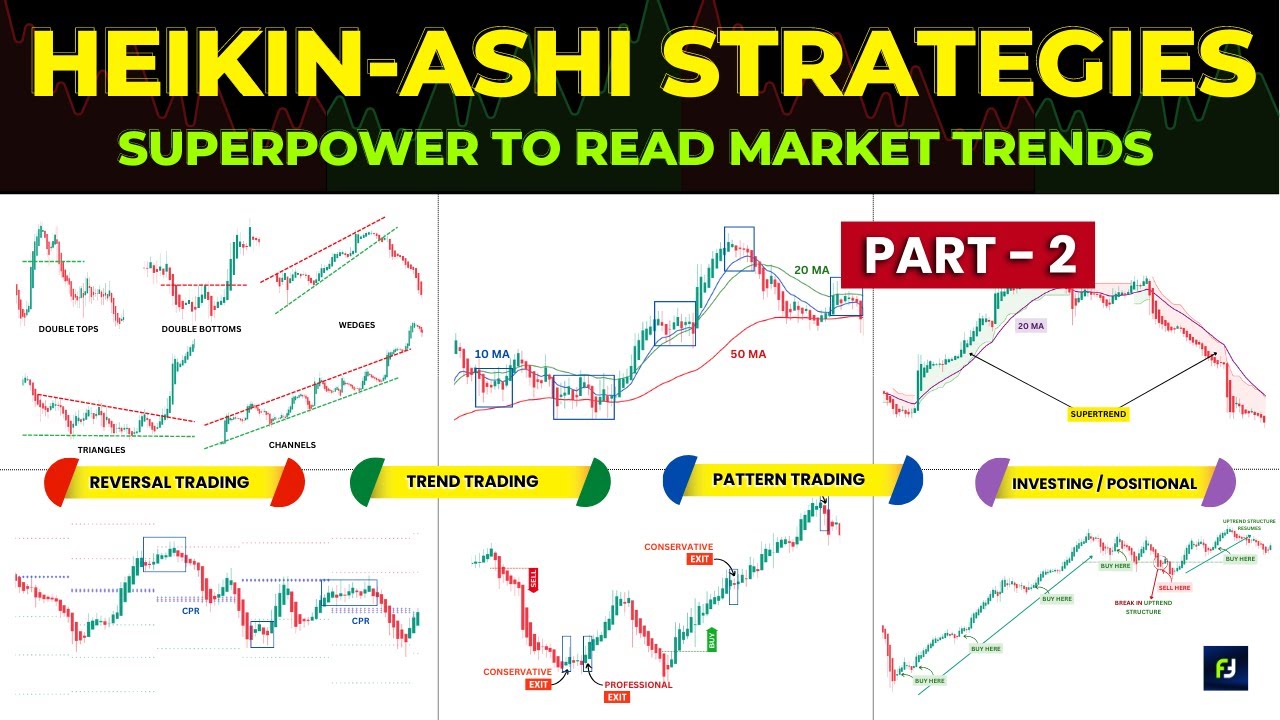
Heiken Ashi charts are very powerful when combined with price action analysis. The idea is simple: you look for the emergence of new trends, or for the reversal of already existing ones. In today’s video I will share a trading strategy I’ve been back testing lately with promising results, strategy with is mainly price-action based, using Heiken Ashi charts, one exponential moving average and the rising wedge pattern.
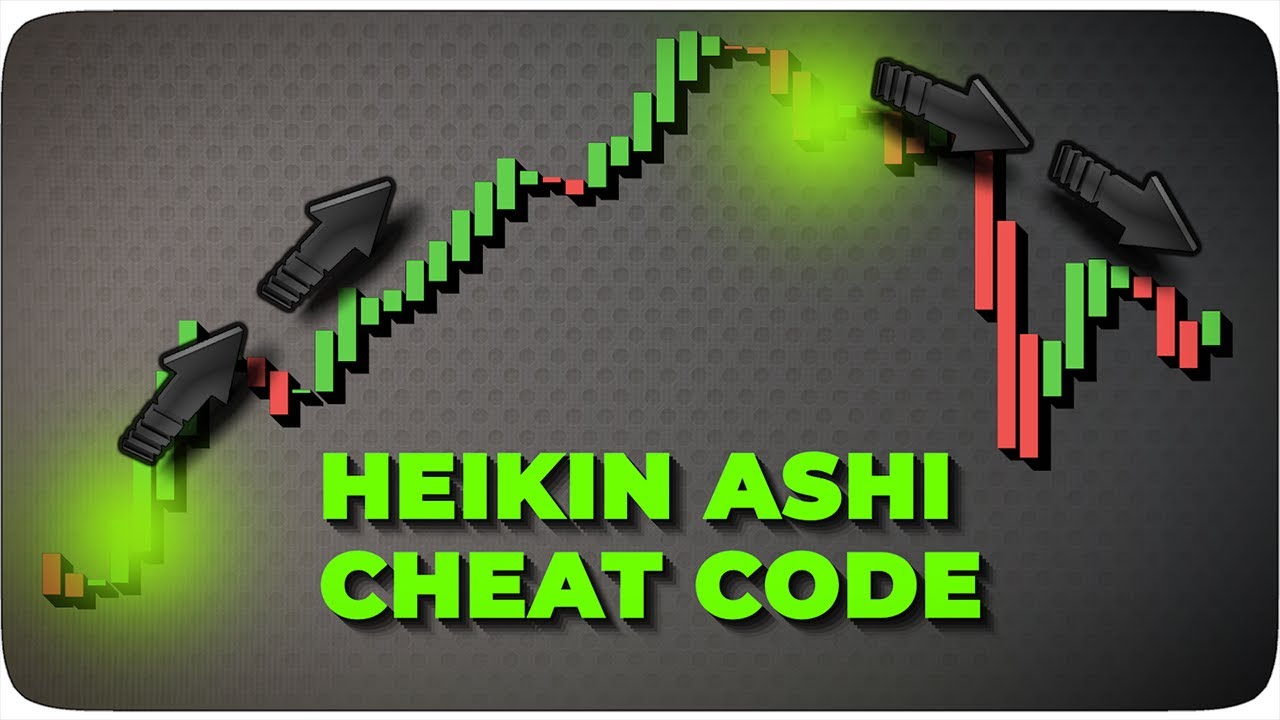
Heiken-Ashi candles essentially capture the pace of price. What I like about Heikin Ashi charts is that candles don’t change colour until the trend changes, and as a result, these charts generally have longer runs of green or red candlesticks. There is a tendency with Heikin-Ashi for the candles to stay red during a downtrend and green during an uptrend, whereas normal candlesticks alternate color even if the price is moving dominantly in one direction.
Another major advantage is that Heikin Ashi charts provide much simpler interpretations as there are not as many patterns as there are with candlestick charts and the averaging of the open and close prices means that trends are easier to identify. In essence, Heiken Ashi make trends easier to spot and helps traders to remain longer in trade. Each of the Heikin Ashi bars start from the middle of the bar before it, and not from the level where the previous candle has closed.
This is a major factor between the standard and HA candlestick patterns. And this is important to know because in this way, you filter noise, foreshadow reversals and identify more easily classic chart patterns. There are five primary signals that identify trends and trade opportunities: • green candles signify an uptrend • green candles with no lower “shadows” indicate a strong uptrend • candles with a small body surrounded by upper and lower shadows indicate a trend change • red candles indicate a downtrend • red candles with no higher shadows identify a strong downtrend The second component of the strategy is the rising wedge.
The Rising Wedge is a bearish pattern that begins wide at the bottom and contracts as prices move higher and the trading range narrows. While the rising wedge is mainly a reversal pattern, this formation can also fit into the continuation category. As a continuation pattern, the rising wedge will still slope up, but the slope will be against the prevailing downtrend.
As a reversal pattern, the rising wedge will slope up and with the prevailing up trend. Regardless of the type (reversal or continuation), rising wedges are bearish. The rising wedge can be one of the most difficult patterns to accurately recognize and trade.
While it is a consolidation formation, the loss of upside momentum on each successive high gives the pattern its bearish bias. However, the series of higher highs and higher lows keeps the trend mainly bullish. What we need to identify is the final break of support.
Also, the rising wedge chart pattern forms when price consolidates between two converging support and resistance lines. In this case, the support and resistance lines both have to point in an upwards direction and the support line has to be steeper than resistance line. The third component of our strategy is an exponential moving average, mainly to confirm the wedge breakout that we intend to trade.
We will use an exponential moving average because it exhibits a lower lag than a simple moving average, which makes it better for identifying how the price behavior may be changing. The choice of moving average length is largely dependent on the time frame you’re analyzing and your trading style. A 50 EMA or 100 EMA are good potential averages you could use.
With the addition of the exponential moving average, you basically analyze price crossovers. When you identify a wedge breakout, you want to see price moving below the EMA, to confirm the momentum shift to the downside. The full strategy involves finding a rising wedge pattern on a Heiken ashi chart, and trade after the price breaks the pattern, below the exponential moving average.
Here are the 10 main aspects of this strategy: 1. Heikin-Ashi: Heikin-Ashi filters out market noise and reduces small corrections making the signals more transparent. The smoothing effect makes it easier to find our rising wedge pattern.
2. Prior Trend: In order to qualify as a reversal pattern, there must be a prior trend to reverse. Sometimes the current trend is contained within the rising wedge; other times the pattern will form after an extended advance.
3. Upper Resistance Line: It takes at least two reaction highs to form the upper resistance line, ideally three. Each reaction high should be higher than the previous high.
4. Lower Support Line: At least two reaction lows are required to form the lower support line. Each reaction low should be higher than the previous low.
5. Contraction: The upper resistance line and lower support line converge as the pattern forms. The advances from the reaction lows (lower support line) become shorter and shorter, which makes the rallies unconvincing.
This creates an upper resistance line that fails to keep pace with the slope of the lower support line. 6. Support Break: Bearish confirmation of the pattern does not come until the support line is broken in a convincing fashion.
As I said earlier, the breakout is the signal we will use as our entry signal. Once support is broken, there can sometimes be a reaction rally to test the newfound resistance level. 7.
Volume: Ideally, volume will decline as prices rise and the wedge evolves. An expansion of volume on the support line breakout can be taken as bearish confirmation signal. 8.
EMA breakout: After the market breaks down through the lower support line, it should also break below the EMA, and ideally should remain below it. 9. Profit Target: Usually, you should aim to have a risk-reward ratio of 2 or more.
Rising wedges are said to have a price target that’s equal to the widest distance of the wedge. You measure the distance of the wedge and you project the distance on the breakout point. 10.
Stop Loss: Generally, you should place the stop loss to give the market some room to move. False breakouts are quite common, and by giving the market some extra room to play with, we may avoid some of these! The high of the wedge is a good start for an initial stop loss, which could be moved as the market makes lower lows.
Here an example of a rising wedge we found on this Heikin Ashi chart. - we have the prior uptrend - the upper resistance line and lower support line converged as the wedge pattern formed. The slope of the lower support line is steeper than that of the upper resistance line.
Less slope in the upper resistance line indicates that momentum is weakening as the price makes new highs. - the price tested the support line before finally breaking with a sharp decline. The previous reaction low was broken after this Heikin ashi candlestick - volume decreased before the support line was broken.
And there was an expansion of volume after the breakout, which is a good sign that the market has shifted to the downside - entry below the breakout point with a price target that’s equal to the widest distance of the wedge - and stop loss above the high of the wedge. Another effective confirmation is a bearish divergence on a momentum indicator. The rising wedge pattern in an uptrend signals exhaustion of momentum.
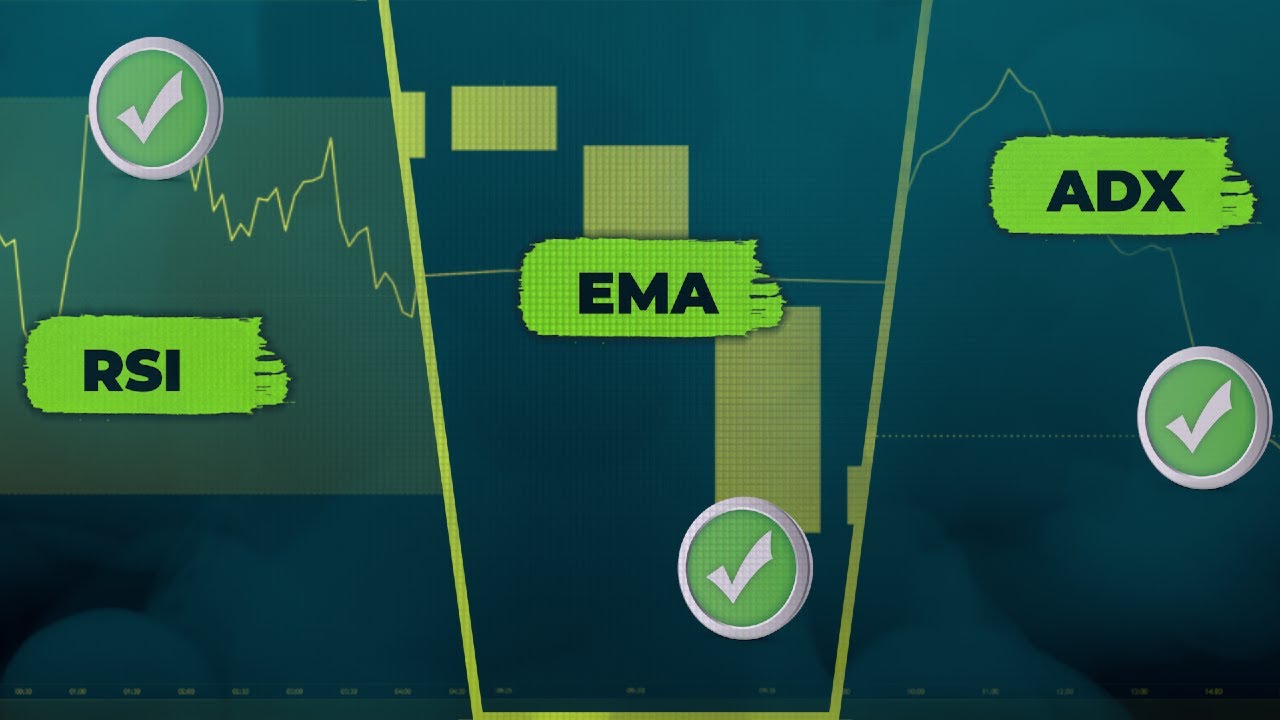
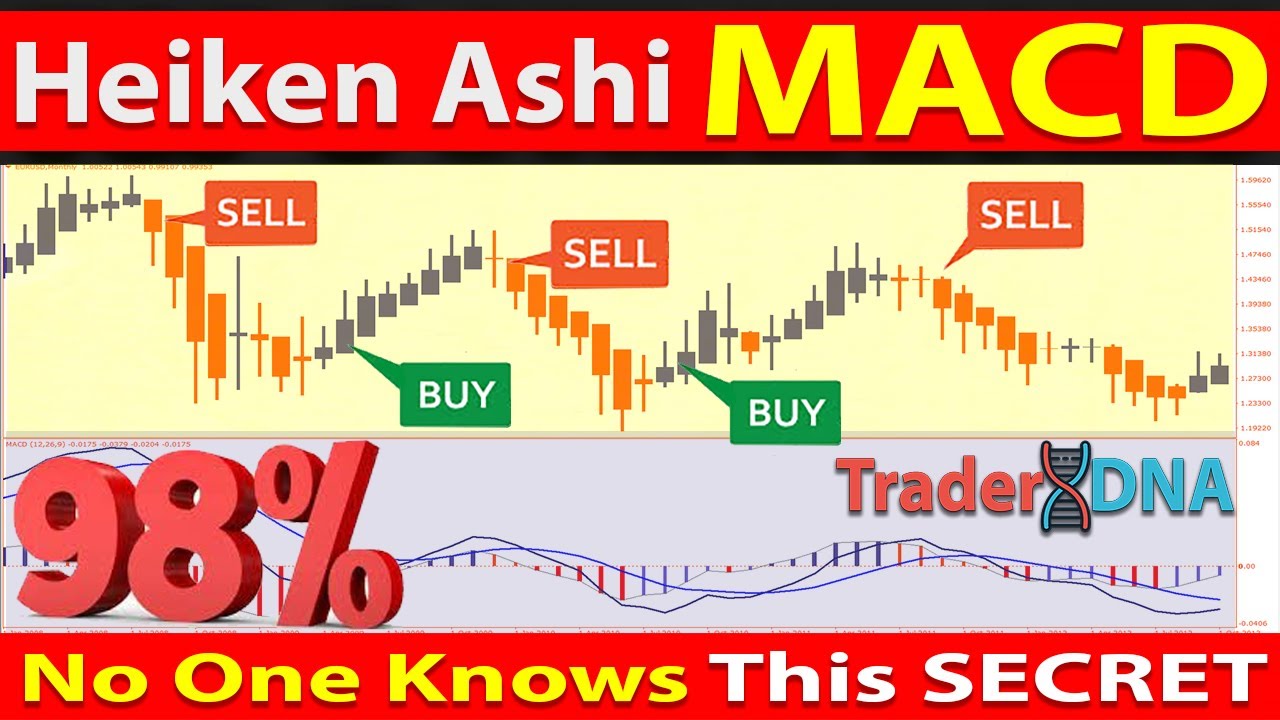
You can confirm this exhaustion in another way, when a technical indicator will disagree or “fight” with the actual price action. A divergence appears when a technical indicator (like RSI,MACD, Stochastic) begins to establish a trend that disagrees with the actual price movement. The disagreement or divergence between bullish price action (higher highs) and the trend of the oscillator (lower highs) is another clue that the market could go down.
If in the previous examples, we traded the setup as a bearish reversal pattern, we can also trade it as a bearish continuation pattern. In this case, the price came from a downtrend before consolidating and forming higher highs and even higher lows. As a continuation pattern, the rising wedge will still slope up, but the slope will be against the prevailing downtrend.
During the formation of a rising wedge during a downtrend, there are the same clues that can be used to determine whether the pattern is worth trading: - the upper resistance line formed with minimum 2 successive higher peaks. - the lower support line formed with minimum 3 successive higher lows - price contraction with the slope of the lower support line steeper than that of the upper resistance line - the volume declining as price was rising. And an increase of volume after the support line breakout - and additionally, you could look for a divergence on a momentum oscillator There are many false patterns or patterns in disguise that may come off as a rising wedge.
That’s why we are using Heikin Ashi charts, instead of traditional candlesticks, to eliminate noise on the chart and keep the dominant trend in display. In addition, the other way to differentiate a true rising wedge from a false one is by finding price/volume divergences. When the breakdown does happen, you have the green light to go short.
Here are several example of valid trades. As always, if you learned something new and found value, leave us a like to show your support, subscribe to our channel and click the bell icon to stay notified every time when we upload a new video. Until next time.