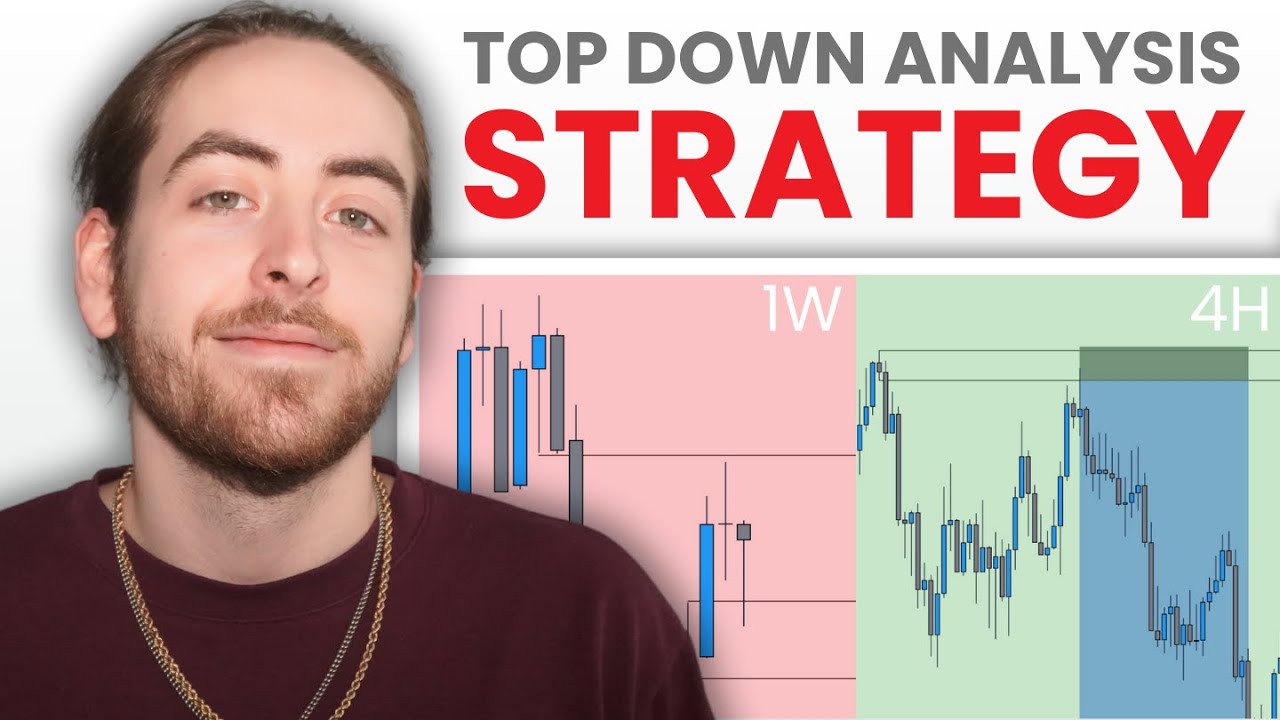
[Music] hello there I hope that you are doing well welcome to episode two of the Zusi 2025 public mentorship on YouTube during this episode I will be discussing institutional order throw with you if you did not watch the first episode yet I highly suggest you to watch that episode First Market structure as understood by the masses in front of you you can see a screenshot of how the majority of Traders out there are looking at Market structure if bullish they are looking at the markets to make higher highs higher lows higher highs higher lows Etc
and there's a process which repeats itself infant when bearers they looking for lower lows lower highs lower lows lower highs lower lows lower highs Etc and the reason why the MS are looking at Market structure this way is because this is the easiest way of defining swing points within the markets however I want to ask you something if you have ever tried to look at the market through this lens how many times did you see the falling Ur where you saw the market create a lower low whilst you were anticipating a higher low and you
were told that this would be a market structure shift break the market takes you out by running below that low where you had your stop loss placed and then all of the sudden it begins to run higher and if bearish for example you were looking at lower prices you saw the market run lower we formed this High We formed a lower low so now you're anticipating a lower high but what occurs is that the market reprices above that high right here it creates a higher high and then it gets labeled as a market struct shift
break and then all of the sudden you get taken out and then the real move occurs this right here is the issue with the perspective on Market structure as understood by the majority of Traders out there and the reason why this is a big issue is due to the fact that this is simply a too simplistic approach to looking at the markets meaning there must be an underlying logic behind why a certain low or high should remain intact within the one-sided orderflow which is present and that is where institutional order flow comes in place in
order to fill in that Gap it comes in to fill in the Gap behind why a certain lower high should remain intact and that is what I will be explaining during today's lecture institutional order flow institutional orderflow or I shows to you in what direction the market is being repriced notice I'm saying it shows to you in what direction the market is being repriced I am not saying to you that you can see in what direction the market is being bought or sold there's a big difference there bullish institution order flow shows to you that
the market is being repriced higher bearish institutional order flow shows to you that the market is being repriced lower now before we dive into how to define bullish and bearish institutional order flow we must first take a side jump towards premium and discount arrays premium and discount arrays are algorithmic signatures that show what algorithms are currently doing in the market I will share with you the most important PD arays to focus on to determine the institutional order flow meaning I will not share with you the full PD list as created by the Inner Circle Trader
Michael J hodon I have selected a few which I will be explaining during this lecture because they are the most important for being able to gouch or determine the order flow the first PD aray which we're going to take a look at is the fair value Gap the fair value Gap can be seen on the left of my screen where I can see these three candles right here notice that there is a difference between the high of the first candle and the low of the third candle let me explain you can see that this first
candle expanded higher the second candle also expanded higher and it expanded through the high of the first candle the third candle then opened up went lower for a bit but it didn't go as low as the price level at which the high of the first candle formed therefore there is a lack of cide delivery inside of the range between the high of the first candle and the low of the third candle therefore there's a lack of sside delivery which has taken place inside of the price range which is annotated by this gray box what IPA
has to do it has to retrace back into that price range it has to offer sell side and once the market reprices away from this bullish F fire gap that's when the price range has become balanced but that's a topic for another time later during the mentorship but for now this is what a bullish F Gap looks like where you can see that there's a difference between the first candle High and the third candle's low here you can see that I've also added the bearish for fire gap schematic on the right the bearish ref fire
gap is exactly the opposite of the bullish ref fire gap on the left meaning on the right you can see three red candles and these red candles represent down close candles these down close scandles make up one Fair fire gap and to specify these three down scandles make up one Fair fire gap and the reason why this is the case is due to the foing what I want you to see is that there is a difference between the first candles low and the third candle's High there's a lack of buy side delivery which took place
inside of this range therefore IA has to reprice back into this price range of this fair value Gap to over buy side into that range and the moment that price does that we can anticipate that when price expands away from that ver value Gap that this range is now balanced and that we can anticipate further continuation lower taking place therefore pay attention to these Fair Val gaps which form in bearish markets to gou the order flow now before we move on to the next slide I want you to understand that the schematics which are in
front of you are perfect examples of what these surf Val gaps look like and therefore I highly suggest you to make screenshots of these schematics and put them in your study Journal because this is how you recognize patterns within price action you pay attention to what the pattern looks like and then you begin looking for it actively within your charts when we pay attention to the next PD array then it's going to be the breaker which we're going to be looking at the breaker looks like the following where you can see that the market forms
a low high lower low relative to this row and we then see a higher high form and we then pay attention to the UPC scandle which formed inside of this High formation before the market had this final run lower let me repeat that the bullish breaker is the UPC scandle which formed inside of this High formation before the market had its final push lower the moment that the market displaces above that high we pay attention to this UPC scandle and we extend that to the right this upcast scandle is our bullish breaker and we anticipate
that that bullish breaker is going to function as support on price before the market is allowed to be repriced higher the bearish breaker looks exactly the opposing again where I can see that the market expands higher it forms this High we then see the market form a low a high High forms and we then see the market form a lower low relative to this low the last down close candle which formed inside of this low formation before the market expanded higher for the final time that down close scandle is a bearish breaker meaning we can
anticipate that that downcast scandle its respective price range is going to function as resist on price now that price has displaced through it meaning we can anticipate a retracement higher into that range before further continuation takes place now when we pay attention to the breaker schematic what I want you to investigate is whether or not imbalances line up with these Breakers the next schematic which we're taking a look at is called the mitigation block the mitigation block looks exactly the same as the breaker but that's just one exception and that's the falling what I wants
to see is that the market expands lower we form this low the market retraces and and we form a high and the market has one more pushy lower but notice that the previous low which formed does not get taken out instead we see a higher low form and the market displaces higher we see a retracement taking place into what into the last upcr scandle which set up this run lower which set up the creation of the higher low that upgr scandle is our bullish mitigation block and has to function as support and price in order
for continuation High to occur when we pay attention to the bearish mitigation block you can see that's exactly the opposite of the bullish mitigation block where I can see that the market expands higher we form this High we see the market drop lower suddenly a new low forms then the market has one more push higher but notice that the market does not create a high high relative to this High instead a lower high gets cread the market then this placees below the low which set up this push higher and we then anticipate that this final
down scandle is going to function as resist on price the reason why is because this is our bearish mitigation book now what I want you to understand when looking at these schematics is that these schematics are simply schematics that showcase to you a certain logic and the logic which is being shown to you is that the market has to retrace into specific levels before it's allowed to continue towards the downside what I want to invite you to study is with regards to every single reversal that takes place in the market whether or not there are
any reversals that do not contain a breaker or a mitigation book and that is going to be a fun study and let me warn you you are not going to find any examples of there not being a mitigation or breaker block being in play because every single reversal contains a mitigation or a break akak Brook and that is a very fun study for you to do and next that I invite you to investigate whether or not imbalances are forming close to the breakers and mitigation blocks let us now take a look again at institutional order
flow now that we have discussed dpd Ras we're first going to take a look at bullish institutional orderflow bullish institutional orderflow shows to you that the market is being repriced higher bullish institution order can be recognized by seeing discount Ray function as support on price and premium race failing to function as resistance on price however I want you to be aware of the following statement when it comes to all of these price patterns price is of no use until it is aligned with time meaning until time is right all these price patterns means absolutely nothing
and this is a statement which you will be discussing later Jour this mentorship more in depth I'm first explaining price to you before I can dive into time let's take a look at a chart example here we can see a chart example of bullish institution orderflow being in play what I've done is I've already marked up the chart before showcasing it to you the reason why I'm doing so is because I want to explain to you the application of recognizing these PD Rays within the charts so that you can then investigate your own charts and
look for these PD arrays to form during future I will not annotate the charts as in detailed as I did now before I showcase the chart in the first place and I will invite you to investigate the chart before I put on my lipstick but for this first chart which I'm sharing I've decided to put the lipstick on so what I want you to see is the flowing what I want you to see is that the market was in a sell program I want you to see that the market was dropping lower and you can
see that it was repriced towards the downside notice that during this run lower this imbalance right here formed there was a lack of buy side delivery between these three candles between Candle One Candle two and candle three notice that candle Tre did not create the high in Cross proximity to the low of the first candle and therefore you know that this is a CB this is a bearish fair value Gap we see the market then drop lower we see a low form and a retracement higher takes place this retracement higher has one function and that
is to trap people into believing that the low is in the market drops lower one more time and during this sudden drop lower you see a CB form a CB is referred to as a bearish fair value Gap a bullish value Gap is referred to as a BC and that is something for your notes the price patterns are exactly the same but this is just a terminology thing what we can see is that the market eventually forms a low and it then displaces through this blue box through the price range of this CB to the
price range of this bearish F fire gap notice that we reprice above it and the F fire gap then begins to function as support on price this right here is a premium array on the left side of the curve functioning as support on the right side of the curve and remember what the outline to you when it claim to bullish orderflow let us go back one slide bullish institution order can be recognized by seeing discount array function asort on price and premium Rays failing to function as resistance on price if the market would have continued
to be bearish it would have utilized this CBS resistance on price to draw lower but the fact that it didn't is already it that tipping is hand to you that a change in state of delivery might be taking place soon where the market is changing from sell program where it is drawn towards sell sh Equity to buy program where it's drawn towards buy side equity however if you want to wait for more confirmation what do you wait for you wait for this upcr scandle is high to get this play through because this UPC coose scandle
is your bullish breaker where you saw a low high lower low high high therefore you anticipate that this upost scandle is going to function as support on price if we're in fact going to see higher price taking place soon notice that we repriced outside of the range of that upcast candle with this bullish R Gap with this BC notice that the market spend some time inside of this blue shaded box which was that CB which had outlin prior and notice that when we closed above it we retraced back into the lower end of that price
range back into that BC formed a new low before the market began expanding towards the upside notice that every single bullish F value Gap such as here which formed and here functioned as support and price until the drawing Equity of this buy side Equity pool Above This high was reached notes that the market retraced into this bullish forol Gap and then expanded higher creating a new bullish for fire gap the market retraced into that range before expanding higher now I will teach you later how to establish the point of interest and draw Equity but for
now I simply want you to investigate liquidity and DPed aray in order to gou the order flow in order to determine what side the market is likely going to draw towards this is the example of bullsh institutional order flow done where you can see that the premium Ray switch formed on the left side of the curve failed to function as resist on price and therefore we can anticipate that the underlying order flow is changing from sell program to by program now before we continue with this lecture I don't know exactly how many minutes we're in
right now but I hope that you're paying attention to the level of detail in my explanations because it is the order or the so-called sequence that I utilize to explain what I'm explaining to you that matters it's the sequence of events that lead to the next events taking place because when you can recognize the sequence which is currently taking place we can logically anticipate what the next function of IA is like going to be let us now take a look at bearish institution order flow bearish institution order flow shows to you that the market is
being repriced lower bearish institution order flow can be recognized by seeing premium race function as resistance on price and discount arrays failing to function as support on price again price is of no use until it is aligned with time meaning keep in mind that price patterns of PD arays mean absolutely nothing until it is aligned with time and that is again something which we're going to discuss later way more in depth within this MIP but for now function on these pedd arrays and the sequence in which I'm explaining them to you here we can see
a chart example of the bearish market where you can see that I've already annotated the chart and I'm going to walk you through it what you can see here on the left is that since 8 o00 the market was in a rush to run higher notice that there was a lot of back and forth going however during this run higher 8:30 opens up and we see the market continue this rush to reic higher notice again however that there is a lot of chop as I commonly refer to it where I can see just this back
and forth price action and it's just it's very messy it's very ugly but that right there is exactly what we're looking for on the left side of the curve and the reason why we're looking for that is because every single Reta Miner Trader is looking at this repricing high and they're thinking to themselves oh this is a bullish Market we should be buying this market so what they do is they chase price and they place the stop losses below any of the Swing lows which form they can draw up trend lines that are diagonal and
they can draw those trend lines higher like this and they think the repricing higher is just going to continue forever right however what do you see you see that multiple Fair fire gaps get created during this run higher and eventually begin to see these value gaps get overrun where you can see that this BC this bullsh value Gap failed to function as support on price you saw the market tap into it multiple times but eventually you saw the market close below it with this candle notice that the next candle opens up reprices higher back into
the price range of that bullish value gap of that bull shaded box and it then rejects it it slams lower it trades straight into the price range of the next bullish which form on the left side of the curve this is the bullish F fire gap which I'm referring to this blue shaded box notice that during this repricing lower a bearish fi Gap formed meaning you can see that this bearish fi Gap formed between the price ranges of this bullish for Gap and this bullish a fire gap between the blue shaded boxes we see the
market retrace into that CB bu side gets offered and notice how the bodies are respecting that range the wigs go above it but notice that the bodies keep on closing inside of that range until 9:30 distributes lower notice that the wigs are doing the damage whilst the bodies are telling to you the story what I want you to pay attention to is the fact that we saw two CBS get creaded meaning I have one CB annotated but if you pay close attention to this higher CB you can see that this CB also got created but
notice that the market didn't have to retrace into that CB before continuing lower the reason why is because this CB was a breakaway Gap and when you have two imbalances like this meaning you have one imbalance up here and another imbalance below it we can monitor whether or not that higher imbalance is going to be be left intact and the way we monitor that is by determining whether or not the price range is already balanced so that's a little gem for those of you that watch this lecture all the way until where we're currently at
9:30 opens up and we see the market initially run higher trading back into that BC price range before it begins to slam towards the downside noce that it closes below this bullish fire gap on the left side of the curve and below this low next candle opens up offers buyid into this old row into this blue shaded box before it slams lower once more notice that we displace with this CB right here and the market retraces into that CB notice that the wigs keep on going into that CB but the bodies don't even Co inside
of it that right there is telling to you that is a very bearish market and that further sell side delivery is likely going to take place next what can we target we are targeting the sell Equity resting below these relative vle lows because these lows begin the expansion leg higher into a point of interest from which we are seeing a smart money reversal taking place what it will do within in one of the upcoming lectures is I'll explain Market maker models to you in depth once you understand Market maker models you will understand where we
can anticipate opportunities to present itself when it comes to where these PD arrays are like are going to form and that is going to be a very insightful lecture and it's either going to be the next lecture or the lecture after it but with that being said this lecture on institutional orderflow comes to an end during this lecture I discussed the topics of the most important PD arrays with you these are the PD arrays which are required to understand in order to begin looking for examples in your own charts of bullish and bearish Order flow
and what I really suggest you to do is not to treat this mentorship as just you know a series which you're watching just for the fun of it and you're just watching it and treating it as if it is a Netflix series or so no you have now watched this lecture and you have properly taken notes already if you haven't yet I would highly suggest you to rewatch the lecture and take proper notes and when you have taken proper notes I suggest you to go into your own charts and look whether or not there's any
validity behind the things which I'm mentioning during this lecture it doesn't take long for you to realize that these algorithmic signatures are in fact hidden in plain sight so with that being said I hope that you found this actually insightful I look forward to catching up with you in the next one and I wish you all the best with your studies be safe