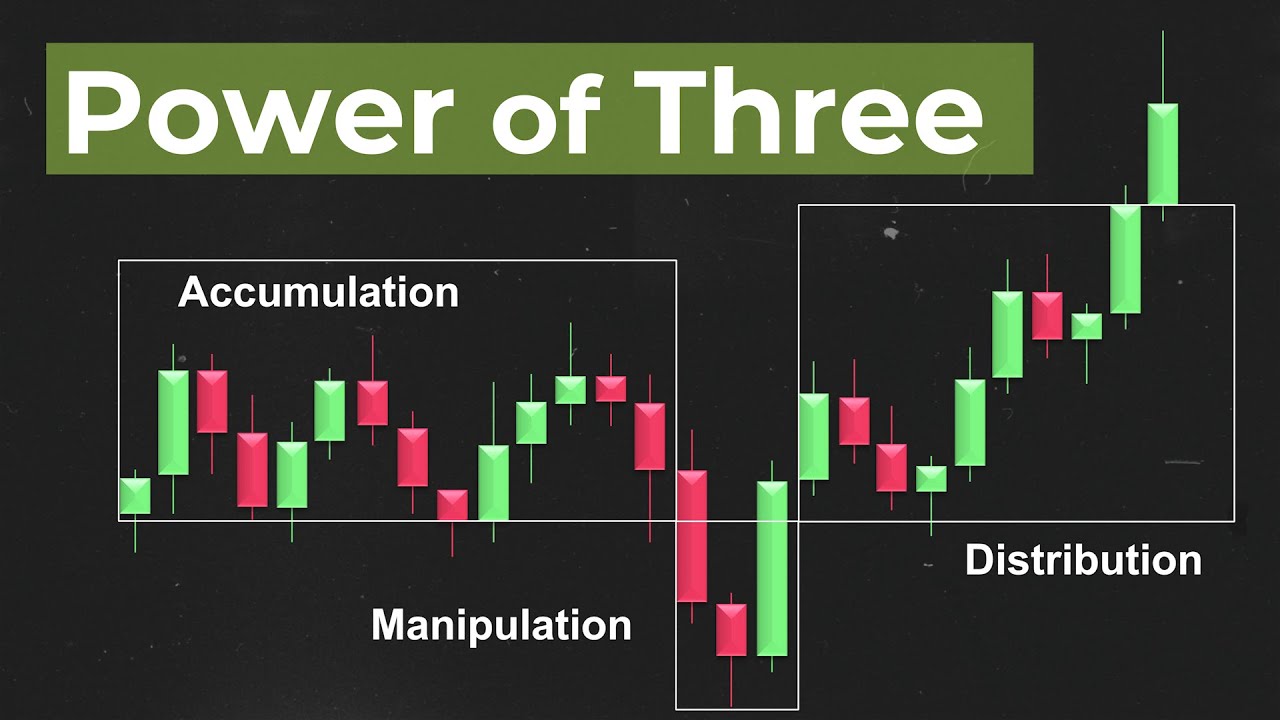
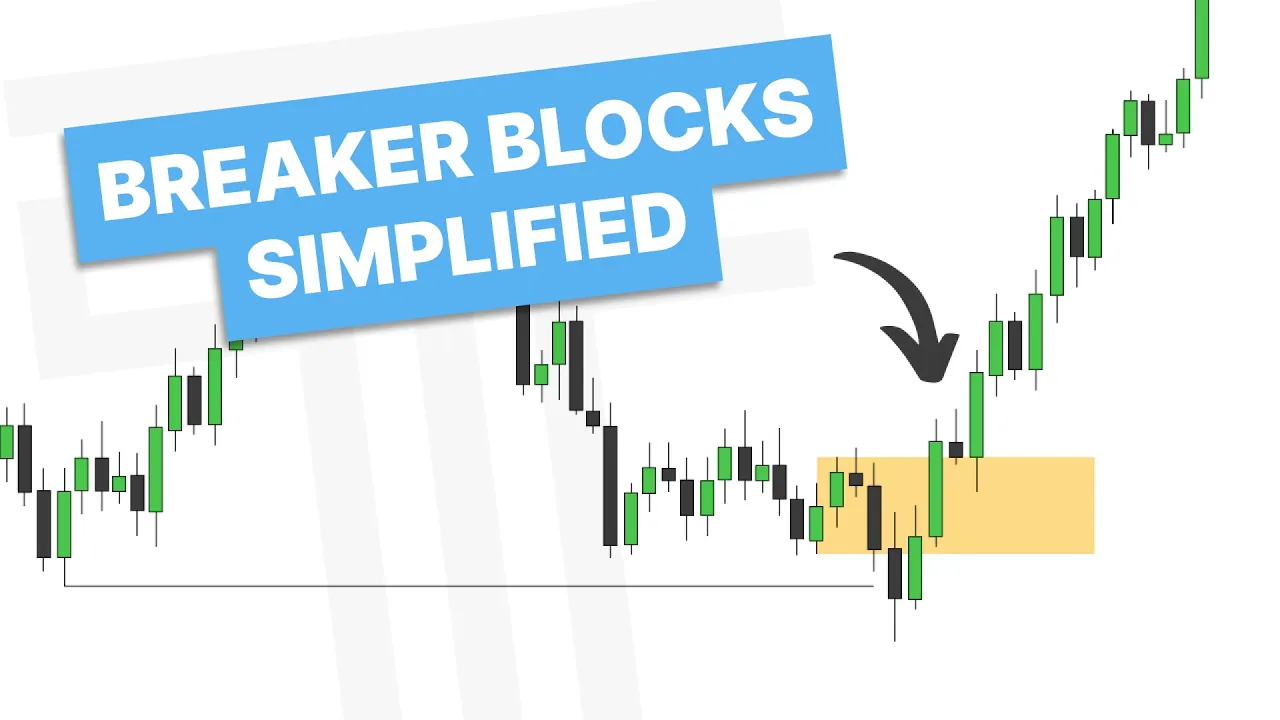
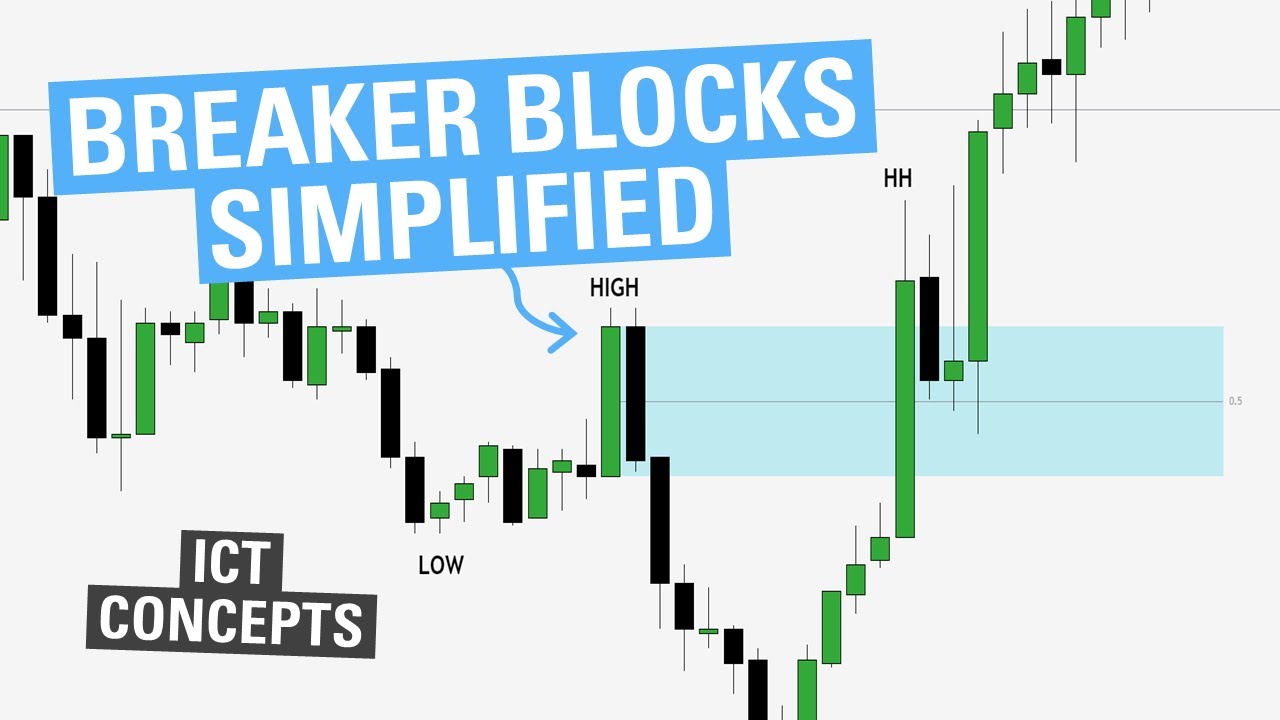
[Music] how's it going everyone happy New Year this video is going to be about breaker blocks but before we get started if you are looking to get access to all my PDFs in one place make sure to join my free Discord as they are all located in the bottom educational section of that with that being said let's hop into the PDF and get started so we are going to learn about breaker blocks we will first go over a bullish breaker block and then a bearish breaker block now a breaker block is a Candlestick pattern in
which we form a low high lower low and higher high so let's go over that so the first thing we have is a low then a high is created then we create a lower low and then a higher high once we have the low high lower low higher high then we have a breaker block formation and then we look for the series or single up close candle here between the low and the high marking that out that is our breaker block and we'll look for a reaction there to continue higher so let's hop into the
charts and go over an example of this so in this example of a bullish breaker block we are looking at gu on the 5 minute chart now with a bullish breaker we need a low high lower low then higher high let's see when a low forms so here we get a potential low marking that out now we're looking for a high here we form a swing high now looking for a lower low you can see we've created a lower low but we want to see when that gets confirmed and put in a swing low so
here we now have a lower low now we're looking for a higher high here we get that so now we have a low high lower low higher high from here I can Mark out the series of up Clos candles here as our breaker block now when price returns to this area we should see a reaction here we retest the breaker block and start to continue higher we come back we sweep this low into the breaker block the bodies are still respecting and we continue higher so just to review we have a low a high lower
low then higher high that formation forms a bullish breaker block marking out the single or series of up Clos candles here dragging it out this is where I look for a reaction when price retests this area now taking a look back at the PDF what do I look for in a bearish breaker block well I want to see a high low higher high then lower low from here I can look for the series or single down Clos candle Mark that out and then look for a reaction there let's hop into another example of a bearish
breaker block so here we are on EU 5minute chart looking at an example of a bearish breaker now if you notice we we have a high right here we now have a low we now have a higher high so now we're looking for a lower low you can see that never forms so this does not form a breaker now looking at it this way we have a high low now we have a higher high up here now if we form a lower low here we form a lower low so now we have that bearish breaker
pattern with a high low higher high lower low so marking out the series of down Clos candles here I'd want to see price retest this area and continue lower and there we go so you can see price retests the bearish breaker here then gets displacement lower now one thing that is important with breaker blocks is I want to see displacement paired with them so for example I want to see a fair value Gap over lined with them and that is what forms the unicorn model the unicorn model is where we have a bearish breaker block
aligned with a bearish fair value Gap a bullish unicorn model is when we have a bullish breaker overlapping with a bullish fair value Gap so let's go back into that example we just went over and see if we can see the unicorn model so rewinding this price action you can see we have a bearish breaker block right here and we have displacement through this breaker block you can see we create a fair value Gap here now this leads me into my next lesson which is stop losses so let's hop back into the PDF before we
finish this example in placing a stop loss there are two things I really look for I Look to place it either below the bullish breaker block and the fair value Gap that is created there or at the swing low or high so let's go back into the example and show that so here if I was going to look to take an entry there are two things I can do I can either take an entry at the start of the fair value Gap letting it trade up into the breaker or I can look to take my
entry at the breaker within the fair value Gap from here I can look to have my stop loss either on this swing high and if I was going to Target to R I'd need my takeprofit down there or I can look to place it just above the breaker block here and with that my 2 R would be right here so let's see how this works out you can see we hit two R pretty quickly with that and if we go back to our initial take profit using the swing High it would have just missed our
take profit and then stopped us out so you can see there are benefits and draw Downs to each stop-loss placement however that is up to you to decide what works best for you let's take another look at an example of a unicorn model so if you notice here we have a low a high a lower low so if we form a higher high we will have a breaker block and here we do form that higher high now we can Mark out the series of up Clos candles here as the breaker block block and look for
that to be retested to move higher and what do we have right here we have a fair value Gap overlapping it so the one thing we have to decide here is do I want to place my entry on this breaker block here to get filled with my stop below the breaker low or do I want to wait and place it at the fair value Gap here to get better risk to reward now if I want to be in this trade I will take this first entry and allow my stop loss to let it trade back
into this area so if this is my entry I'll look to Target to R with my stop loss just below the breaker low here we get filled in and here we hit TP now if you notice it never reached back into this fair value Gap here so this is where it kind of comes up to user discretion do you want to wait for that fair value Gap entry to get better risk to reward or do you want to be in the trade and allow it to trade back down before going higher now the last thing
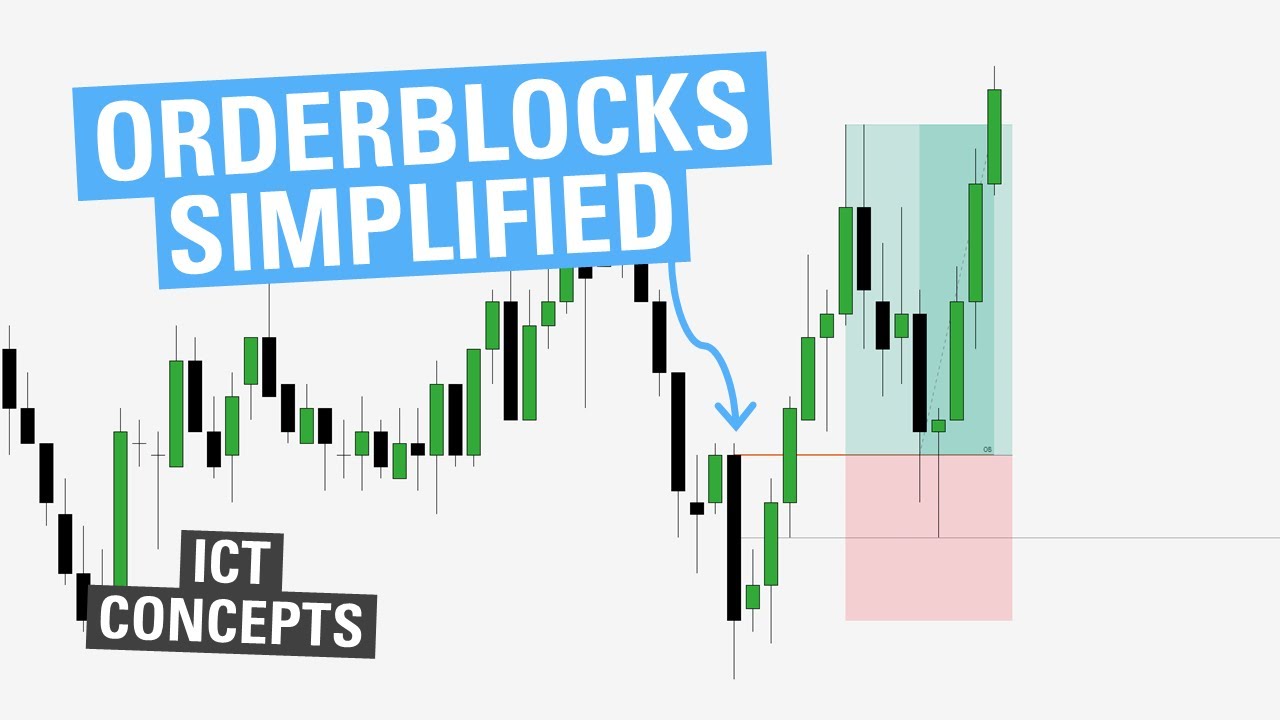
with this example as you can see how this stop loss makes much more sense than looking to place my stop loss at this low here if my my stop loss was at this low I would need to have a take profit all the way up here to reach 2 R versus placing it just below the breaker here I get my 2 R right here now let's take a quick look at the differences between a breaker block and an order block a breaker block is the series of up Clos candles here and an order block is
the series of down Clos candles here with a breaker block I Mark out the whole series of the candles including the Wix while with an order block I will just Mark out the opening price in that series of up Clos candles so in this example here the rectangle would be the breaker block and the blue line would be the order block they are going to refer to price action at a similar level however they are different concepts so for example here my entry for the breaker block would be right here while the entry for the
order block would be right here so you can see both would have worked out in this case the order block did catch the almost very low but they both have their uses it really just comes down to personal preference the next thing I want to quickly discuss is using breaker blocks alongside projection if you've seen my projection video you know we can project the manipulation leg to give us targets so where is the manipulation leg in the breaker well we have a low high lower low higher high this leg down that created the lower low
is our manipulation leg and I can project that out to this high right here this gives me levels to Target for example looking for price to reach to the two to 2.5 so in this case if I was to take an entry on the breaker block with my stop just below the low of the breaker block I could look to Target either 2 R which I would have taken right there or I can look to Target these projections right here giving a 4r trade you can see how we hit those projections there we get a
little retracement and eventually go up and reach for the 4 to -4.5 so now let's hop into a final example where we will go top down so in our first top down example we're going to be looking at that same gu trade on the 5 minute and showing the higher time frame context so taking a look at this price action what do you see what I see here is we have a sweep here at the low and then we have displacement up now taking what we just learned in this video what else do we see
we have a low high lower low and then we create a higher high up here so what are these up close candles right here a breaker block so now we have a breaker block overlapping with a fair value Gap or a unicorn model on the hourly chart and we just entered the London Kill Zone let's hop down to the 5 minute chart so down here on the 5 minute chart now there is a little bit more context to our first example what do we see here well we see a low a high we make a
lower low into an important level let's see if we get this placement out we do get this placement out creating a higher high so now we can Mark out that breaker block now what else do we have we have a fair value Gap here so if I was worried about missing this trade or I really wanted to get in I could look to take my entry at the start of that fair value Gap my stop at this low and then I could either look to Target to R which is right here or these highs or
I can also project out that manipulation leg so projecting that out let's say I'm looking for the -2 standard deviations now we're at a 3.62 r trade so let's see how this works out and there we hit our takeprofit so you saw this example prior but zooming back out to the hourly chart now you can see the context of why I'd be looking for a trade here we have a higher time frame PD array and simply put we're moving from internal liquidity to external liquidity on the hourly time frame in this next example we'll be
taking a look at at a unicorn model on the hourly time frame so you can see here we have previous day low resting right here which we created equal lows so if this is not taken and we retrace back into this previous range that is an opportunity Too Short now what else do we notice we see a swing High being ran right here so we have a high low higher high lower low so what are these down Clos candles those are a breaker block so marking those out what else do we have overlapped with them
a fair value Gap so if I did not even want to go to a lower time frame I could look to take an entry right here I stop on this high and then looking to Target equal lows so let's see how that works out and we would have gotten filled in right there and there we would hit TP in our last top down example we're starting on the es 60-minute chart and if you notice we have a fair value Gap that's been respecting here and we have cells side liquidity or cell stops resting here we
drop down on the hourly chart and we sweep that close back inside so let's drop down to the 5-minute chart to look for a long setup so here on the 5 minute chart what do we notice we have a low high lower low so let's see if we create a higher high and there we create a higher high so where is our breaker block this series of up Clos candles here we also have that aligned with a fair value Gap here so looking to take an entry at the fair value Gap my stop below the
breaker and targeting to R it would look something like this so let's see how this works out so here we get filled and there we get stopped out so you can see in this example we swept cells side liquidity after the open we displaced through the breaker block we created a unicorn model took an entry and then it stopped us out losses are inevitable in trading and that is why I show this example I hope you found this video beneficial if you did please consider liking and subscribing and I'll see you guys next week

![Change In State Of Delivery [CISD] - Orderblock Formation - ICT Concepts](https://img.youtube.com/vi/CHIK5oBRKiw/maxresdefault.jpg)