How to translate the scientific method into statistical language and what are its limitations? My name is Alexandre Patriota, I am a professor of statistics and in this video I will show you how to make this tradition. What is statistics?
Statistics is a formal language for dealing with the uncertainty of contingency events, that is, of events that may or may not occur. It is typically used to estimate the number of known, test hypotheses of interest, make projections for certain indexes. It is the grammar of science, as Karl Pearson said.
As I said in another video, there are four fundamental Steps that form the core of the scientific method, by knowing, establishing the hypotheses of interest, designing the experiment and collecting the data, testing the hypotheses against the data and the repetition of the experiments for independent verification experimental results. The concepts that we will see below that will be covered in future videos. In addition, in the next videos we will deal with more basic subjects such as level of proficiency, types of data, summary measures and some graphs.
In the first stage, the scientific hypothesis translated into statistical hypothesis H0. For example, if the scientific hypothesis is "the drug has no effect" and has no effect it is translated as having no average effect, then the statistical hypothesis can be established as beta equal to zero where Beta is the average effect of the drug. Note that the scientific hypothesis could have been translated in other ways, for example, instead of the medium effect, I could have used other positions in the distribution such as quartiles, decis, among others.
In the second stage, the scientific experiment is translated into the statistical model, that is, the measurable quantities in the experiment are translated into quantities in a statistical model. Thus the scientific experiment translated with the following crack: (Omega, A, P), in which the omega brings all possible results of the experiment A is the family of events in which the probability is to be measured and P is a family of measures and probability that Possibly describe the results of the experiment. The statistical model then represents the scientific experiment and the statistical inference is made on the quantities of the statistical model.
Note that the adopted statistical model is not always adequate. Which can invalidate the inferential results obtained. Data collection , in turn, is translated into sampling technology whose main objective is to obtain a sample free of confirmation and selection bias and which has optimal probabilistic properties .
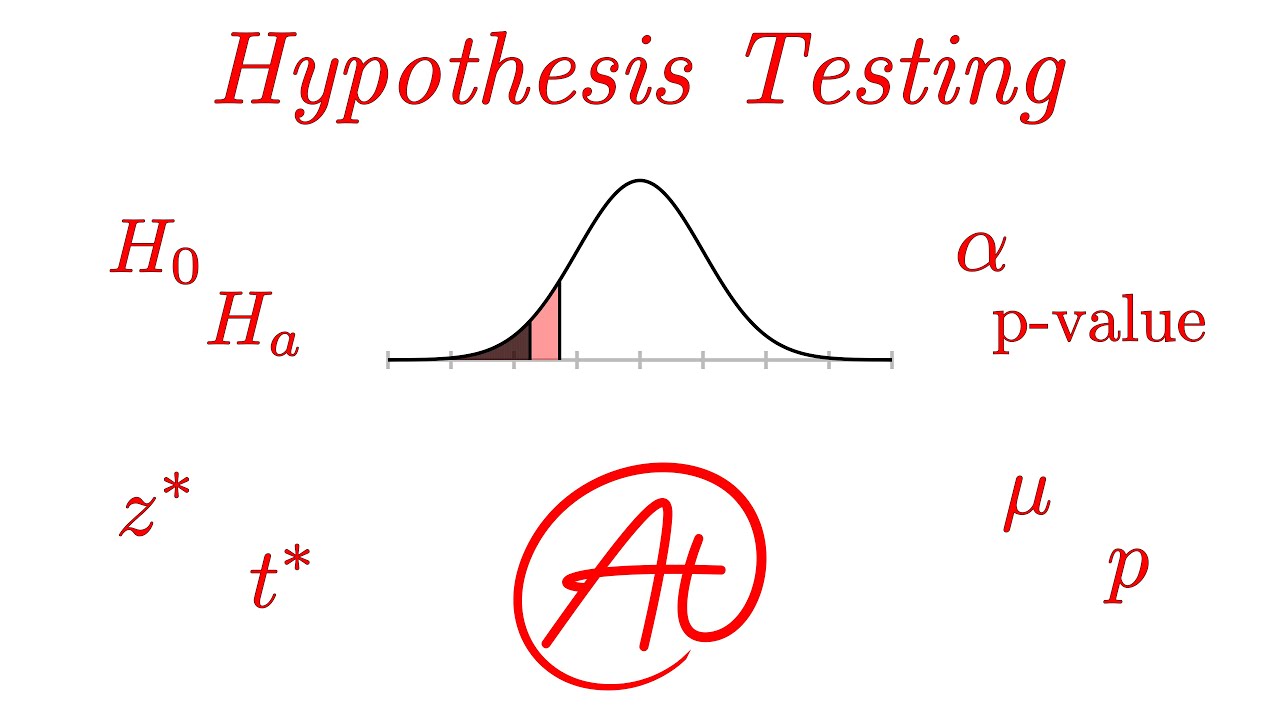
There are several types of sampling, such as simple random sampling, stratification sampling, cluster sampling, quota sampling , among others. In the third stage, the H0 statistical hypothesis is tested as follows. After observing the data of the experiment, a statistic is defined that reflects a disagreement between the hypothesis postulated and the observed data.
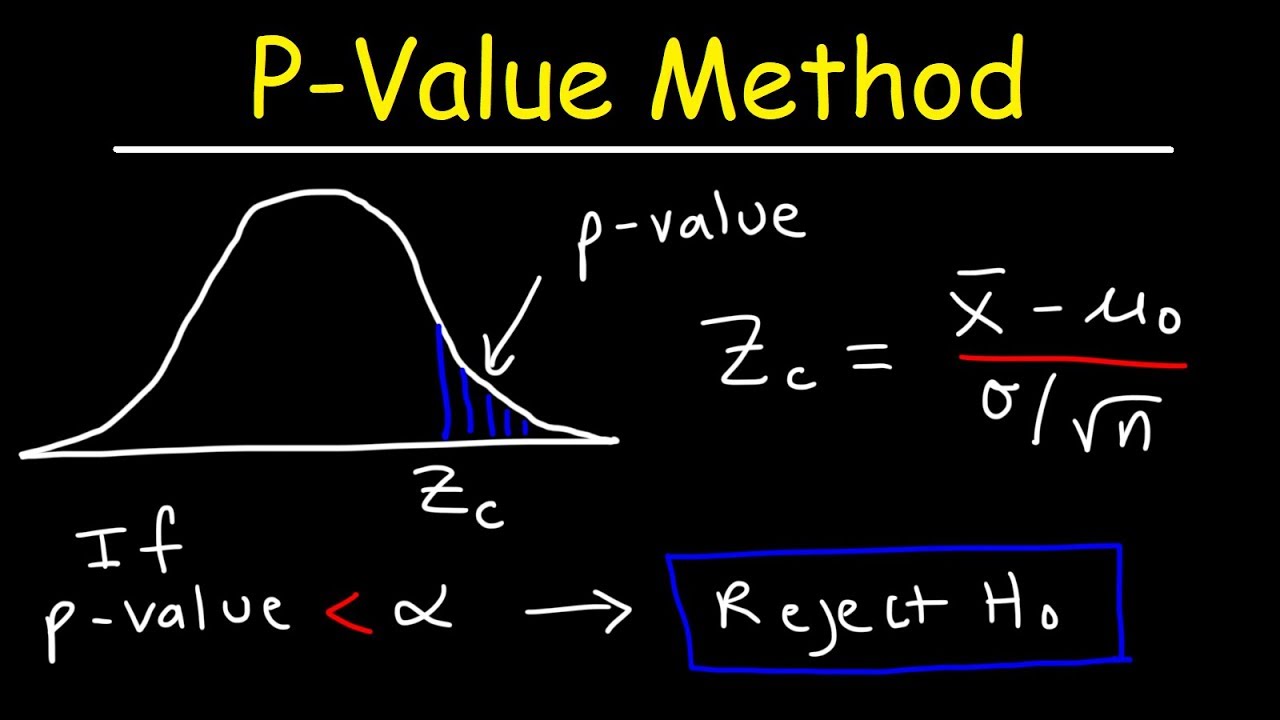
From this statistic, the P-value is calculated, which is the probability of finding in another experiment a statistic at least as extreme as what you observed in that experiment, considering the most favorable case the hypothesis postulated. Note that the p-value is not a conditional probability. According to Fisher, if the P-value is less than Alpha and this alpha is a small value, then either a rare event has occurred or the postulated hypothesis is false.
Let R_H0 be a rare event under H0. For true H0 and considering that a rare event has not occurred, we have that P-value should not be small. Let’s say it’s greater than or equal to Alpha.
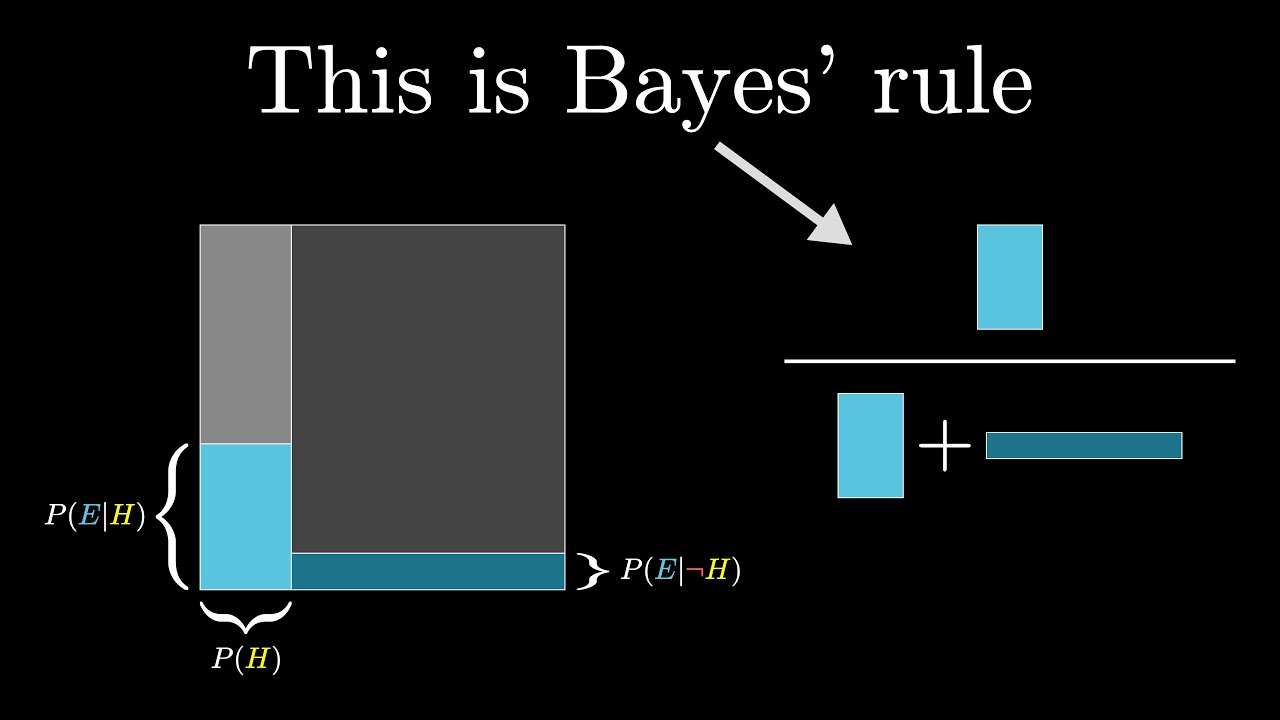
If we observe a P-value less than alpha, then by modus tollen we must conclude that H0 is false or a rare event has occurred. This method does not consider alternative hypotheses, however, there are other procedures that consider alternative hypotheses and which we will see in more detail in future videos. For example , Neyman-Pearson tests , a posteriori probabilities and measures of possibility such as S-value and C-value.
The potential replications of the experiment for independent verification are embedded in the statistical model , the T statistic and the P-value. If H0 is true, it is expected that such rare events will occur with probability at most Alpha, that is, if the H0 hypothesis is indeed true and the experiment repeated a hundred times is expected, under certain conditions regularity, than in only five experiments p-values less than or equal to 5 percent are observed. Note that if the chosen statistic does not have desirable properties, which we will see in the next videos, this hypothesis test can be invalidated as well.
To ensure that the differential results are reliable, it should be checked whether the model is sensitive to small disturbances, whether the sample size is sufficient to make the asymptotic approximations and whether there is redundant information in the model's covariates. Well, that's it folks, in the next videos we will get into more technical matters. I thank everyone for their attention and see you next week.
Do you think it will be okay, or not? Conglomerate sampling . .
. this was the first one to be carried out . .
. and check if it is sensitive . .
. Let's cut it . .
.