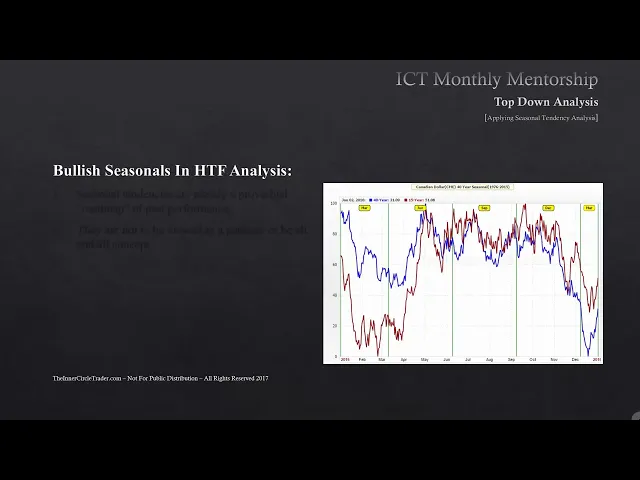
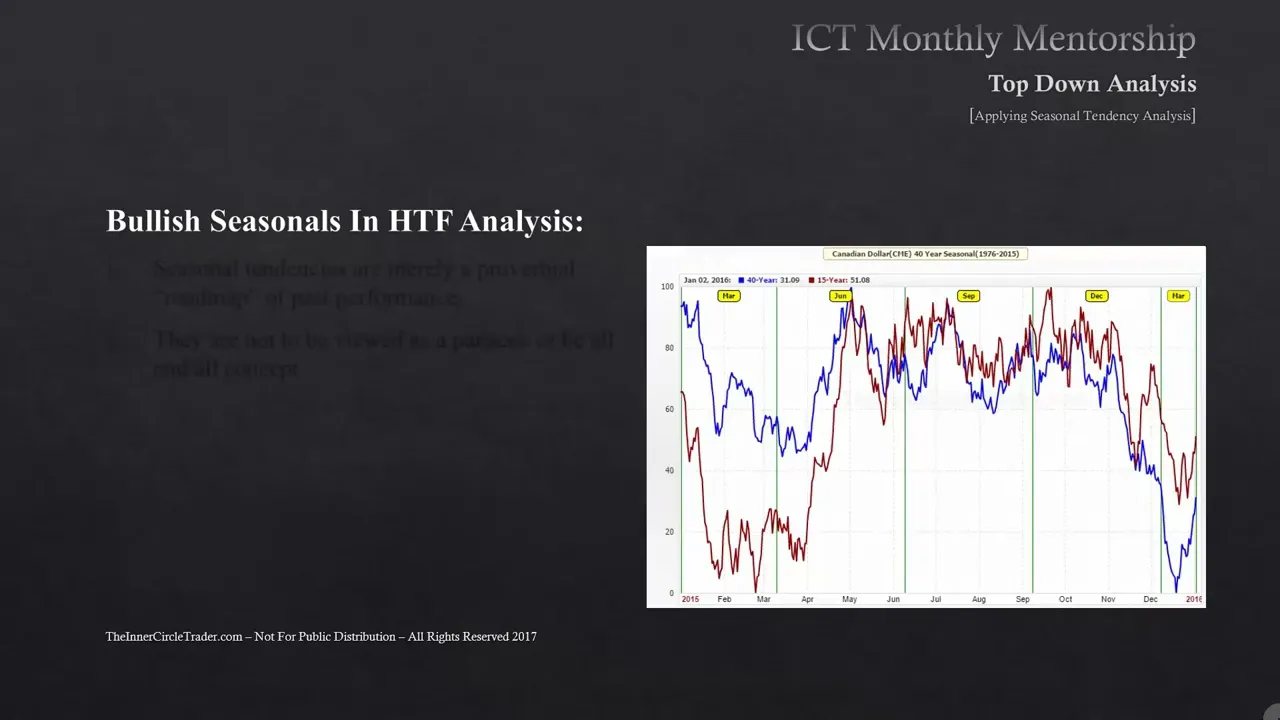
welcome back folks this is lesson 4. 1 implementing macro analysis we're going to be teaching applying seasonal Tendencies to hire time frame analysis this module is going to be teaching bullish seasonals in higher time frame analysis okay you've probably seen this chart before I've made uh available a few of these templates over the years but we're gonna be teaching specifically only on the buy side for seasonal tendencies in this teaching and we'll be using the Canadian dollar to begin with and what this is is it's a 40-year seasonal tendency where the price on polish years and bearish years have been compiled and compressed into a file where the output gives us a tendency for what price usually does for each contract delivery month I'm going to get into that in a minute before we get into it deeper let's bring up some points here seasonal Tendencies are merely a proverbial roadmap of past performance and they are not to be viewed as a Panacea or be all end-all concept despite what you may see in this teaching and the subsequent teaching in 4. 2 please let me remind you that simply because it's done something in the past doesn't that in any way guarantee it's going to do the same thing in the future this is just one more tool to add a Confluence of things that would already lead you to an expectation that the market should go higher or lower okay folks this is the Canadian dollar 40-year seasonal tendency this is the expanded view of the same chart you just saw and I want you to take a look at something real quick up here we have it says March abbreviation June abbreviation September's abbreviation December and then back to March again what this is delineating is the contract delivery months for the Canadian dollar now currencies they deliver on March June September and December every single year these months expire these charts that I'm sharing with you are a compilation of data over all the delivery months price action for the last 40 plus years beginning in 1976 now this data is only compiled up to 2015 but I can tell you that the output is hardly changed at all if you're concerned about it being 2017 is there any there is there any deviation no there's not any deviation at all so how do we look at these things and what benefit does it give us well let me ask you a question if you were to if you were to ask the average Trader that just now getting into trading maybe it's not Forex maybe it's stocks or or Commodities and you ask them hey look if I were to ask you today is the markets manipulated to a degree where well before Price ever starts to trade a specific time of year would it be inclined to go higher or lower based on some underlying influence that repeats itself and as a new Trader I could tell you I would have never answered that question with yeah I could probably agree to that um I it felt like a random thing to me and one of the things that I like about seasonal Tendencies is it gave a characteristic to price that proved to me that there is a rhyming reason behind everything that goes on if there's something that's measured and again this is 40 years worth of data okay 40 years worth of data in the blue line the red line is a 15-year average so you can see between looking at 40 years worth of data and 15 years worth of data there's very little discrepancy in terms of what the overall strong seasonal Tendencies are for this particular currency now since we're primarily dealing with bullish seasonal tendencies in higher time frame analysis for this module we're going to not focus on bearish patterns but we're going to be looking for tendencies that lend well to being a buyer and if we're going to be doing higher time frame analysis and we want to be buying on these higher time frame charts and using it for ideas for being position Trader looking at this seasonal tendency I'm going to ask you what time of year now time of year is going to be delineate at the bottom of the chart down here you can see it's all dated here's December November October this is all calendar month based this is contract delivery months okay you can see the vertical lines delineating when that contract March would end trading here that would be the beginning of June's trading contract and then June would end here and it would pick up at September's contract and so on going through the season sanity chart if I were to ask you what would be your first choice in deciding when would be a good time to buy well if you were paying attention you can see that this is probably a really good time to be buying around mid-march all the way up into the May June time period so between March and June there typically is a strong tendency for the Canadian dollar to Rally now some of you may think to yourself well that's great you know if this is the contract month for Canadian dollar what does that mean to me if I'm not really a Futures Trader well the main thing is is this is the seasonal tendency that you would expect Canadian dollar Futures to Rally now it does not mean that it's going to Rally every single year march to June doesn't mean that it just means that there's a strong probability that historically looking back over 40 years worth of data and comparing it against 15 years worth of data there is a strong underlying well there I say it element of Truth to the fact that there is a tendency for this to Rally problem is if you're not a Futures Contract Trader this doesn't do anything for you or does it if we are trading foreign exchange we have to remember that the Canadian dollar is paired with the dollar Index now the dollar Index is the first in in the pair's name so that means if we're bearish one Canadian dollar the U.
S CAD is going to go up if we're bullish on Canadian dollar that means the U. S CAD pair is going to go down that means Canadian Dollars are bullish while that would suppress the U. S dollar Index so since the pair's name begins with U.
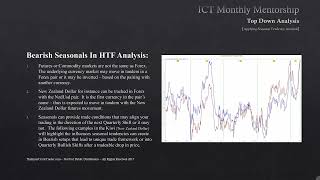
S dollar opposite would be seen in what we expect to see in the Futures Contract so what we have to do is focus in on a seasonal tendency on the Futures Contract that shows us a bearish tone in the marketplace so you can see we're here between September and around Christmas time in December there typically is a strong tendency for the Canadian dollar to decline on in the underlying Futures Contract so we have to take this into account when we're looking at foreign exchange because the U. S CAD pair is an inversion of what the Futures Contract shows for Canadian dollar Futures price so if there's a strong tenancy for September October November and December to have a decline in the Canadian dollar that should be a bullish scenario for U. S CAD let's take this over to the charts and see if this in fact has any validity to it okay we're focusing on the bullish seasonal Tendencies we have our U.
S CAD chart this is a weekly chart and I went back to 2008 just to give you a nice sample size of data and I started the line at the beginning of September and I carried it out in time to about midpoint of December you can see that shaded area all the way to the left here this is when we'd expect to see the Canadian dollar to be bearish on the Futures underlying contract price but because we're foreign exchange Traders we have to be looking at it to be reversed or inverted so that means it would be bullish for the U. S CAD pair because this is how we're trading the major U. S against the cad so this is the buying opportunity that would be presented and look at the look at the performance here on us CAD as a relationship to the seasonal tendency look how strong that buy was look how many Pips it moved notice also in here this is the next time period very next year in 2009 this is a time when the season 10 should should take place and that means the Canadian dollar should be bearish on the underlying Futures Contract but that would be an inversion on U.
S CAD pairs that means we would expect bullishness in here now while we didn't press up to make new higher highs there was a nice little pop nice little rally in here but overall the direction was down so you can see how the season tendency really wasn't much help in terms of seeing much like this higher prices very next year same thing very weak it was lower now I'm going to ask you a question look at these last two years what was the underlying price Direction on the weekly chart was it bullish or bearish bearish has been going lower so would you be focusing on buying that time of year versus looking for opportunity to be a seller there's a hint for the next tutorial 4. 2 going to 2011 we can see that the seasonal tendency had a really nice effect here after we made a nice low and Market structures shifted to the bullish side and station overflow is now bullish and during a time of year when the underlying Futures Contract for Canadian prices should be going lower that's bullish for U. S CAD so for a foreign exchange Trader we're looking for buys we had to look for weakness in the online Futures Contract of the Canadian dollar that would Propel price higher at a time of the year when we would expect prices to come in same thing here the very next year 2012 we can see price again rallied up during this time of the year and now we're still bullish now look at the effects of the seasonal tenancy again we have a low and it starts rallying up again again same time of year September to almost Christmas seasonal tendency rallies again same time period here rallies again and again 2016 just passed we have a nice rally up here as well seasonal tendency come again once again strong now looking at this again let me remind you what we're looking at is underlying weakness in the Futures Contract so if it's underlying weakness in the Futures Contract for a Canadian dollar the inversion puts it to a bullish stance for U.
S CAD so it's very important that's why I taught this one specifically because I'm showing you how we have to take the seasonal tendency from the Futures Contract for some of the majors that are appeared with a dollar their currencies start with U. S CAD so it's going to be an inversion so what you would expect to see in the Futures Contract has to be reversed in some of the currencies that are paired out with the dollar so now by itself it doesn't mean anything but a coupled with other things like quarterly shifts remember that every three or four months there's going to be a move on a hard time frame now we're adding another dimension to that it's one thing they expect to move every three to four months but where is that move going what what should we be focusing on should we be buying or should we be selling seasonal Tendencies give us a road map to help build the idea that okay there's certain quarters of the year that we want to be a buyer and there's certain quarters of the year that we want to be a seller and we anticipate this year in and year out the only difference is is we're going to be looking for markets that already predisposed to go higher and then coupling that with the bullishness of seasonal tendencies if we're looking at the Canadian dollar we'd have to reverse it look for weakness in the seasonal Tendencies on the underlying creatures contract and then apply it to the U. S cat as bullishness because it's an inversion of Futures Contract prices for Canadian dollar if we see times when the Canadian dollar is bullish underlying U.
S CAD payer and this seasonal tenancy September to almost Christmas every single year there's a strong tendency for it to be bullish between that time period that means there's many weeks where you can be a bullish U. S CAD Trader if the underlying pair of us cat is bullish this is going back several years and I only gave you this sample size because if I'll give you any more data it'll ruin all the discoveries if you go back and study for yourself but you can see here clearly many instances when the underlying Market moves are in line with the macro trend seasonal Tendencies are absolutely a barn burner for delivering what you should be doing for each quarter of the year in this case you have a loaded deal if you're looking for a buying opportunity for us CAD it's between September and getting close to Christmas every single year when the Market's predisposed to go higher what quarterly shift are you gonna be looking for now looking for longs okay so now we're going to look at a market that's closely related to Canadian dollar its number one export is crude oil and here we have another example just as a supporting idea if he looked at this Market over here you would expect to see bullish prices for a rally in the crude oil market and that rally comes in around coming in about mid February going into March and carrying into May June time period so we're expecting bullishness in the crude oil market and since Canadian dollar generally moves almost in tandem with a little the strong tendency for the Canadian dollar the rally and the crude oil Market to rally at this time of year that means we have a march to June basically a bullish effect for Canadian dollar and crude oil coupled together so that's a strong tendency but again because we're looking at Canadian dollar in the Foreign Exchange Market this would have to be reversed so we'll save that study for you in addition to what's already been presented here but I want to show you the Futures Contract price for crude oil between around March to June time period okay here's the crude oil markets the weekly chart and I just went back to January uh 14 2014. and obviously you can see here's this is a bearish market here it's been in a long-term downtrend when the collapse of the oil Market from around the 105 level but let's take a look at the bullishness of that seasonal tendency again looking for that march to June time period okay so here's March all the way through to June you can see the rally in the crude oil Market rate when it made its high and the 2014 time period and the next year we'd be looking for the same seasonal tendency between March and June all the way up into the first of July we can see it again here rallies once more even in a bear Market it's still there we don't force the trades but I'm just showing you the seasonal tendency that's existing in the marketplace that should convince you that there is an absolute program to everything that goes on despite fly-in domain factors there are very routine things that take place and they repeat themselves over and over again and again in 2016 we have March 2 the 1st of July encompassing the whole month of June you can see that rally again comes in for crude oil now my question to you is this if you can see these opportunities repeating themselves based on the data that I'm sharing with these reports and seasonal tendency charts is it hard not to feel like they're treasure maps because that's exactly what it felt like for me as a young man when I was in my 20s and I saw these seasonal tendency charts and I admittedly pushed them aside for a first couple months and then finally I got into the study of seasonal Tendencies and I realized that quickly right away that there is something to them now admittedly I've lost money traded them in the beginning I had no idea what I was doing I just thought every time it would work so therefore I loaded up the boat and traded way too many things and too many times got burned doing it so put on the back burner until I realize there's this quarterly shift that takes place in the marketplace and I'm matured now and I can look back and I can pick out where the highest probability seasonal Tendencies are for certain times of the year certain markets have really strong seasonal Tendencies to move a specific three to four month cycle every single year when it's bullish and when it's bearish if we can focus in on those Quarters on those particular currency pairs or those asset classes we have a loaded deal in the form of odds it doesn't mean it's going to be profitable every time it doesn't mean it's a guaranteed it's going to be accurate it just means that we have a high odds probability that our prognostication will lead us to a successful outcome this is just one example of how correlated pairs between Canadian dollar and cruel both can lean well with one another in terms of seasonal Tendencies and even in the bearish market the crude oil Market's been in you can see that the nice big rallies that's occurred happened to script with a seasonal tendency we're going to teach more about this in module 4.