hi we are group one and today we are going to present the design and simulation of a centrifugal pump centrifugal pumps are a type of hydraulic pumps that transform mechanical energy into kinetic energy of pressure to a fluid these pumps are widely used in diverse Industries and they are commonly used for pumping liquids in general and allow large quantities of water to be moved taking this into account the demand for more efficient and reliable pumps has increased and computational fluid dynamics has become an invaluable tool for pump design and optimization cfd enable accurate predictions of
B performance cavitational behavior and flow characteristics providing engineerings with deep insights into the underlying flow physics also the turbo Machinery cfd methods transform from a purly academic Pursuit into an essential Industrial Tool in terms of the state of art we have the cfd simulation in centrifugal pumps some authors reviewed that the cfd application in this pumps show Effectiveness in predicting flow patterns pressure distribution and efficiency and others have used the cfd to optimize imp geography and improving the pump efficiency in terms of the viscous flow pumping other outdors use cfd to study the impact of
viscosity on a multi-age electric submersive po pumps and Valdes compare pump performance with Newtonian and non- neoni fluids finding that sheer thinning fluids can enhance pump efficiency compared to newon fluids of similar viscosity for the gravitational modeling some authors use a mixture model with a cavitational sub model to predict cavitation patterns in Center W pumps validating their results experimentally others employed cfd to study how blade leading edges geometry affect gravitational performance and propose optimizing designs to delay citation on set finally for the turbulence modeling and some authors compare different turbulence models for cogal PP simulation
and they conclude that the SST model provide the best overall performance in prediced PP characteristics thees and calculations were made using the application Excel where in table one it can be SE the different parameters that were later used when creating the geometry of the pump it's important to highlight that taking into account the pump's specific speed the inator has an actual geometry which places certain directions over the geometry in order to calculate the velocity triangle it was defined and assumed that the inlet blade angle had a value of 15° also it should be noted that
the outlet diameter was a manufacturers restriction the geometric design or cat model was made using the application Autodesk Inventor 2024 a itting seen in figure one it shows the dimensions of the pump which was divided in the impeller the Volute and the Assembly of the two the geometric design was imported to to application star CMM version 19 in order to create the mesh and realize the different simulations in order to guarantee the accuracy of the results a mesh inde dependence test was made where the normal mesh was with a base size of 1 cmet was
buried 30% in order to evaluate the mesh thinness or corness relationship with the accuracy of the results as well as the computational time according to figure two it was determined that the normal mesh was the best since it offered a good balance between the accuracy of the results in comparison with the manufacturer's data and the computational time in addition the normal mesh guaranteed as well a W plus less than five which allows the mesh to resolve the biscus top layer directly creating a more precise precise flow Behavior prediction therefore the normal mesh was used in
order to start simulating the pumps operation the mesh models used are seen in this screen and in table three it shows the different parameters used to create the mesh in figure three the mesh can be seen in different critical parts of the pump such as the blade the impeller the cut water and the different nozzles in order to start this simulation process it was essential to find the Ral numbers for both water and mineral oil to identify the regs of both fluids and therefore choose the appropriate models to simulate the operation of the pump according
to table four it can be seen that both the water and mineral oil have high rain no numbers and since they are both greater that to multiply by 10 to the 5ifth power the fluids can be considered as Turin even though there are different models for turbin flow such as the SST K Omega Model mentioned before the kson model was chosen Tak into account its robustness and computational efficiency especially for high Ral numbers flows the K Epsilon model is particularly particularly effective for flows with a strong curvature and rotation such as ring flows which are
seen within the edor of a centrifugal pump some assumptions for the simulations were that the turbulent viscosity is the same in all directions that is a singlephase isothermal and incompressible flow and that the system is within a steady state regarding the initial conditions defined for the simulations the initial velocity and pressure were determined in order to ensure that the simulation captures the development of flow from a rest state in the case of the boundary conditions it was divided in three different zones the inlet the outlet and the rotation parts for the inlet it was defined
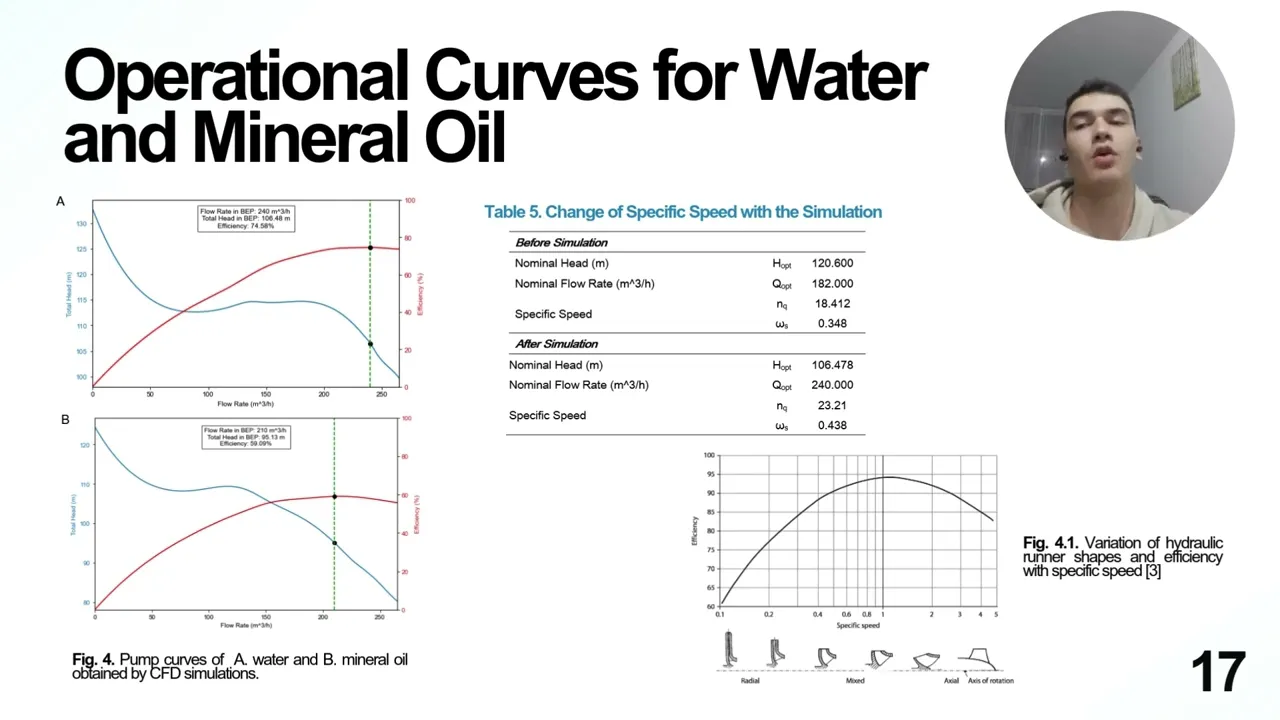
as a mass flow Inlet the outlet was defined as a condition of pressure and the rotating part the impeller was defined as a moving reference frame in the C axis these conditions are essential for ensuring that the simulation results are reliable and applicable to real war scenars providing insights into the system performance and behavior under specified conditions in figure four the pump cores for both water and mineral oil are present a comparison between the cfd results on the manufacturers data reveals a noticable difference in the behavior although the pump was originally designed as a Ral
pump after running the simulation are we calculating the specific speed using the new data from the best efficiency point the specific speed increased from 1841 to 2321 this shift suggests that the pump's characteristic are more consistent with those of a mixed flow pump which exhibit similar behavior in the total head versus flow analysis figure five shows the efficiency corpse for water both cfd and manufacturers data and oil it is evident that the best efficiency point be occurs at a lower flow rate for oil compared to water consistent with the find this report by bz this
difference is primarily attribute to the increased frictionally losses caused by the the higher viscosity of oil the higher viscosity creates greater resistance to flow Shifting The V to lower flow rates further more this increased frictionally loses lead to a reduction in overall efficiency a typical outcome when pumping more viscous fluids in order to compare the results obtained from cfd with experimental data provided by the manufacture figure six was constructed in this figure the alternative lines represent the square error for each parameter the errors were relatively high with values of 21% for total head and 22%
for efficiency the primary reasons for the dis prances are linked to the fact that the pump design has deviated from the original manufactur designed due to changes in its best operating Point as mentioned before additionally another contributing factor is the limitations of cfd which as previously mentioned relies on assumptions such as a steady flow and neget me mechanical loses related to the motor including frictions and heat dissipation now it is worth carrying out a comparative analysis between the velocity profiles for the two fluids that we were working with firstly it can be seen that when
the flow rate is zero all the energy that the pump supplies to the fluid is manifested as pressure in the stagnant fluids that means that even though there's no fluid movement the pump continues to transfer energy to the fluid particles trapped in the impellor which generates a maximum head value within both systems if we continue to go through the different flow rates it becomes interesting to note that although the length of the discharge was extended in order to avoid volumetric loses at low flow rates backflow phenomena can naturally occur as in the case of the
flow of 90 cubic met per hour and eventually when reaching the best efficiency points one can see that the magnitude of the velocity increases and this suggests in real world applications that the possibility of facing for example higher friction loses and even higher risk of cavitation in high speeded zones on the other hand this pressure profile suggest that more pressure is required to move mineral oil than water throughout the pump in order to keep the desired flow rate this is physically consistent since oil is more viscous than water and therefore it offers a greater opposition
to the movement now let's take a look at the capitation for this analysis Vapor pressures at 20° C were collected from literature now and they are presented on the slide since water is more volatile it is expected to face more citation problems with that fluid one can also see that for both fluids the greater the flow rate the more gravitation zones there are and this follows Bern's principle when velocity increases pressure decreases getting sometimes dangerously under the vapor pressure limit let's compare now side by side W plus performance at the best efficiency point for each
fluid on the left hand side one can notice that there are barely orange or red values and the average wallway Plus for the water is equal to 1.45 11 and on the right hand side wallway plus appears to be very low with a naked eye it seems that there are only blue zones and indeed the average value for the oil here is low it is 0.071 turbulence models often require low white Plus values in this case y plus smaller than one is preferred in order to correctly capture velocity gradients and near wall turbulent phenomena without
relying on simplified approximations such as wall functions and despite the fact that water wallway plus was not less than one it was less than five and continues to be as small value besides this outcome ended up as expected since y+ depends on cinematic viscosity as it can be seen in the equation on the slides oil is more viscous than water then white plus must have been smaller for oil compared to water in conclusion it was possible to design and simulate a centrifugal pump with water and mineral oil correctly using a normal mesh taking into account
the results obtained it is evident that the design pump has the characteristics of a mixed flow pump and the B changes there was a decreasing pump efficiency with mineral oil due to its higher viscosity also compared to the manufacturers data relative High errors were obtained due to the change in the B and the limitations of the cfd in addition and increasing the velocity magnitudes was observed when increasing the flow rates and and increasing the total pressure of the pum was observed with the mineral oil once again due to its higher viscosity considering that water is
more volatile greater cavitation was observed in the pump with water and finally low wall wide plus values were obtained for both the water and oil pumps thus achieving fine resolution capturing viscous effects and precise detail on the floor near the wall