In this video, I'm going to give you a 4-hour chart pattern that nobody talks about. And if you used it with a 15-minute chart, you have an absolute money maker in your hands. It is by far, hands down, the easiest setup in all of trading.
And if you don't believe me, go look at all these traders on screen now who are already profitable using this exact same strategy. They were just like you watching YouTube videos and they're already profitable. So, if they can do it, you can do it, too.
Okay. So, for this strategy, what we want to do is we want to mark out a 4hour fair value gap, right? So, you want to get on the 4hour chart for whatever market you trade because this will work on every single market uh imaginable, right?
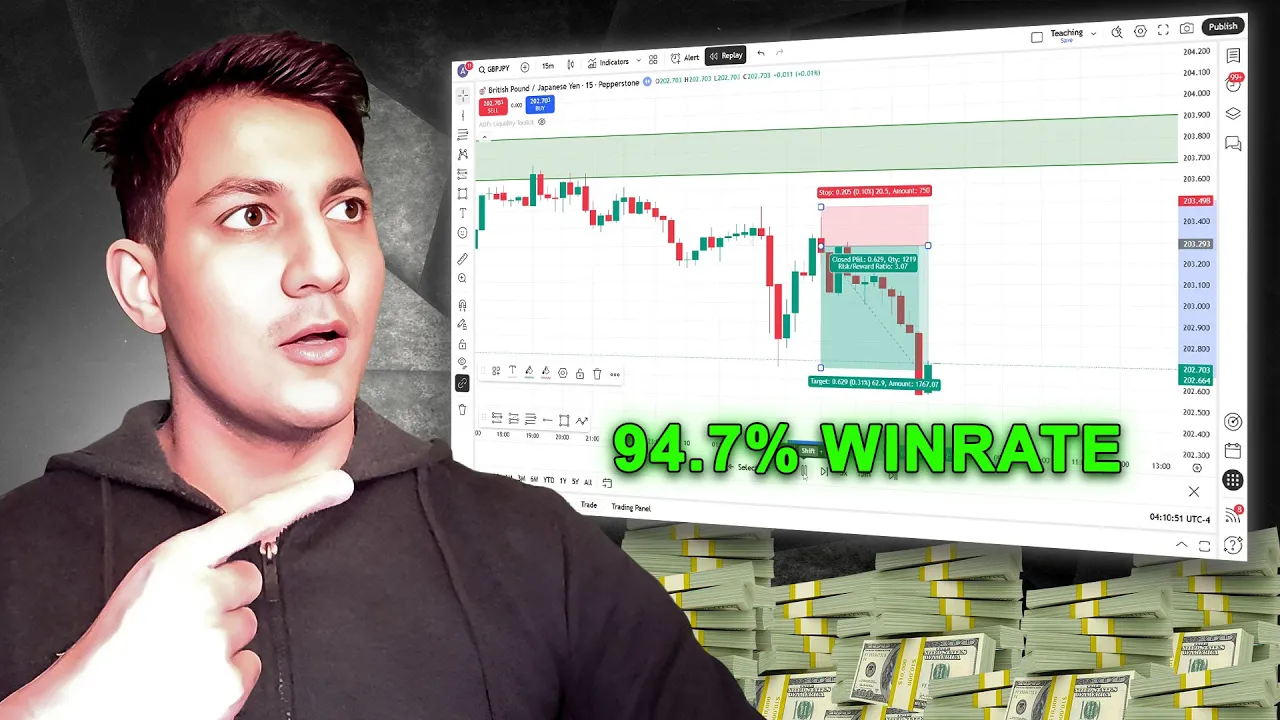
So, imagine this is your favorite market, gold, S&P, whatever you like to trade. You're going to go onto your market. In this case, we're on GBP JPY.
Get the 4hour total and you're going to mark out the most recent fair value gap in price action. And if you don't know what a fair value gap is, go look at this picture on screen. Now, it's a very simple pattern, right, that forms in price action.
Um, I don't like the term pattern because you think of like dogee and all these weird stuff, but there's a lot of logic uh behind this actual entry pattern. So what you're going to do is you're going to go to the 4hour chart and you're going to mark out the most recent fair value gap which is this the gap between this candle here and this candle here. Right?
So it's this big green box is our fair value gap. Right? This is a 4hour let me move this up a tiny bit.
This is our 4hour fair value gap. Right? Now what we want to do and the reason why this pattern is so good is what we want to see is can you see this wick here?
Right? Can you see how price wicks in to this 4hour fair value gap? Right?
The moment price touches this 4hour fair value gap, we want to get onto the 15-minute chart and we want to start looking for confirmation, right? We want to start looking for an entry. Um, that actually shows that we're on the right side of the market.
So, what I actually mean by that is this is our 4hour fair value gap. Now, let's imagine this is the 15-minute chart. What we want to see is we want to see price come up, hit this 4hour fair value gap this time on the 15-minute chart.
Then we want to see price shoot off and then give us a little retracement and ideally give us a new fair value gap that we can enter on and ride price down. Right? So what we really want to see is let's imagine this bit of price action.
This blue line is now the 15-minute chart. We want to see price on the 15-minute chart hit this 4hour fair value gap shoot off give us a new fair value gap on the 15-minute chart. Something like this that we can enter on like this.
Put our stop at this high here and then target whatever you like. Right? 3:1 like I like or liquidity or whatever you like.
This is what we want to see on the 15-minute chart because what's really happening here is we have a our 4hour fair value gap which is bearish and in this case on the 15-minute chart price shoots up. It hits the fair value gap. It shoots off.
That is our confirmation that this fair value gap is going to hold, right? We don't just randomly start selling at a fair value gap. We need to see confirmation that we're on the right side of the market.
So price hits the 4hour fair value gap. It shoots off. It gives us a new fair value gap on the 15-minute chart.
We enter on that. We put our stop at the high. We target 3 to1.
We target liquidity. Happy day. So, let me show you what this actually looks like on the 15-minute chart.
So, what I'm going to do is I'm going to mark out the 4hour fair value gap again. And like I said, as soon as price hits the 4hour fair value gap, you're going to get onto the 15-inut chart and you're going to start looking for your entries, right? You're going to start looking for that pattern that I said.
So, here we are on the 15-inut chart. Now, it doesn't look as sexy as what I showed you before, but this is real price action, right? This is how the markets actually are.
Not every setup is just going to go, you know, give you a nice easy high probability retracement and go straight to take profit, right? If you've been trading for any length of time, you know, that's not how the markets are. So, here we are in this bit of price action and you're going to think, "Oh, this looks disgusting.
" So, there's one key thing that we need to pay attention to. So, what you want to see is want to see price hit this fair value gap, shoot off, give us a new fair value gap that we can enter on, and then ride price down. Now, you might wonder, "Oh, okay.
Um, I can maybe see a fair value gap here, but why is it so choppy for, right? Why is it like price hits the fair value gap here and it's very choppy and then it starts to move like this, right? Have a think, by the way.
Have a think. I know some of you are some of you are quite smart here. Have a think.
Why do you think price chops for a bit and then drops, gives you a retracement, and then goes off, right? I'll give you a clue. Look at the bottom of the charts.
Right? The reality is if you're a day trader or scalper, you need to be trading at key time of day. Right?
I cannot stress this enough. You don't just buy randomly. So, if you look at the bottom of the charts, right, and this is New York time.
Let me get this up for you. New York time. Doesn't matter where you live.
I live in the UK. This is New York time. And everyone uses New York time.
So, make sure you have was it UTC minus 4. Make sure you have that on your Trading View charts. And can you see the bottom of the charts?
Look at the bottom here, right? The black line. You see how it's 8:00 p.
m. Eastern? That right there is the beginning of Asia session, right?
This is why price is chopping because it hits it at not a key time of day, right? So, it's not a key time of day. Price will chop around until 8:00 p.
m. And then this is when the real move will happen. So, let me show you this.
Actually, I don't normally do this. So, this right here, 8:00 p. m.
Eastern. This is the beginning of Asia session. You're only going to look for your entries after this point.
And then, where's 12:00 a. m. ?
I mean, it's almost beautiful, isn't it? Right? I mean, how crazy is this, right?
I didn't even I didn't even think about this. So, this right here, this light blue line, this is the beginning of Asia session. Asia starts at this point right here.
What happens? I mean, just look at the these two horizontal lines. What happens?
Price instantly drops, gives you a nice high probability retracement on a fair value gap. I'll talk more about that. And then drops down massively, easy take profit, takes out liquidity, and then it starts to retrace upwards, right?
And and then why is it retracing upwards? Just set us up for London new retracement and right price time. Absolutely beautiful bit of price action.
And you can see the real move's done literally 12:00 a. m. Eastern.
So key point, key takeaway here is you need to be trading at key time of day, right? And you can see there's no fair value gap that form. Let me just remove these blue lines.
They're kind of a bit annoying, right? But this is why price chops for a bit and then only moves at 8:00 p. m.
Eastern when there's a real session, right? So really, really important that you know that you don't just randomly enter at any time of day. You need to be trading at one of the major sessions.
So London, New York, or Asia, right? Um, so how do we make money from this, right? How's our entry?
You know how I said the moment price hits this fair value gap, we want to wait for a new fair value gap to form, which shows us that we're on the right side of the market. And if you remember, let me just zoom out. This is a bearish fair value gap on the 4hour chart.
So we want to see a new bearish fair value gap, which is this one here. And then ride price down. So let me show you what this looks like.
So this is our new fair value gap. And you'll notice, look at the bottom of the chart. This is that key time of day.
This is Asia session. The moment this fair value gap forms, this is your entry. like this.
Now, for your stop, you're going to put it at this high here because this is the candlestick that formed the fair value gap, right? You know, I maybe I'll put the picture on screen now of a fair value gap. You know how there's three candlesticks that form it?
Your stop should always be at the high when you're bearish and always at the low when you're bullish at least, right? At least you don't, you know, don't need to do this, right? Do not do this cuz you're going to get stopped out uh with spread.
So, do that. Nice, easy, safe stop loss. And then for your take profit, you're going to target, for me personally, you're going to target at least a 3 to one, right?
At least a 3:1. You can target this little bit of liquidity, new day, open, get, whatever you want to call it. And then always whenever you're in doubt and you don't know where liquidity is, zoom out and look.
But of course, you know, don't be stupid, right? Don't be you're not going to target this, are you? Right?
Unless you want to be a swing trader, but even then, like, you shouldn't be doing that. Um, so you're going to target 3 to one. And I'm going to show you a second entry actually, which I don't normally do.
So target your 3 to one like this. Let price do its thing and then there takes profit. Right?
Hit take profit. Now this is the really interesting part. So let's um let's clear this off.
So this is your first entry. Whenever you see so this is really important. So this is our first entry.
Price hits the 4hour fair value gap. It drops down at key time of day which is Asia. Easy high probability retracement.
Stop at the high ride price down to take profit. Right? Easy easy setup.
However, let's imagine let's imagine you missed this setup, right? Oh, T, you know, I saw it. It hit the 4hour fair value gap.
It gave you a retracement, but you trade London session like I do. How can we make money from this? So, this is really important.
So, sum up for your notes is whenever you have a second entry. So, this is the first entry. Whenever you have a second entry, which really, let me just do this.
This move here and the retracement, this is your second entry. This is lower probability. It's always lower probability than the first.
However, you can make money doing this, right? So, let me show you what this looks like. So here's your first entry in Asia.
If you trade London session, you've seen it and you think, "Oh, sakes, man. I've hit I've seen the 4-hour fair value gap. Perfect entry.
I missed it. It's how do I make money from this? " So, what I like is, can you see how number one, and for those who don't know, new uh London session, sorry, is 2 a.
m. Eastern. Look at the bottom of the chart, right?
2 a. m. Eastern.
And it's almost beautiful, isn't it? 2 a. m.
Eastern. And then what happens, right? Instantly price drops down.
And you have a little fake move, right? A little fake Judah move. And then price instantly and aggressively drops down.
That's telling you, smart money screaming at you where the real side uh real direction the market is and sorry. And again, you've already got confirmation here, too. Now, are you going to enter on this big fair value gap here?
Not really, cuz your stop's going to be massive. You know how I said it should always be at the high. So, what I would do personally is I would just enter at this order block here, right?
Order block last up close candle before the down move. Maybe I'll put a picture on screen now. I don't know.
I've not really talked much about order blocks mainly because I don't really like them. I prefer their value gaps. However, right, this could be your easy second entry, right?
So, what you're going to do, enter on the order block, stop. Just put the stop at the logical high, right? You don't have to do anything crazy.
Put at the high and then for your take profit, you're going to target at least 3 to one, which is basically, I mean, beautiful, right? Basically, the old low, right? That's what you're going to do.
Set up your limit orders at 15-minute chart. Easy, easy, easy. You're never going to miss a setup on the 15-minute chart.
Let price tag you in and let it go. take profit, right? Easy peasy lemon squeezy.
So, if you ever miss your first setup in Asia and you want to trade the next session, and again, this could easily be New York session or London session here and a New York session. This is what you do. This is how you make money.
So, you can get the full completely free PDF in the pin comment down below.