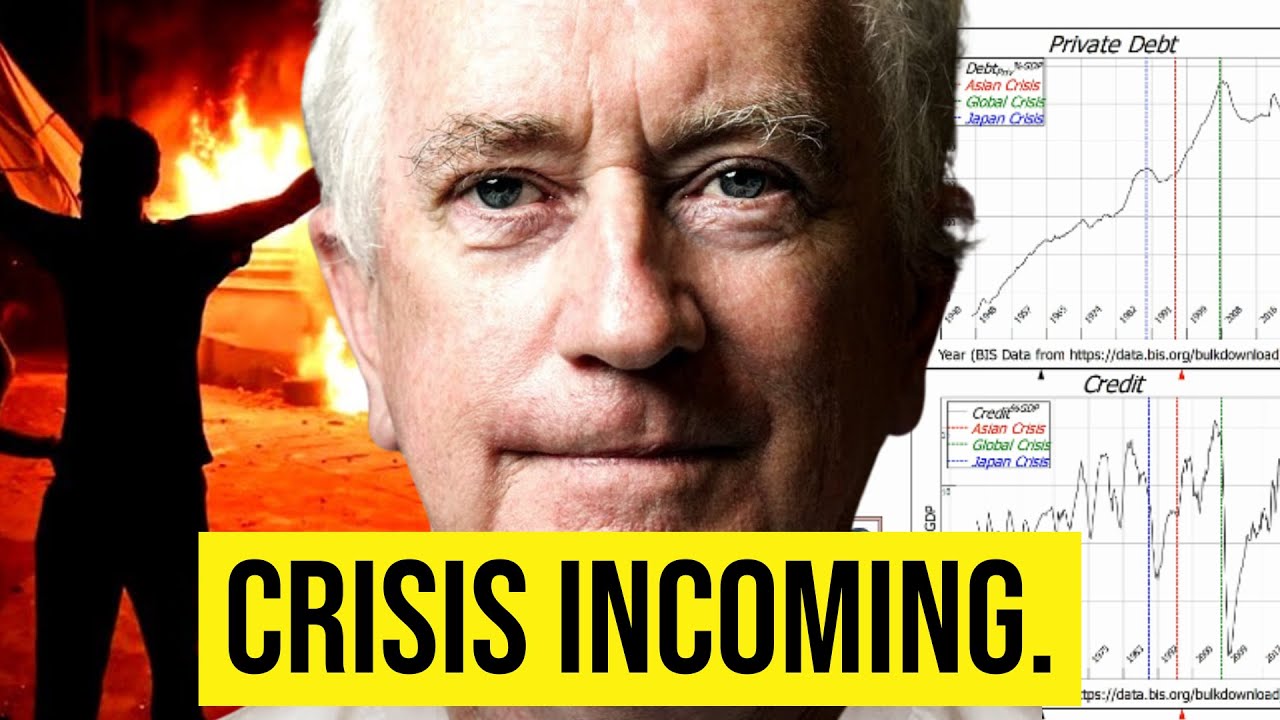
that caused the global financial crisis and there's The Plunge in credit from 15% of JDP equivalent down to minus 5% in order to have a good party in Thailand it took me 7 Minutes the influential contrarian Economist Steve Keane brilliant Economist that criticizes much of modern economics he is someone that each and every one of us has to listen to whether we agree or disagree here Steve Keen I've got a challenge for all the Excel and Julia and pivot and Tableau experts out there I want to see how fast you can do something I'm about
to do in my new software called Ravel what I want to show is what caused the global financial crisis which of course most economists didn't see coming now the bank maintains a whole lot of databases one of them shows debt levels around the world I'm now going to try to import that into Ravel and so I'm going to set up the clock here and then go to the file Import in Ravel zoom in a bit there and when the form comes up choose the file which is the abbreviated file that I've got there which is
this one let's load that load it in and then I've got country B sector by unit type uh the horizontal Dimension is time so I'll just call this date and so it's a Time Dimension and give it the format of year- Q for quarter let's imported the data in and now I can attach that to a revel that's a a mock version to show you what you're actually working with if you've never seen the program before I want to uh I want to look look by date by country rather the other way around and I
put all countries just use the arrow key to go move that move it that in properly so all countries and then I want to look at uh household debt Al so no non-financial private non-financial sector debt and I want to look at data by the unit down here got a unit type so I want to see debt as a a domestic currency which is here and I can now Define that as a variable which is going to be just call it private and superscript DC for domestic currency and I Clos the lock and this is
like a SQL statement so it just brings out country by date where sector is private nonfinancial sector or unit type is domestic currency bring down a another lock attach that here and move the selector to percent of GDP this is now private debt in percentage terms percentage GDP un lock that together now that I've done that I just tidy things up a bit put this into uh compressed format to make it easier to see and now if I divide private debt and domestic currency by private debt as a percentage of GDP and then put that
through a percentage operator to multiply by 100 and cancel out the fact that I was dividing by the percentage rather than the ratio that is now GDP in domestic currency for the 43 countries in the database over 335 quarters so you can take a fast look at that I'll just attach that down here I can actually move this out of the way not get in the way the rest of the calculation so that's the information I'll just show it so that you've got it by uh the end of the data rather than the beginning so
that's the data for those particular countries that's given as JDP what I want also is the annual change in private dep so what I've got to do is put that through a change operator and that's up here I choose the change operator here attach those two together edit the change operator so it looks to change over the time dimension which is year rather than the country Dimension so I choose date here and go back four quarters because that's one year so I can now call this credit attach that to the output of the change block
and then let's just move this around a bit divide that by JDP and put that through a percentage operator and that is now credit crit as the percentage of JDP right there now I can take a copy of credit and a copy of private de as a percentage of GDP and let's make them put them the other order there and attach them to another couple of Revels you have as many Revels as you like in a document one there and one down here and then rubber band and ch choose choose uh link selected rvel so
whatever I do to one is done to the other put this one in editor mode okay and let's just move all this sideways a bit and now bring down a couple the charts so whack one there and take a copy of that and paste that down here attach credit down here and debt level there and currently you've got all the countries turning up which is right too many so I'm going to uh pardon me some of the stuff is hting up the menu on my my screen down below uh the monitor I'm recording from so
drag it up here so you can see so I'm going to sort the axis forward and having done that I know that I've got United States at the end of the axis while halfway through and there is America's private de to GDP ratio and there's The Plunge in credit from 15 % of GDP equivalent down to minus 5% pretty much that caused the global financial crisis if I then move the indicator to Japan which should have been the canary and the coal mine for all the stuff if we weren't led by economists we don't know
what the hell they're talking about uh that Crisis began in 1990 you can see credit peaked to 26% of GDP then and fell to minus 10 and let's take a look at Thailand which is the Asian financial crisis there's Thailand and the Asian CR financial crisis began in 1997 there's the end of 1996 and you can see the plunge from credit being 44% of shdp in 1995 and no wonder they had a good party in Thailand they have a flipping turnaround 1997 the crosses begins from 35% of JDP and it falls down to minus 30%
of JDP so it took me 7 minutes have a go and tell me how long it takes you to do it in your favorite program Anno neoc classical get my Funny Money bundle for free they want you to see through the fantasy P by mainstream economists they think they're leading us to economic equilibrium but instead they've led us into economic and ecological crisis so pause this video now and join about 10,000 other truth seekers in downloading the Funny Money bundle inside our WhatsApp Community by going to new. stcf free.com as well it's free this week
reveal one HS expose the lies new. stcf free.com for the wise


![Nassim Taleb - The Secret Rule That RUNS The WORLD [w/ Naval Ravikant]](https://img.youtube.com/vi/MwlW2aamDFc/maxresdefault.jpg)