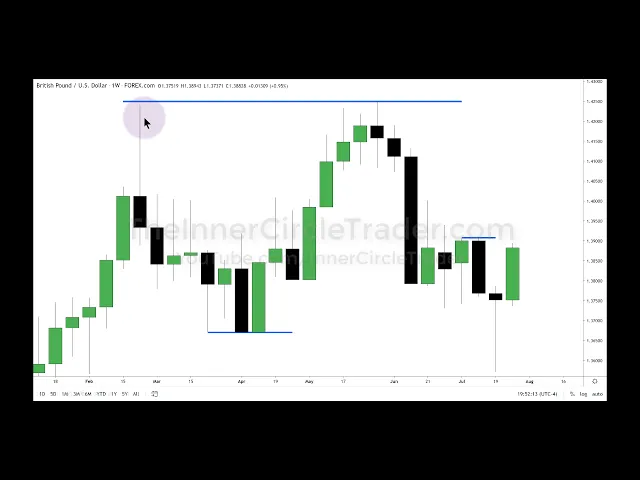
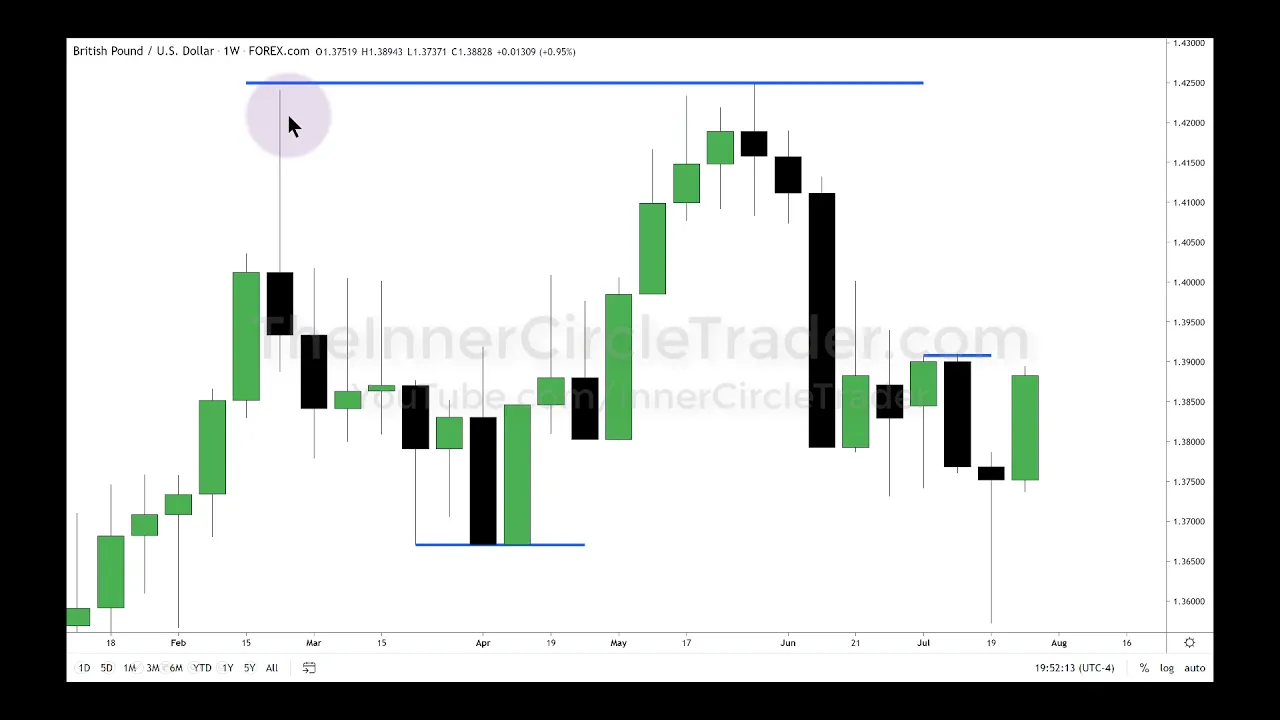
foreign all right folks welcome back this is volume two of the continuing series of five parts for the ict market maker series this installment will be focusing primarily on foundations to institutional order flow and understanding liquidity alright so when we're considering what the large institutions are doing and how to operate and engage in the foreign exchange market the premise i want to begin my trading with and my analysis with on the weekend is what i think the weekly charts going to do and that's what we're showing here is a weekly chart of the british pound
versus us dollar every candle in this chart represents the highest and lowest price for an individual weekly range and i sit down on my weekly chart and look for areas that are obvious okay what i mean by obvious years ago i taught that if you find a level that's too clean okay and it's just too straight edge chances are it's probably going to get swept what do i mean by that well if you look at this area right here notice how this candle goes to that low the body stops here the body stops here it
doesn't really have any kind of jagged end or bottom to it just real smooth and clean just like this high and this high has a relatively clean level up there and these two candles here have a really nice clean level to it and these right here pretty much the same thing but my eye jumps to these levels the significance about these levels is that below this level here is sell stops traders that went along here they had stop loss orders to protect that long in the form of cell stops so this level in here is
saturated with willing participants that want to sell at the market because their belief is if it goes below this level here they're probably wrong in their long idea and they want to get out before it causes them to lose more money conversely there are traders that will see this level as support and if it breaks their idea is well support's broken so it's probably bearish and they want to go short so how do you go short you sell so the function of the liquidity that rests below these smooth or clean equal lows is cell side
in nature so it's sell stops or sell side liquidity the market last week at the time of this recording it is july 27 2021 and the market trades down last week and sweeps below these clean candles okay so this area here gets attacked and notice it comes off that low and closes here on the week the week at present of this recording we opened here has small little movement below the opening of the week and then we had this movement higher now prior to this candle closing up here we didn't really know if it's going
to go down there and continue going lower or if it's going to reverse that's not necessary to find profitability and consistent setups all we're looking for is runs on liquidity okay so you have to know where the draw on liquidity is and that's what i'm showing you here this is what you're looking for areas that are too clean that may draw price up into them or down into them so just the opposite of what we saw down here what would be resting above these relative equal highs buy stops anyone that was short how well trader
protect his bearish position with a buy stop so any movement above here that would trigger buy stops on shorts and or some traders that see this as resistance if it breaks that they would see it as what resistance broke and therefore bullish so this is the closest draw on liquidity that's opposing this so when we started the week here we opened traded down just a little bit and started the trade higher where is it likely to go right above these highs doesn't mean it will absolutely do it but this is what we do we look
for areas where the draw on liquidity acts like a magnet okay imagine how this candle is gravitating towards this level here to attack and absorb the liquidity which rests in the form of buy stops which is opposite of what we saw down here so the buy stops here are the near-term draw on liquidity so institutional order flow for the week should be bullish until we get up into this area at that moment we have to reassess everything continuation if it's likely or reversal if it's likely or just consolidation but we don't need to know that
right now that starts the week here with the likelihood of running up into this area so the inability for a price to make a significant price run lower is the tip off that we're going to see institutional overflow or bias or trend or momentum to the upside until we get into this area right here for the purpose of attacking this buy side liquidity pool for the buy stops so if you zoom in here i want you to think about the weekly range in the context that the open and decline from the opening price anywhere in
this area close to the opening price or below it is ideal for going long this is the cheapest it's likely to get and the closest you can buy around that opening price the better as we get closer and closer to this area up here the idea of probability or low risk starts to dissipate because we have the likelihood that this could retrace back in this range now the time this recording it's only tuesday evening in my local time on the east coast of the united states but it could very easily continue and trade well beyond
these levels here into wednesday and thursday maybe even friday i don't need to know that the premise starts with we're down here we came off the low after taking stops it's probably going to make a run for this area up here for liquidity so the ideal scenario is if i'm thinking that that means the weekly range is likely to be bullish or at least i'm outlining it as that so for my qualitative analysis this is what i'm doing remember in the first volume we did quantitative analysis where there were measures that were data oriented this
is a little bit more subjective so that's why it's qualitative and the idea is if i'm bullish for the week i'm expecting monday and tuesday and early parts of wednesday to be bullish until we get to an area where the draw on liquidity is reached we're going to drop down to a daily chart here you can see monday's trading this is the candle for the entire range of trading on monday july 26 2021 and then tuesday's trading daily range for july 27 2021 and notice how monday we had a nice little rally higher and on
tuesday we opened here and then we traded down into this candle right there this candle is what i teach as a bullish order block the market's already bullish or the underlying narrative is bullish and we had a confirmation to market wants to go higher on monday it trades higher on tuesday we trade down into that level the opening price hits it trades off of that rallies back through and makes a higher high than that of on monday remember the candle opens here and then trades down this is a judas swing retail traders get caught up
in that on a lower time frame they think it's bearish and they start selling short and then when it hits a higher time frame level like this that's key or significant it'll reverse and start to trade higher and it catches them off guard some of you have probably noticed that i posted a trade or result of a trade that i did today in british pound versus us dollar this very market i'm showing you the framework in context because i knew i was teaching this today in the second volume of this teaching series so i'm teaching
you on the level of my youtube content and everyone's familiar with my concept of the order block through this youtube channel using the bias that suggests that this is likely to reach up into these buy stops so anticipating its continuation into wednesday to attack this now does it need to do it no because i've already been profitable on the entry and management of tuesday's trading dropping down to an hourly chart that blue line i used on the daily chart to identify the bullish order block level is now green here okay so i don't want to
trip you up i just want to have a contrast because of the time frame this level is that same bullish order block level on the daily just transposed to the hourly chart notice how the hourly chart trades down hits it and rebounds and starts to trade higher this is that area where the buy stops are this level and higher is where those buy stops reside so it's drawing price up there zooming in here you can see again this is the daily bullish order block level and i want you to look closer think about what i
was showing you on the weekly chart there's clean levels well there's singular candle lows and highs or swing point highs and swing point lows or swing lows and swing highs depending on how you want to say it they have stops of and below those as well this candle right here is a case in point we have a swing low a single candle that has a higher low to the right and a higher low to the left one single candle there that swing low is going to be seen as a short term swing low where sell
stops are sitting right below that because the markets rallied up it consolidated rallied again and when it's up in here all in this consolidation those that bought down here or even over here they have their stop loss trail right below that low and the market drops down to take those participants out and then rallies why is it going down there to accumulate sell stops why are they attacking the sales dots because this is attacking participants that are willing to sell at a lower price lower than what when it was up here institutional traders will not
buy up here they're going to wait for it to drop down to attack a very deep discounted price and pool of liquidity of sellers that want to sell at a cheap price because they trade their stop loss up there so these sell stops flood the market with sell orders and smart money buys them at the market so it goes right in here and buys them so this is called pairing of orders the market hits this and then price rallies now this is that same swing low zoomed in but i'm drawing your attention to these consecutive
down closed candles because this is a bullish order block the high to the opening price now why not the entire range like a supply and demand zone would be well this is not supply and demand so it's the high down to the opening price extend it out in time and the market drops down into that that's a bullish order block and it's taking out cell stops so a high probability order block is when it takes out stops and returns down to the order block itself not every down closed candle is a bull shoulder block and
not every up close candle is a bare shoulder block but if you are in a context that is bullish as i've outlined here and clearly proven i was trading with this bias today the underlying pinnings of the market is it's bullish so therefore down close candles to have a market move away from it and has a swing low just above it like we do here that's a confluence of specific things that make it high probability for the other block the order block is the consecutive down closed candles all three of them make up the order
block but the sensitive price point is the high and the opening so you can be a buyer at this high or at the opening price the easiest one is using the high and allowing your stock to absorb any adverse price movement against you that would if it was going to go back into say the opening price you have to consider that when you're placing your stop so how how does that affect your trade well when you're starting out without lowering any time frame beyond the 15 time frame here you can be buying at the high
and use the low of all the consecutive down closed candles your stop loss needs to be just below that now you may look at this and say oh no that's too much of a stop well that's all relative in the beginning it's good for you to try to trade like that because you don't want to be trying to be too precise because many times the market will slice and dice you if you're trying to be too finicky about your entries and your stops it can be very easy for the marketplace to take your two pip
stop loss three pip stop loss it can do it okay because the broker has the right and freedom to do that and they will i'm not saying you can't use a very small ultra tight stop loss but doing it as consistently over and over and over again uh the broker will just widen the spread and take you out and there's nothing you can do about it so to repeat a bullish order block that's high probability is when the market's already predisposed to go higher it's shown a willingness to go higher and leave this area here
and we have a short term low so it has stops in a bullish market and it trades down below that level here and into consecutive down closed candles so you would be buying at the high plus the spread and your stop will be below this low right there and that would be your underlying risk does the market stay there very long once it trades into it no leaves it consolidates rallies again comes back down into another order block here trades lower accumulates and rallies again trades one more time retracement and then blasts off and attacks
all the buy stops that were resting above these clean highs notice also before the market starts to rally it generally takes out some short-term swing low this low took out this swing low this low took out this swing low this low took out this swing low each time there's a dynamic rally higher this swing low was taken out by this swing low and it rallies higher this swing low is taken out by that swing low not by much but it's all it takes and then it starts to move higher so when there's a run on
liquidity that's opposed to the underlying direction in other words if we're bullish on a market like this get comfortable with the market reaching underneath lows and stop thinking that it's going to be breaking down entirely or reversing most of the time you're going to find that it's taking those cell stops out and absorbing them to offer smart money buying opportunities at deep discount prices finally we're looking at price on monday and today tuesday and i want you to notice how the market does what it creates the low in london which is exactly what i teach
on my youtube channel and then a continuation in new york session on tuesday it creates the low of the day and a continuation in new york and it rallies up it's consolidating in here and where does the liquidity reside again this blue line is that weekly line i drew out that was a clean level where the buy stops are so the market's most likely going to draw up into that 139 big figure 139 10 and the institutional level 139 20 could potentially be traded too as well to make sure it really sweeps out all those
buy stops now what's the vested interest for the market to send price that high because smart money has bought down here they bought down here and they bought down here where do they want to get out at a high price who's willing to buy it from them at a high price the buy stops resting just above that level here i noted on the weekly chart so we covered several things in here foundations to institutional order flow how do we frame that we look for the weekly range we look for clean levels very clean levels your
eyes need to be trained to look for them and the easiest way to do that is go through back logging and look at old historical price moves and mark them up on your chart that historical study will train your eye and activate your reticular activating system and that means when you see something over and over again it makes you sensitive to it so that way you will start to anticipate it when you see familiar patterns in live price action and it makes you better at reading the tape reading the tape is to simply understand what
the market's doing live or what's about to do next okay so hopefully you found something in this that was helpful and insightful and i'll talk to you in the next installment be safe