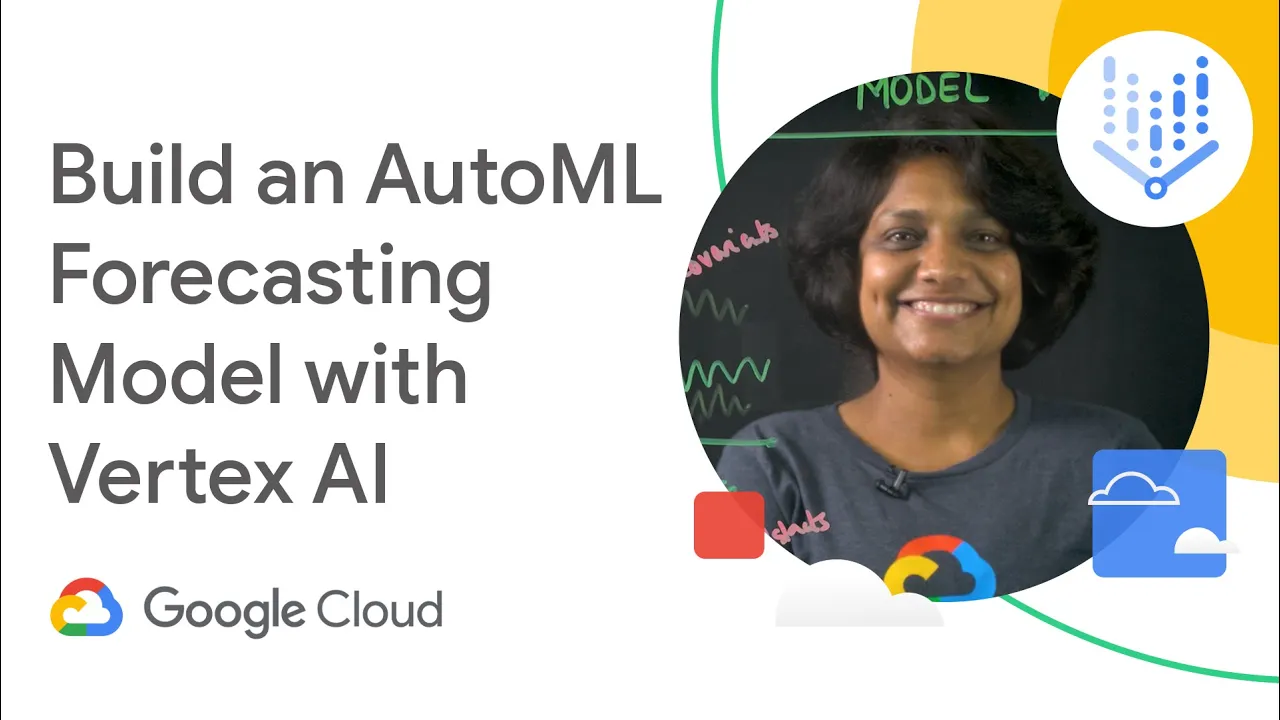
hi i'm priyanka vargaria and this is ai simplified where we learn to make our data useful in this video we are predicting the future that sounds like i'm an astrologer but not really we are going to predict a different kind of future influenced by data yeah you're right we are covering forecasting models what they are and how to create them in vertex forecast but before we dive into it what are some of the applications of forecasting say you're a retailer and you need to predict product demand or sales or you're a call center manager and
you're predicting the call volume to hire more representatives you're a hotel chain predicting hotel occupancy for next season or you're a hospital and forecasting bed occupancy you get the idea forecasting data sets come in many shapes and sizes there are univariate data sets where we observe a single variable over a period of time for example you can think about weather data or airlines data even though it's just one variable sometimes this is all that you need to forecast your data into the future you can see clear patterns the seasonal peaks and also the trends in
that data more often we are faced with multivariate data sets where you have historical observations of the variables you're forecasting and other related time series these are often referred to as covariance and covariance because the value varies with the target variable these related time series can be very helpful to forecast your target variable and maybe for example you're plotting rain versus umbrella sales versus uber rides now we all know how taxis can be hard to get when it suddenly starts to rain so as an owner of a taxi company i can use the weather forecast
to anticipate the higher demand in my cars and bring the cars online be aware that not all co-variants are useful even if they correlate strongly with your target variable some common examples of covariance used in retail forecasting are holidays third-party forecasts such as weather and you can have planned promotions foot traffic to the stores and so on up next we are going to look at forecasting algorithms now here are the algorithms we can use for forecasting the most popular methods today are statistical methods which are also called as classical methods there are many types of
statistical models including arima models that are being used for most popular use cases now google offers an advanced arima plus model with bqml which is bigquery ml the other class is machine learning models like various tree based methods and neural networks now these deep learning models have been gaining a lot of popularity for forecasting applications over the past few years now obviously there's still a lot of debate on when to apply which methods but it's becoming increasingly clear that neural networks are here to stay for forecasting applications these methods perform fairly well across a broad
range of forecasting problems and particularly well when dealing with forecasting newer item demands and these are called cold starts and forecasting cold starts on items with limited or varying historical data now deep learning models cross learn across very large groups of related time series with varying lengths and missing data the good news is that you don't really need to know exactly which architecture to use because vertex forecast does that for you now we can build forecasting models in vertex using advanced automl algorithms for neural network architecture search now we automated the pre-processing of your time
series data and instead of fumbling into data types and transformations you can just load your data into the data set in vertex ai and auto ml would automatically apply those common transformations and even engineer features for you and required required for modeling now most importantly we could evaluate hundreds of models in parallel to find the right architecture for your particular data set and this requires a lot of computational resources but because we can run all these trials in parallel we're still able to find the best model and tune it to your particular data set in
the fraction of time it typically takes for a traditional method and of course we can assemble the best model and together to ensure the model is stable across a wide range of predicted outputs now how does all this work let's jump into the console and see from our vertex ai dashboard we create a new tabular data set we can see there is an option for forecasting you may be curious if you can apply a regression model to your time series data now the difference between them is that regression and classification the target's predicted value depends
only on the values of the feature columns in the same row now in forecasting the target's predicted value also depends on the context values of the target and the features now we will see more on this further in the demo in regression and classification problems the output is one value but as you can imagine in forecasting problems the output is a sequence of values now let's select forecasting here and proceed we are using the iowa liquor sales public data set available in bigquery now it consists of wholesale liquor purchases in united states state of iowa
since 2012 and we can preview this data here for the purpose of this demo i have already done some basic data pre-processing to group the purchases by day and we will use a csv extract from the bigquery table now back in our data set let's import the data from our cloud storage bucket you can also upload the data directly from your computer or bigquery table here once the data is imported we can configure the model features now time series identifier column is to specify what time series a row belongs to now every unique combination of
key values defines a different time series for example here in id is our time series identifier now if we need to forecast on multiple time series such as product and store levels both of those could be used as keys now time column is the identifier such as date or days etc why is our sum of purchases that day and holiday is a boolean to indicate a holiday then we can train the model select the target column this is the value we are predicting so in our case it is sales or the y column we've already
set our time series identifier and the time column so next we need to set the data frequency i'm selecting hourly here and setting the forecasting horizon to 7. this specifies the number of periods that the model can predict into the future now historical context window i'm setting to 30 hours here this means that the model will use data from previous 30 hours to make a prediction there are trade-offs between shorter and longer windows and generally selecting a value between one to five times the forecasting horizon is recommended now let's check the box to export test
data set to bigquery we can leave it blank and it will automatically create a data set and table in our project within bigquery now in the training options we can specify more details about how we would like to train the model set these columns to available for new forecast because we know this information already change the optimization objective to mae or mean average error which is more resilient to outliers and because we are working with daily purchase data that can have wild fluctuations mae is an appropriate metric to use here before we initiate the training
set a budget in this case one note hour is sufficient to train the model now once the model is trained we can evaluate it and go to bigquery console to view the predictions on test data a new data set is automatically created where we find the evaluated data items table to review the predictions this table has a couple new columns here now predicted on date column which is the date that the predictions were made and predicted y column is the predicted sales value now finally we would want to use your model to make predictions we
have an input file in the csv format on cloud storage and it contains empty values for the dates to be predicted along with the historical data after it is complete we can click on the batch prediction job to view the details including the export location we sent our predictions to bigquery which we can see here and the job creates two different files or tables one contains any rows with errors and the other contains predictions lastly now that we have our batch predictions ready we can evaluate our forecasts in data studio which is google's free data
visualization tool the blue line shows my historical values and the red lines are my forecast now looks like the model picked up on quite a bit of signal in the data okay so in this video we learned about forecasting models what they are and how to create them in vertex forecast give this a try yourself and send me your questions in the comments below

![End-To-End: No Code - AutoML in Vertex AI for ML Operations [notebook 02a]](https://img.youtube.com/vi/ZZadMQTKJXk/maxresdefault.jpg)