welcome back folks this is lesson three in the January 2017 content for the ICT mentorship I'm gonna be discussing how to use inter-market analysis okay our internet market analysis presentation here is going to be predominantly conceptualized thinking so there's no charts here there's nothing exciting okay but it's dry useful information but it's very very dry so I'm going to warn you ahead of time so if you're trying to do something apart from 100 attention you want to see this lesson for a time when you can focus on the presentation very closely and take notes okay
so World Markets are directly linked to one another and it's probably a common understanding but a lot of people don't realize exactly how they're related what relationships exists what correlations if the if you will exist between certain Market asset classes certain groups in certain sectors uh there's closely related uh correlations between some unexpected markets where without having a global or macro understanding of what they do as a country in terms of exports you wouldn't understand what the relationships would be without having that information or that study behind you so understanding them as a collective whole
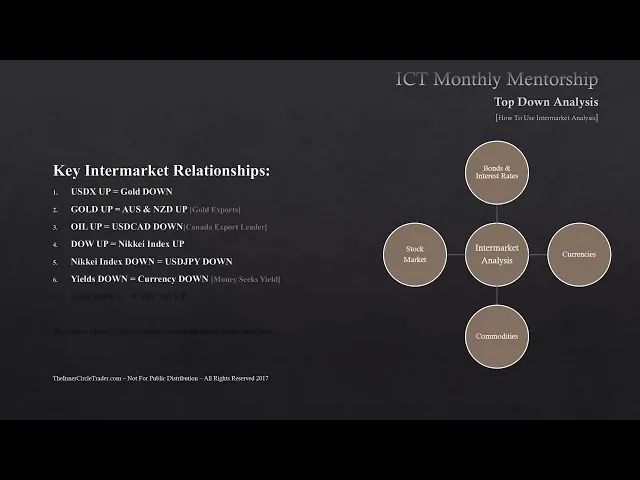
or how these markets relate with one another will Aid in your analysis and now since the January content is predominantly focused on 100 long-term analysis our Focus needs to be on the relationships of these four groups the four major groups of inter-market analysis are as follows to bond in interest rate markets the commodity markets the stock market and the currencies Market all four of these groups together are closely related with one another now they don't move lock step to one another there's not a Five Points higher for bonds therefore it's going to be five points
in another asset class or group that's going to move in relationship to that movement it doesn't work like that since we're looking at long-term macro perspectives and Analysis Concepts there's going to be a certain measure of lead and lag time for some of these Market relationships and for some of you that's going to turn you off right away because you're used to knowing this is what it's supposed to do and therefore I'm going to expect it right now and when you're being a long-term Trader or using long-term analysis there's going to be a certain measure
of lead time and lag time before you actually see the marketplace reflect what would be expected in terms of the analysis Concepts but the benefit of this is and this is what I have gravitated towards you can use an economist Theory which is instead of going through fundamental data looking at things like CPI or employment trends or all these fundamental data points that are released throughout the month every single month that's just too much information for me to digest and I don't ever claim to have the mental capacity to understand it all in fact I've
said many times in all of my teachings that I don't believe that there is a realistic way of staying abreast of all those types of things if you're wading through all that data I mean either you have to be a serious data nut or it to me it's over everyone's head you just I just don't think it could be done I'd love to meet someone that could do it fundamentally improve beyond the shadow of a doubt that they can use that fundamental data to forecast future prices okay that would be wonderful if I could find
that that would be something I would probably add to my repertoire but in my studies I've never been able to really ascertain anyone to be able to use that information and be able to forecast with a great deal of accuracy if you will now even on a long term basis because the markets are slow to come to fruition these these Market moves take a long time to develop and unfold in our charts it takes a great deal of patience and while there's a lot of information to Wade through if you go through it fundamentally and
using all those data points and and data to me if we just focus on these four major groups it'll give us all the insights that that data will ultimately give give you a fundamentalist so what I mean by that we're going to actually break down some of the relationships as we go through this mentorship but in this teaching here I want to give you kind of like an overview and some of the things that I have picked up along the way as a Trader that I like to focus on when I'm looking at Market relationships
all right so enter market analysis overview now the four major groups for the inter market analysis the bond market and interest rate Market bonds and stocks generally they move together okay so if we're seeing a Bond Market rally and it's the bond prices not the yield okay so if we're looking at the treasury bond market and the bond prices are rallying higher in an uptrend generally that's going to be helpful and supportive of a bull market for stocks conversely if you see the bomb the bond market in a bear Market it's been trending lower it's
going to be very hard for stocks to Rally in that environment now it doesn't mean that it can't rally okay it just means that that underlying trend of the bond market moving lower is going to have a effect and weight on that stock market rally and eventually you're going to have to pay the piper and that stock market's going to have to correct and get back in alignment with the overall trend of the bond market Commodities are a market group that moved opposite to the bond prices so if we see bonds moving higher Commodities will
be moving lower in relationship to that move and our third Group stock market stocks move together with bonds as we said you have to constantly refer to the market indices for stocks and the bond market or if you're a stock Trader you can use the information that's gleaned from the bond market preferably if you're going to be a stock market Trader you want to be looking at the bond market as a indicator that you have underlying strength in the bond market so if bond prices are going higher and your buyer of stocks then you can
go in with a great deal of confidence that you have the fundamentals behind you that lower interest rates with the bond prices rallying stocks like that if bonds are trading lower stocks don't like higher interest rates and that's what's going to happen if you see bond prices dropping that means the interest rate yields are actually increasing bonds do not like a high interest rate environment and currencies obviously are influenced by Commodities so the effects of export sales and production in relationship to certain Commodities that's going to have a direct impact on specific Commodities and specific
currencies okay we're gonna look at their first relationship here as the U.S dollar versus commodities okay we're going to look at this as a inversely related relationship in other words they move opposites to each other that means if the dollar Index is moving One Direction the commodity in as a group as a whole Commodities will be moving the opposite direction so for example specifically US dollar Index if it's trading higher Commodities as a whole should be trending lower and if the dollar Index is trending lower or trading lower Commodities will be doing the opposite and
going higher now when we're looking at Commodities okay grains in agriculturals are very export sensitive so if we have a strong dollar that's going to diminish the desire or demand for exports in the form of grains and livestock agricultural markets in other words grains and meats and if the US dollar Index shows weakness that instills an increase or demand for grain in agricultural exports US dollar Index if it's going higher or rallying this is also seen with stocks and bonds moving up because it's supportive of the stock and bond market going higher US dollar Index
if it moves lower this is seen with support with stocks and bonds both trending lower as well US dollar Index if it's moving higher this is going to be seen with commodity currencies moving lower in dollar Index if it's moving down it's going to see a commodity currency Rally or movement higher and the way you measure this is you could look at the US dollar Index versus the crb index which is commodity research Bureau index you can get that information on the internet at crbtrader.com I'll give you some notes in the PDF file that would
include more information on all the things that you'll hear about in this presentation okay the next one is the bonds versus commodities and bonds and commodities have an inverse relationship as well that means they again move opposite to one another now if the bond prices or the treasury bond market okay moves up or trades higher that generally is going to have a impact on Commodities moving lower and if bonds are trending or trading lower that's going to allow Commodities to Rally now when we're looking at the relationship between bonds or treasury bonds 30 year treasury
nodes and the commodity Market what we're really focusing on is inflationary impact so if we're following along and looking for signs of inflation it's going to be noticed in the markets that are Commodities Commodities are the leading indication for inflationary environments so what's the lead in lag time in a change or long-term basis for the bond and commodity relationships because we're dealing with a long-term macro perspective on these two assets it can sometimes take 6 to 12 months before you see a change in trend on the relationship between the bonds and the commodities now that
means that Commodities may turn up and bonds may eventually turn lower as a result later on or bonds may turn up and commodities may turn lower later on as a result of that it doesn't happen lock step for step it doesn't give you that immediate feedback because it's long-term macro fundamentals are behind these big moves especially when we're dealing with these two asset classes in the relationship basis so it takes a long time sometimes for the effects of interest rate changes or supply and demand factors that are really weighed in the consumption or production of
Commodities as a whole now treasury bonds or t-bonds versus the crb index is what you'll be using to measure the relationship between the two but the crb index let me add this to your notes it's very heavily weighted with the Agricultural and grain markets so when we look at crb index it's very very heavy on soybean prices wheat prices corn prices cattle prices hog prices okay so you have to keep that in mind when you're looking at crb index foreign you want to use the Goldman Sachs commodity index when you're looking for the energy focused
side of the marketplace in other words it's heavily weighted on energy and you want to weigh that against the bond market and the Goldman Sachs industrial metal index and this is um for focus on global Trends and it's not meant for metals like silver Palladium platinum gold okay these metals are like zinc tin copper aluminum they're Industrial Metals so they're heavily sensitive to Global Trends and big sensitive tendencies in the marketplace around the world where if there's a big demand for Industrial Metals then you'll see it in this index if there's not there's also going
to be evidence of that in this index as well and in summary bond yields when they're going higher that would be seen with the bond market going lower or the bond price is going lower that means bond yields are increasing and that's going to push Commodities up and my bond yields are going down that means the treasury bond market prices are going higher that's going to push Commodities down okay we're going to look at the bonds versus the stock market now this has a positive correlation that means they move in the same direction and obviously
that means when the bond market is trending higher or trading higher that's going to provide strength for stocks and support for it name of the bond markets trending or moving lower this will have an effect that's bearish on stocks and the bond market or the treasury bond or 30-year Benchmark acts as a leading indicator for stock Direction the lead in lag time in changes for long-term trends again can be 6 to 12 months in duration that means what you see going on in the long-term trends of the bond market may take a little bit of
time up to yes I say a year before you see these long-term trends start to manifest themselves in the stock market now there's one caveat with this okay when there's deflationary periods that means when prices are decreasing and this is a rarity it doesn't happen a lot we actually saw this in the latter part of 1998 it was it was indicated in the in the markets that there was potentially that happening but when this occurs the bonds perform very well because you're actually seeing the interest rate markets collapsing but with bonds going up that's usually
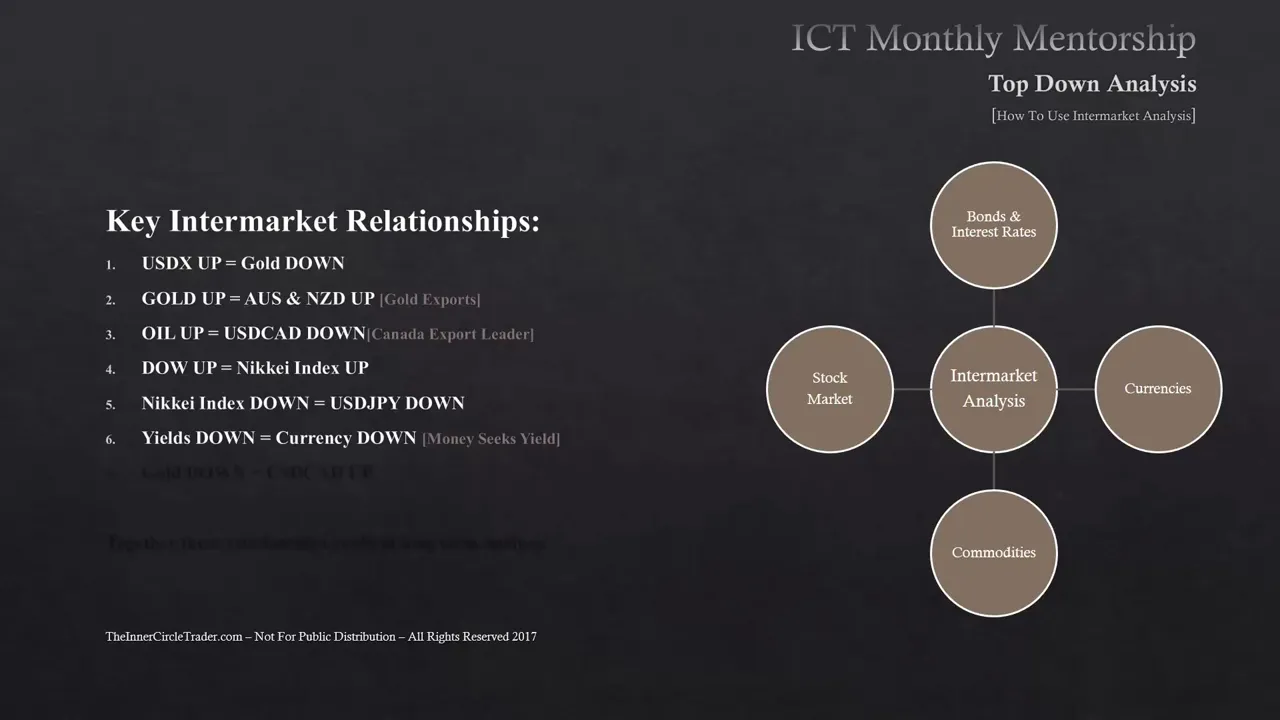
seen in a in a deflationary period you're usually seeing bonds going higher the bond prices or treasury bonds price going higher with stocks going lower and commodities going down like I said it's a rarity that ever happens but usually you would not ever really going to see a deflation appear that I can imagine anytime soon okay finally we're gonna look at some key inter-market relationships okay when you're bullish dollar Index you're gonna be expecting bearishness on gold bullishness on gold you're gonna be expecting Aussie New Zealand to be bullish because of their nature as a
gold exporter when oil is bullish you're gonna be bearish on U.S CAD uh because of the Canadian export leadership and oil exports Dow when it's up or bullish that's knee K index is bullish as well is it direct relationship to the Dow Nikkei and when Nikkei index is down uh that's going to be bearish for the US dollar versus Japanese Yen pair and generally when yields are down or bearish that's going to be bearish for the currency because money seeks yield and when gold is bearish that's usually bullish for US dollar versus CAD and finally
uh by having an understanding of all these relationships as a whole conceptually they give you confirmation of long-term analysis uh the relationships between all of them if you're seeing a number of these things in alignment with your long-term analysis you're probably on to the right path you know what you're looking at the right direction in the marketplace rarely will you see a wide disparity with all these things not aligning if you have a good sample size of some of these things in alignment generally your long-term analysis is probably going to be true to form it'll
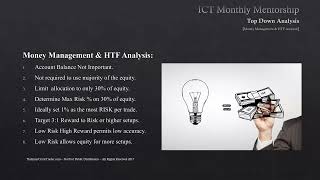
probably pan out in the long-term Direction like you think it will the problem is timing long-term Trend trading or long-term analysis and timing are just in my opinion some of the hardest things to time because it's hard to get traders to focus on allowing a little bit more movement against their underlying entry point what I mean by that is because you're trading on higher time frame charts it's probably because of your your home life your time constraints that keep you from being able to trade with a lower time frame entry so you're forced many times
to trade off of a daily chart and if you're going to execute off of a daily chart you're going to have to permit yourself a great deal of movement against you in terms of a stop loss because your ranges are a lot larger and you have to require a lot more time but even with that said if you're going to be using these points of information and relationships with inter-market analysis it's going to help you in any in all facets of trading regardless of your day trading scalping short-term trading swing trading you know or position
trading and long-term scope it's beneficial to know these things and it helps build probabilities in your favor and again nothing in here equates to 100 a surety uh you know there's absolutely no guarantee that nothing out there can't change on drop of a hat which you think you see in the charts could always be wrong because there's always a human element that's always involved here then the analyst is you but I think if you were to spend some time going over the relationships that's gone through this presentation if you spend that time look at it
on a macro level you'll see that there's a great deal of value in knowing these relationships and because they are leading you to a long-term Trend following directional bias using higher time frame daily charts it will give you confidence as a Trader to know that you're trading with the underlying fundamentals and you don't really require all of that time and energy and and diligence needed to go through fundamental data the relationships between these markets as we outlined in this presentation will take you to the same outcome that fundamental data will give you so just like
the relationships here will sometimes lag that same lagging effect that happens in the fundamental data I knew this much about fundamental data just because the fundamentals suggest something should be bullish doesn't mean tomorrow it's going to go straight up okay there's going to be time that has to be built in for that market to start building in a bullish tenancy and then it'll start to move higher but long-term macro Trends okay you can see when they're starting and shifting and moving into place by using the information that we shared in this presentation so again study
it believe me when I tell you the information in this is worth its weight in gold it's not something that is sexy it's not a lot of charts where I can show you Judas swings and patterns and all this and that but it's real information that has a direct relationship to how the markets work as a whole how they tie together and it keeps you out of having to look at fundamental data and if there's anything else that you know you can't associate with in terms of value that's enough there's so many things out there
you would be wasting my opinion your time you're going through all that data and when you could just simply see what price is telling you because price in all these asset classes together as a whole will reflect what the fundamentals are actually doing because trained accredited staff at these big institutions Banks producers manufacturers and exporters they're using that real fundamental data they have people that are trained accredited and they're able to use the information to forecast Trends in sales and and consumption all those types of things and they make their business plans around those those
data points I can't keep abreast of all that stuff there's too many things that's going on in my own personal life let alone you know to keep up with all the ever-changing things in the marketplace so if I can look at the price of these asset classes and the relationship between the all of all four of them in concert with one another I will just like you will come to the conclusion of what the geopolitical macro Trend and there I say it fundamental perspective is on the market as a macro perspective Trader until next time
wish good luck and good Trading