Enterprise Profitability and Cost Management gives you a secure, user-driven modeling environment to transform your financial data using multistep allocations and calculations. Calculation modeling and timing is controlled by end users, and all your calculations are transparent and traceable, providing a safe, accessible modeling sandbox outside your general ledger. You can add dimensionality and granularity to create the management reports you need, such as strategic, multidimensional profit and loss reporting; product and service cost reporting; cost awareness reports in areas like quality, support, care, delivery, and service; and cost control, reduction, and benchmarking reports The modeling process starts with creating models.
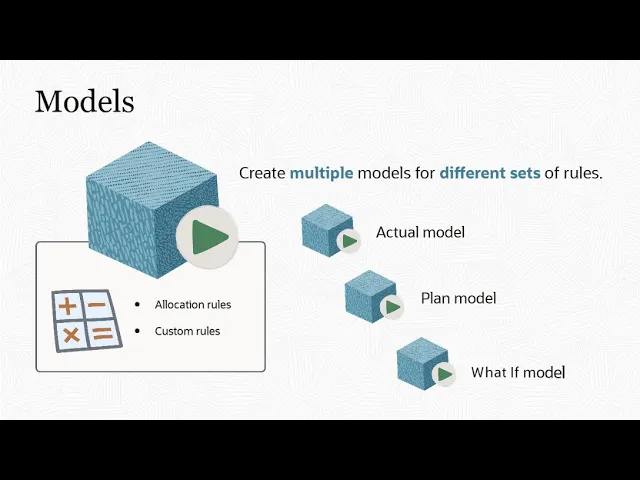
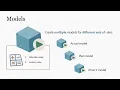
Models are containers for allocation and custom rules. If you have different sets of rules that you want to apply to your data, create multiple models. For example, you can create one model for calculating Actual data, a second model for calculating Plan data, and a third model for calculating What If scenarios.
You can run different models against the same base financial data to analyze how different drivers or allocation scenarios affect your end results. The rules in models tell the system how to execute allocations and custom rules. You can sequence rules and group them into sets, order of your calculation logic.
order of your calculation logic. The Waterfall Setup tab shows the full sequence of rule sets and rules for the model. The user-friendly Rule Designer lets you create broad, complex allocations without any custom coding or reliance on IT for programming.
You simply define the allocation source— where the data you’re allocating starts out, the destination— where the allocated data needs to go, an allocation driver, and how to offset the allocated data. In this example, facilities expenses for the Corporate cost center are allocated to the Facilities account across multiple cost centers. The driver definition tells the system how to split the source data across the destinations.
You can allocate data evenly across all destinations, or select a driver to determine the allocation percentages. The facilities allocation uses a driver of Occupancy Square Feet. And the offset tells the system how to balance out the allocated data.
Where allocation rules let you move data, custom rules let you modify data in place. In a custom rule, you specify the target range for the calculation and the formula to execute for all cells in that range. You can use custom rules to calculate driver data, create what-if changes, and adjust costs and revenues.
Before running models, you validate them to make sure there are no potential calculation failures. The validation checks each rule for these conditions: Each rule is fully defined; that is, the source, destination, and target definitions for each rule includes members from every dimension. Dimension members referenced in your rule definitions exist in the database.
If you delete members from your dimensions that are referenced in existing rules, the rules can’t run. Custom formulas are valid. You run models against one or more data POVs.
For example, you might run your forecasting model against twelve periods of data. When you run a model against a data POV, the system layers your results on top of your source data without changing it, making it easy to undo or redo running a single rule, a rule set, or all of your rules at once, an unlimited number of times. This approach makes it easy to individually examine each layer of calculation, rule by rule, which provides transparency, credibility, and traceability to your allocations.
Unlike in the general ledger, where reversing allocations and adjustments requires reverse adjustments or restoring data back to a point before the calculations took place, here you can simply clear calculated data. The system also keeps snapshots of your models when you run them. If you make changes to rules in a model later, you still have a complete record of the rules that generated each calculation.
You can compare model snapshots to the current model, and also use them to create new models. You validate your results in the Rule Balancing screen, where you see each rule and its impact. Clicking a linked data point opens a context- sensitive ad hoc report in Smart View.
Want to see which entities were affected by this allocation? In Smart View, you can add more context to your results, drill down for more detail, and pivot the data. You can gain real insight right away for making business decisions.
To learn more, visit docs. oracle. com.